. 2025 Feb;26(2):240-251.
doi: 10.1038/s41590-024-02044-z. Epub 2025 Jan 9.

Low-avidity T cells drive endogenous tumor immunity in mice and humans

Affiliations

Low-avidity T cells drive endogenous tumor immunity in mice and humans

Summit Singhaviranon et al. Nat Immunol. 2025 Feb.

Abstract

T cells recognize neoepitope peptide-major histocompatibility complex class I on cancer cells. The strength (or avidity) of the T cell receptor-peptide-major histocompatibility complex class I interaction is a critical variable in immune control of cancers. Here, we analyze neoepitope-specific CD8 cells of distinct avidities and show that low-avidity T cells are the sole mediators of cancer control in mice and are solely responsive to checkpoint blockade in mice and humans. High-avidity T cells are ineffective and immune-suppressive. The mechanistic basis of these differences lies in the higher exhaustion status of high-avidity cells. High-avidity T cells have a distinct transcriptomic profile that is used here to calculate an 'avidity score', which we then use for in silico identification of low-avidity and high-avidity T cells in mice and humans. Surprisingly, CD8+ T cells with identical T cell receptors exhibit wide variation in avidities, suggesting an additional level of regulation of T cell activity. Aside from providing a better understanding of endogenous T cell responses to cancer, these findings might instruct future immunotherapy strategies.


Conflict of interest statement

Competing interests: P.K.S. is a founder of Agenus and a founder, board member and stock owner of Life Science Pharmaceuticals. The other authors declare no competing interests.

Figures
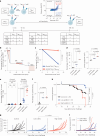
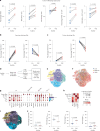
Fig. 1
Fig. 1. CD8+ T cells with low avidity confer superior antitumor immunity in vivo.
a, A method to separate antigen-specific low-avidity, medium-avidity and high-avidity T cells. A representative dot plot of gates used for sorting of low-avidity and high-avidity T cells is shown (see ‘Modified tetramer decay assay’ in the Methods). b, A representative decay plot of PDPRMUT-specific CD8+ TILs from a Meth A tumor. c, T cells that were PE+BV421+ or PE+BV421 after 15 min (as in Extended Data Fig. 1e) were re-stained with BV421-labeled and PE-labeled tetramers. The re-decay of the BV421-labeled tetramers was monitored after 0 and 15 min. The proportions of tetramer double-positive cells at 0 and 15 min are shown. The s.e.m. is indicated by the error bars. d, Control (tetramer-negative), low-avidity or high-avidity cells (obtained as in Extended Data Fig. 1e) were restimulated in vitro and stained for ZAP70-pY292. The proportion of positive cells (left) and MFI (right) in CD8+ T cells are shown. e, Control, low-avidity or high-avidity CD8+ cells (obtained as in Extended Data Fig. 1e) were restimulated in vitro. The proportion of IFNγ+CD8+ T cells is shown. f, An in vitro killing assay with control, low-avidity or high-avidity CD8+ cells (obtained as in Extended Data Fig. 1e) was conducted (Methods). gi, Control, low-avidity or high-avidity CD8+ cells (obtained as in Extended Data Fig. 1e) of PDPRMUT (g,h) or GTF2bMUT (i) peptide-immunized BALB/c mice were adoptively transferred (intravenously) into mice bearing 10-day-old Meth A tumors. The kinetics of tumor growth in individual mice with the statistical analysis of tumor growth calculated using the tumor control index, as well as the comparison of summary plots of tumor growth data (g,i) (Extended Data Fig. 2a,b) and the survival of mice (h) are shown. P values for a two-way analysis of variance (ANOVA) (c), a two-tailed paired t-test (d), a one-way ANOVA (e,f), a two-tailed t-test (g,i) and Mantel–Cox survival analysis (h) are shown. Each point in df represents technical replicates of samples pooled from several individual mice; each point in c represents biological replicates. Panels a and b were created using BioRender.com. Source data
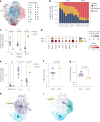
Fig. 2
Fig. 2. High-avidity CD8+ T cells express higher levels of exhaustion markers than those with low avidity.
a, Low-avidity and high-avidity TILs from 28-day tumor-bearing BALB/c mice were isolated as in Fig. 1a,b. The proportion of TIM3+ cells, the MFI of TIM3 cells, the proportion of TOX+ cells, the proportion of cells expressing TIM3 in TOX+ cells and the MFI of TIM3 in TOX+ cells in low-avidity and high-avidity PDPRMUT-specific CD8+ TILs are shown. b, Proportion of TIM3+TCF1 (left) and TIM3TCF1+ (right) low-avidity and high-avidity PDPRMUT-specific CD8+ T cells from the LNs of PDPRMUT peptide-immunized mice. c, Proportion of TIM3+TCF1 (left) and TIM3TCF1+ (right) low-avidity and high-avidity PDPRMUT-specific CD8+ T cells from tumor-draining LNs of mice 7 days after tumor challenge. d, Design for the isolation of PDPRMUT-specific CD8+ TIL cells for multi-omic sequencing (Methods). e, UMAP of cells obtained as in d, showing unbiased clusters based on their transcriptomes. f, Cells in the UMAP (e) were labeled with their individual TCR avidities as indicated. g, Relative mean expression (color intensity) and proportion of cells expressing (circle size) selected DEGs in each cluster. The genes characteristic of the four cell types are indicated at the top. The number of cells in each cluster is indicated by a horizontal bar graph at the right edge of the dot plot. h, Relative expression (color intensity) of each CITE-seq antibody in each cluster. The asterisks in the matrix plot indicate significantly upregulated (white) and downregulated (black) expression of surface proteins. i, Inferred differentiation, based on each cell’s RNA velocity and transcriptome, for all cells obtained from d. j, Cluster composition of low-avidity and high-avidity antigen-specific CD8+ TILs as in e (gating strategy in Extended Data Fig. 5e,f). Source data
Fig. 3
Fig. 3. Differentiation toward exhaustion in TCR clonotypes with high avidity.
a, UMAP of TCRαβ+ T cells. Clonotypes containing more than 40 cells (each denoted by a unique number) are indicated in different hues of blue (low avidity) or red (high avidity). b, Proportion of cells in each clonotype with low, medium or high avidity, as determined experimentally. Groups determined using k-mean clustering of the proportion of low-avidity, medium-avidity and high-avidity cells in each clonotype are indicated in purple (KM_1) and yellow (KM_2). c, The proportion of low-avidity, medium-avidity and high-avidity cells in each clonotype are indicated for KM_1 and KM_2. d, A dot plot depicting the relative mean expression (color intensity) and the proportion of cells expressing (circle size) DEGs (Supplementary Table 2) related to TCR signaling is shown for KM_1 and KM_2. The number of cells in each group is indicated by a horizontal bar graph at the right edge of the dot plot. e, The proportion of cells in each clonotype that are stem-like, TEFF‐EX or TEX is shown for KM_1 and KM_2. f,g, Median expression of TIM3 (f) and CX3CR1 (g), as measured using CITE-seq, for each clonotype in KM_1 and KM_2. h,i, Partition-based graph abstraction plots (Methods) depicting the most confidently inferred differentiation pathway, based on each cluster’s RNA velocity and transcriptome, of KM_1 (h) and KM_2 (i). P values for a two-tailed paired t-test (g,h) and two-way ANOVA (c,d) with corrections for multiple comparisons are shown. Each point in c,eg represents individual clonotypes that are treated as biological replicates. Source data
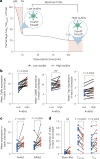
Fig. 4
Fig. 4. Intraclonotypic variation in TCR avidity of CD8+ TILs is associated with TCR signaling and T cell phenotype.
a, Summary image depicting the presence of CD8+ TILs with identical TCRs with substantially different measured TCR avidities. b,c, Pairwise comparisons of the mean expression of Cd8a (b, left), Cd8b1 (b, middle), Trac (b, right), Nr4a1 (c, left) and Nfkb2 (c, right) for cells with low (blue) or high (red) avidity in the same clonotype. The blue (low avidity) and red (high avidity) symbols connected by a single black line represent cells of the same clonotype. d, Proportion of cells with low (blue) and high (red) avidity in the same clonotype that are stem-like, TEFF‐EX or TEX. P values for a two-tailed paired t-test (b,c) and two-way ANOVA, with corrections for multiple comparisons (d) are shown. Each point in bd represents low-avidity or high-avidity T cells from a given clonotype and are treated as biological replicates. Panel a was created using BioRender.com. Source data
Fig. 5
Fig. 5. Low-avidity CD8+ T cells are the sole responders to checkpoint blockade in vivo.
ae, Low-avidity (blue) antigen-specific, high-avidity (red) antigen-specific or control tetramer-negative (black) CD8+ T cells were adoptively transferred (intravenously) into BALB/c mice 10 days after Meth A challenge. Mice were then treated with antibodies against PD-1 (weekly), CTLA-4 (twice weekly) or isotype control antibody, starting 13 days after the tumor challenge. The kinetics of tumor growth in mice treated with control (a), low-avidity (c) or high-avidity (c) cells is shown. The survival of mice treated with control (b), low-avidity (e) or high-avidity (e) cells is shown. The tumor control index for each low-avidity-treated or high-avidity-treated mouse (d) is shown. Each line and dot in ae represent data from individual mice. f, Twenty mice were treated with anti-PD-1 or anti-CTLA-4 antibodies twice weekly, or isotype control antibody, starting 6 days after the tumor challenge, for 28 days. The number of low-avidity and high-avidity antigen-specific CD8+ TILs that were stem-like, as determined in Fig. 3f, are shown. Each symbol (blue square or red triangle) represents data from 6–7 mice. P values for the log-rank survival analysis (b,e) and one-way ANOVA (d,f) with corrections for multiple comparisons are shown. Source data
Fig. 6
Fig. 6. A human avidity score of CD8+ TILs can predict response to the checkpoint blockade.
a,b, Expression of individual genes comprising the avidity score (Supplementary Table 3) in the training (a) and test (b) datasets. c, Distribution of the avidity score for mouse CD8+ TILs with low and high avidity in the test dataset. The P value for the comparison of avidity scores derived using a Wilcoxon rank-sum test is shown. d,e, The distribution of the avidity score is shown for the mouse test dataset (d) and human CD8+ TILs (e) from eight different cancer types. The avidity score of low-avidity (blue) and high-avidity (red) T cells was concordant with the measured avidity for low-avidity (95% purity) and high-avidity (96% purity) cells. f, The list of individual genes comprising the avidity score was intersected with the transcriptional targets of TCR-related transcription factors (NR4A1, NR4A2, NR4A3, NFATC1, NFATC2, IRF4, MYC, FOSB, HIF1A, NFKB1, NFKB2, ATF2, CREB1, JUN, FOS, RELA) as predicted by the ARCHS4 database. Genes common to both lists are shown in Supplementary Table 4. The distribution of this new avidity signature in human CD8+ TILs is shown. g, DEGs between low-avidity and high-avidity human CD8+ TILs (as determined in f) are shown. h, The proportion of low-avidity and high-avidity human CD8+ TILs for hepatocellular carcinoma, triple-negative breast cancer and melanoma is shown for patients before treatment with PD-1 or CTLA-4 blockade. The proportion of low-avidity and high-avidity human CD8+ TILs was compared between patients with or without a clinical response (responders or nonresponders, respectively). P values for the two-way ANOVA (h) are indicated for each comparison. Each point in h represents biological replicates. Panels ah were created using BioRender.com. Source data
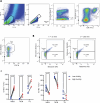
Extended Data Fig. 1
Extended Data Fig. 1. An improved method for the preparative isolation of T cells based on their TCR avidities.
(A) The proportion of CD8 TILs that are PDPRMUT tetramer+ from mice bearing MethA(left) or 4T1 (right) 28 days after tumor challenge. (B) PDPRMUT tetramer positive CD8 T cells isolated from lymph nodes of mice seven days after immunization were co-cultured with splenocytes pulsed with either control (DMSO only), PDPRWT, PDPRMUT for 4 hours. The proportion of IFN-γ+(left) and the MFI of IFN-γ in CD8 T cells detected by flow cytometry is shown. (C) Tetramer decay in the absence of αPE antibody (left) in contrast to (right) lack of such decay (that is stabilization of tetramer-binding) in the presence of αPE antibody with the GTF2bMUT-PE (square) or PDPRMUT-PE (circle) tetramers. (D) The proportion of PDPRMUT specific TILs that are Tetramer-BV421+ and Tetramer-PE+ after 15 and 105 minutes of decay with anti-PE antibody is shown. (E) The proportion of PDPRMUT-specific cells (from lymph nodes of PDPRMUT peptide-immunized mice) that are Tetramer-BV421+ and Tetramer-PE+ through the course of a tetramer decay is shown. (F) The frequency of low (blue) or high (red) avidity cells in PDPRMUT-specific cells from lymph nodes of PDPRMUT-immunized mice or from Meth A TILs is shown. (G) PDPRMUT-specific TILs from 28-day old Meth A tumors were analyzed for tetramer decay in presence of buffer alone, or in presence of anti-H-2Dd blocking antibody, or in the presence of anti-H-2Dd blocking antibody as well as anti-PE antibody. Tetramer staining at the indicated times is shown. P-values for one-way ANOVA with multiple comparison’s correction (B) and two-tailed paired t-test (D,F) are indicated. Each point in (B) represents technical replicates of samples pooled from many individual mice and each point in (D,F) represents biological replicates. Source data
Extended Data Fig. 2
Extended Data Fig. 2. Low Avidity T cells control tumor growth in multiple mouse models of cancer.
(A, B) The tumor control index (A) as well as a summary plot annotated with P values from Tukey’s multiple comparison test (B), corresponding to the tumor growth curves in Fig. 1g is shown. (C) One thousand control (tetramer-negative), one thousand high avidity, or four-thousand high avidity CD8+ cells from lymph nodes of PDPRMUT peptide-immunized mice were adoptively transferred (i.v.) into mice bearing 10-day old Meth A tumors. The kinetics of tumor growth in individual mice is shown. (D) The tumor control index corresponding to the tumor growth curves shown in Fig. 1i is shown. (E) C57BL/6 mice were immunized with the mutated neoepitope (STFLYFSFF) of MC38-FABF colon carcinoma, and low and high avidity CD8 T cells were sorted as described in Fig. 1a. Ten day old MC38-FABF-bearing mice were adoptively transferred with 1,000 low avidity (blue), or high avidity (red) or tetramer negative control (black) CD8 T cells. The kinetics of tumor growth is shown. The survival of recipient mice is show in F. P values for Tukey’s multiple comparison test (E) or Mantel-Cox test (F) is indicated where statistically significant. (G) A consolidated survival analysis of mice treated with low avidity (n = 48 mice) or high avidity (n = 30 mice) CD8 T cells specific to any of the three neoepitopes or negative control CD8 T cells (n = 35 mice), is shown. P values were determined by Mantel-Cox test. Each point in (A,D) represents biological replicates. Error bars indicate standard error of the mean. Source data
Extended Data Fig. 3
Extended Data Fig. 3. Low Avidity T cells are less exhausted than high avidity T cells in every setting tested.
(A, B) Representative plot for gating strategy for data in Fig. 2a is shown. (A) Live single cells from TIL of 28 Day Meth A bearing mice are gated for CD8 and TCR-β expression (left), followed by PD-1 expression (right). (B) PD-1+CD8+TCR-β + cells from samples after 15 (left) and 105 (right) minutes of decay are gated on PDPRMUT Tetramer in PE and BV421. (C) The proportion of TIM3+TCF1 (left) and TIM3TCF1+ (right) of low (blue) and high (red) avidity PDPRMUT specific CD8 T cells from vaccine draining lymph nodes, tumor draining lymph nodes, and 21 day-old TIL. Each point represents biological replicates. P-values for two-tailed paired t-tests are indicated. Source data
Extended Data Fig. 4
Extended Data Fig. 4. Low avidity T cells specific to four additional neoantigens from two different tumor models are less exhausted than high avidity T cells.
(A) The proportion of TIM3 positive cells, the MFI of TIM3, the proportion TOX positive cells, the MFI of TIM3 in the TOX+ cells, and the proportion of cells expressing TIM3 in the TOX+ cells in low and high avidity GTF2bMUT specific CD8+ TIL are shown in individual panels as indicated. (B-D) Proportion of exhausted (PD1 + TIM3 + ) TRIB3MUT, PRPF19-1MUT and STFLYFSFF-specific CD8 T cells of low and high avidity (left figure of each panel) and the MFI of TIM3 (right figure of each panel) are shown. (E) The proportion of low and high avidity STFLYFSFF-specific CD8 T cells isolated from 21 day old MC38-FABF tumors that express stem-like (TCF1 + LY108 + ) (left) or exhausted (PD1 + TIM3+) (right) markers. Each point in (B-D) represents technical replicates of samples pooled from many individual mice and each point in (A,E) represents biological replicates. P-values for two-tailed paired t-tests (A,E) and two-tailed unpaired t-tests (B-D) are indicated. Source data
Extended Data Fig. 5
Extended Data Fig. 5. Methodology for identifying pure populations of CD8 TILs.
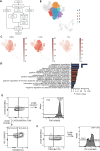
(A) A flow chart indicating the pre-processing of sequencing data for experiments described in Fig. 2 are shown. Briefly, FastQ files obtained from single cell sequencing of low, medium, and high avidity CD8+ TIL are processed by cellranger multi to give three outputs: gene expression, TCR sequences, and CITE-Seq. Quality control methods are used to filter low quality cells and irrelevant genes from the gene expression portion. (B) A UMAP of the filtered cells labeled with clusters from unbiased clustering based on gene expression is shown. Clusters 0,1,3,4, and 8 are highlighted and chosen for subsequent analyses due to their significantly higher expression of T cell related genes. (C) UMAPs depicting gene expression of Cd8b1 (left), Cd3e (middle), and Trac (right) for all cells after filtration is shown. RNA velocity (obtained by the ratio of spliced and un-spliced gene expression reads), TCR sequences, and CITE-Seq are then incorporated into the isolated clusters from B for further analyses. (D) The nine most enriched Gene Ontology Terms for differentially expressed genes in low (blue) and high (red) avidity Ag* CD8 + TIL obtained as in Fig. 2g are shown. (E, F) Representative flow plots demonstrating the gating strategy for Stem-Like (F), Eff-Exh (E), Term-Exh-1(E), and Term-Exh-2 (E) cells for the analysis in Fig. 2j.
Extended Data Fig. 6
Extended Data Fig. 6. TCR avidity shapes the phenotype and differentiation of CD8 TILs.
(A) A dot plot depicting the normalized mean expression (color intensity) and proportion (circle size) of cells expressing indicated genes in KM_1 and KM_2. (B, C) Velocity stream plots depicting the inferred differentiation, based on each cell’s RNA velocity and transcriptome, of KM_1 (B), and KM_2 (C) are shown.
Extended Data Fig. 7
Extended Data Fig. 7. High avidity human CD8 TIL express higher levels of CD8A and TRAC than low avidity human CD8 TIL.
A violin plot illustrating the distribution of CD8A (A) and TRAC (B) expression in low and high avidity human TIL from the PanCancer TIL atlas, as determined by the Avidity Score, is shown. P-values from differential gene expression analysis via the DESeq2 algorithm are indicated above the violin plots for each comparison.

References

    1. Corse, E., Gottschalk, R. A. & Allison, J. P. Strength of TCR–peptide/MHC interactions and in vivo T cell responses. J. Immunol.186, 5039–5045 (2011). - PubMed
    1. Morgan, D. J. et al. Activation of low avidity CTL specific for a self epitope results in tumor rejection but not autoimmunity. J. Immunol.160, 643–651 (1998). - PubMed
    1. Hay, Z. L. Z., Knapp, J. R., Magallon, R. E., O’Connor, B. P. & Slansky, J. E. Low TCR binding strength results in increased progenitor-like CD8+ tumor-infiltrating lymphocytes. Cancer Immunol. Res.11, 570–582 (2023). - PMC - PubMed
    1. Morgan, R. A. et al. Cancer regression and neurological toxicity following anti-MAGE-A3 TCR gene therapy. J. Immunother.36, 133–151 (2013). - PMC - PubMed
    1. Miller, A. M., Bahmanof, M., Zehn, D., Cohen, E. E. W. & Schoenberger, S. P. Leveraging TCR affinity in adoptive immunotherapy against shared tumor/self-antigens. Cancer Immunol. Res.7, 40–49 (2019). - PMC - PubMed

MeSH terms

Substances