. 2025 Feb;26(4):1003-1035.
doi: 10.1038/s44319-024-00361-w. Epub 2025 Jan 9.

OTUD6B regulates KIFC1-dependent centrosome clustering and breast cancer cell survival

Affiliations

OTUD6B regulates KIFC1-dependent centrosome clustering and breast cancer cell survival

Valeria E Marotta et al. EMBO Rep. 2025 Feb.

Abstract

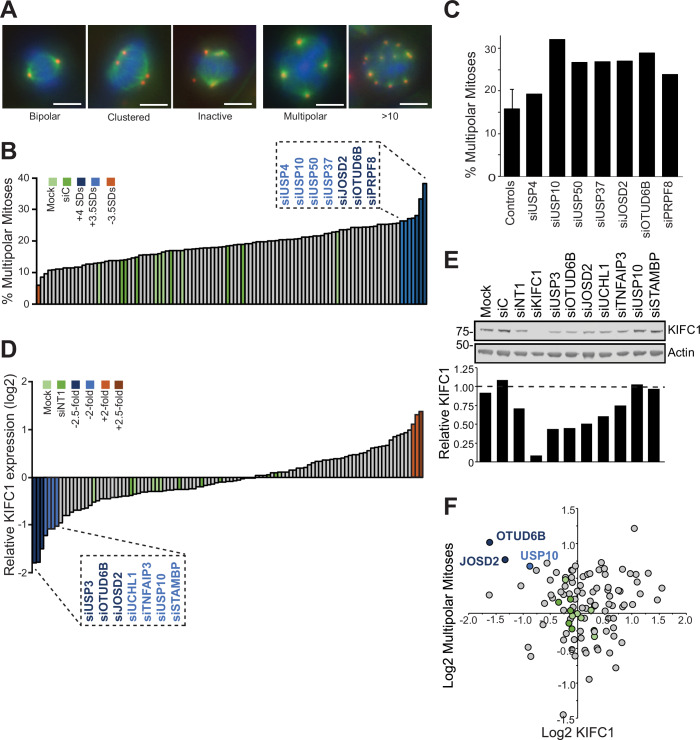
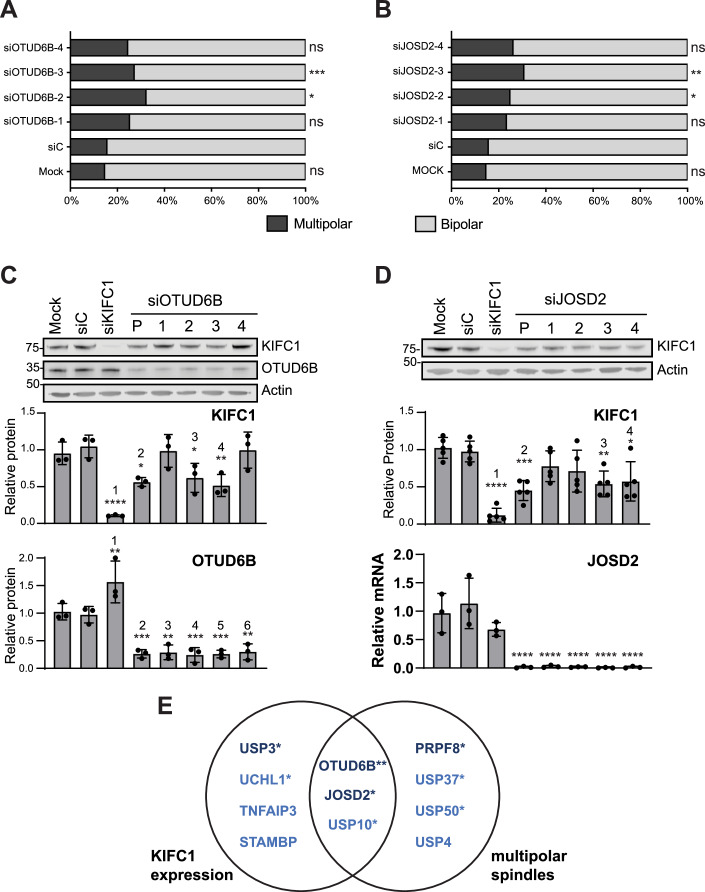
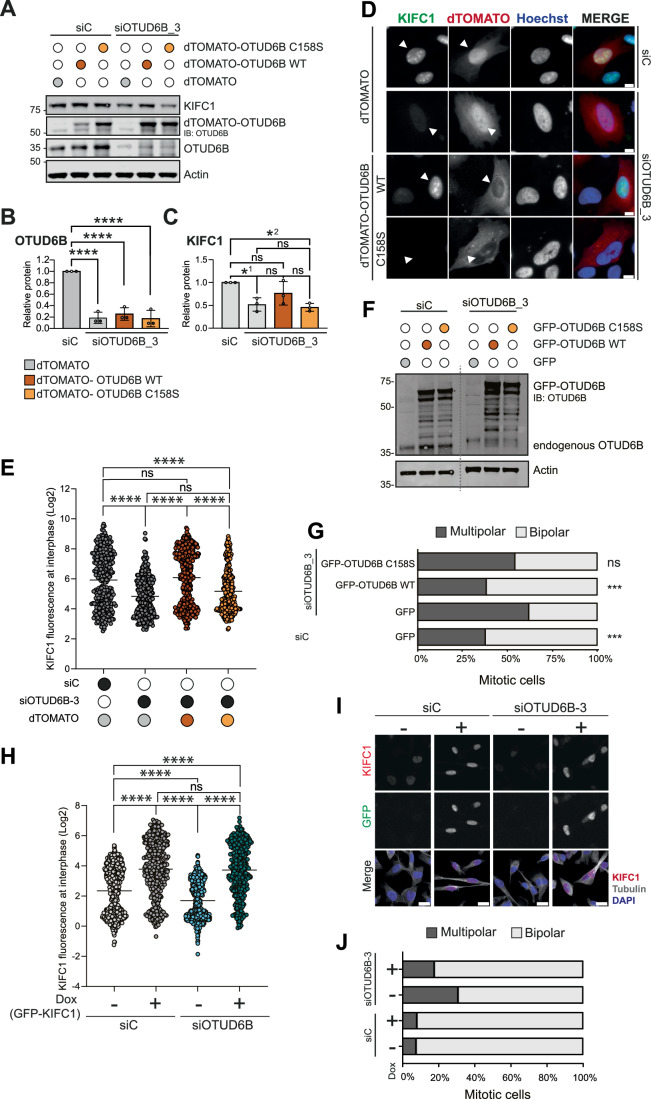
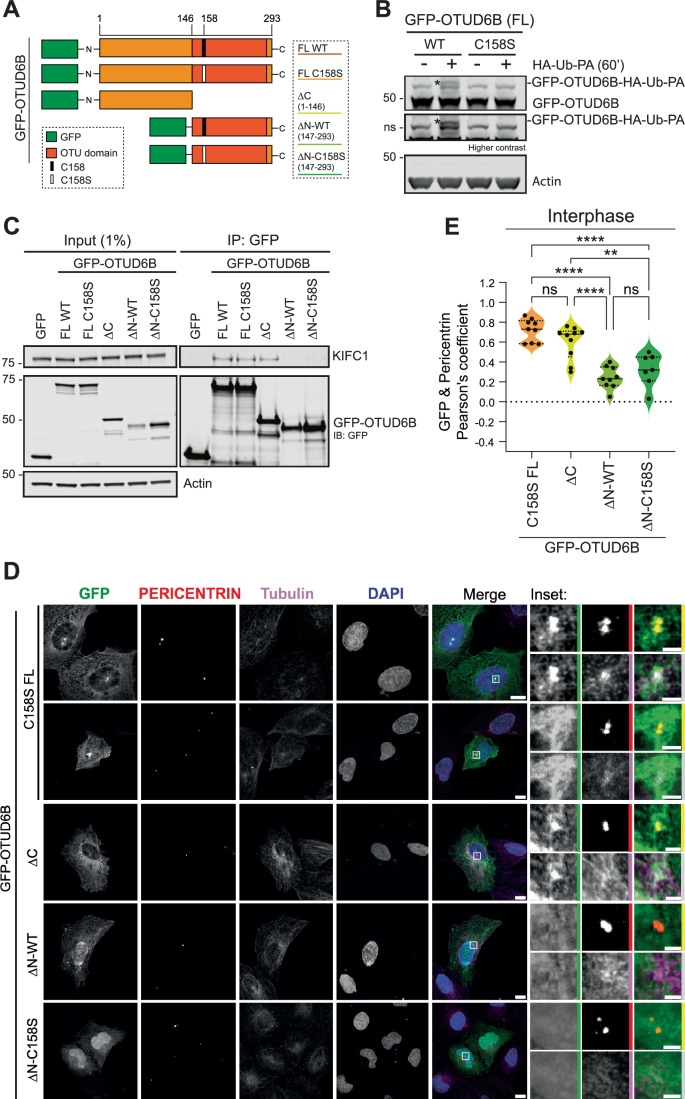
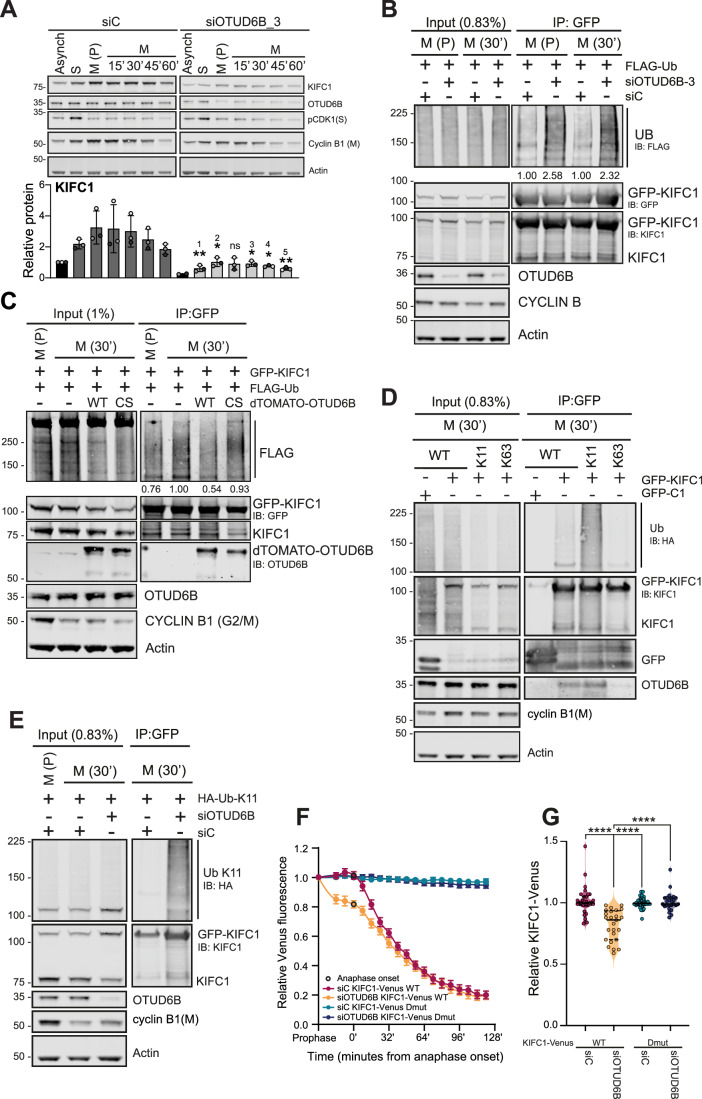
Cancer cells often display centrosome amplification, requiring the kinesin KIFC1/HSET for centrosome clustering to prevent multipolar spindles and cell death. In parallel siRNA screens of deubiquitinase enzymes, we identify OTUD6B as a positive regulator of KIFC1 expression that is required for centrosome clustering in triple-negative breast cancer (TNBC) cells. OTUD6B can localise to centrosomes and the mitotic spindle and interacts with KIFC1. In OTUD6B-deficient cells, we see increased KIFC1 polyubiquitination and premature KIFC1 degradation during mitosis. Depletion of OTUD6B increases multipolar spindles without inducing centrosome amplification. Phenotypic rescue is dependent on OTUD6B catalytic activity and evident upon KIFC1 overexpression. OTUD6B is commonly overexpressed in breast cancer, correlating with KIFC1 protein expression and worse patient survival. TNBC cells with centrosome amplification, but not normal breast epithelial cells, depend on OTUD6B to proliferate. Indeed CRISPR-Cas9 editing results in only OTUD6B-/+ TNBC cells which fail to divide and die. As a deubiquitinase that supports KIFC1 expression, allowing pseudo-bipolar cell division and survival of cancer cells with centrosome amplification, OTUD6B has potential as a novel target for cancer-specific therapies.

Keywords: Centrosome; DUB; Kinesin; Multipolar Spindle; OTU Deubiquitinase 6B.


Conflict of interest statement

Disclosure and competing interests statement. Andrew Fielding and Amanda Thomaz declare competing commercial interests due to intellectual property held in field related to this study. The remaining authors declare no competing interests.

Figures

Figure 1
Figure 1. DUB siRNA library screens identify potential regulators of centrosome-clustering and KIFC1 expression.
BT549 cells were transfected with 40 nM pooled siRNA from a DUB-specific library. (AC) Centrosome de-clustering screen. Cells were stained for pericentrin (red), alpha tubulin (green) and DNA (blue) and 36 stitched fields of view imaged. Mitotic cells were classed into phenotypes, scale bar 10 µm (A). Median of 74 mitoses scored per condition from n = 1 experiment, those with <30 mitotic cells excluded (USP9X, USP6 and PSMD7). Ranked percentage of multipolar mitoses for each DUB siRNA pool or control (green), standard deviation (SD) relative to control mean indicated by colour scale (B). Re-evaluation of siRNA pools for 7 candidate DUBs which increased multipolar spindle frequency by >3.5 SD in the screen, n = 1 experiment, error bar for controls shows SD of mean for 5 mock and 5 siC technical replicates (C). (D, E) Immunoblotting screen for KIFC1, n = 1 experiment. Data ranked by KIFC1 expression normalised to actin and relative to gel average (D). Re-evaluation of siRNA pools for 7 candidate DUBs that reduced KIFC1 expression by >twofold in the screen, n = 1 experiment (E). (F) Cross-correlation of the two screens; DUBs in top left quadrant may promote KIFC1-dependent centrosome clustering. Source data are available online for this figure.
Figure 2
Figure 2. Depletion of OTUD6B or JOSD2 causes multipolar mitoses and reduces KIFC1 expression.
Deconvolution of OTUD6B or JOSD2 siRNA pools by transfection with four individual siRNAs (40 nM). (A, B) Centrosome de-clustering was scored for >90 metaphase cells per condition across n = 3 biological replicates for OTUD6B (A) or JOSD2 (B) depletion; (A) ***P = 0.0003, *P = 0.030, (B) *P = 0.026, **P = 0.003 compared to siC control by one-tailed Chi-square test. (C, D) Deconvolution of OTUD6B (C) or JOSD2 (D) siRNA pools (P) for KIFC1 expression and DUB knockdown efficiency. Representative immunoblots, plots show mean expression from n = 3 (C), n = 5 (D, KIFC1) and n = 3 (D, JOSD2) biological replicates normalised to actin and mean of controls (JOSD2 evaluated by qRT-PCR); error bars SD, values compared to siC by one-way ANOVA with Dunnett post-hoc test. KIFC1: 1****P ≤ 0.0001, 2*P = 0.0143, 3*P = 0.0323, 4**P = 0.007; OTUD6B: 1**P = 0.005, 2***P = 0.001, 3**P = 0.0014, 4***P = 0.0008, 5***P = 0.0009, 6**P = 0.0016 (C) KIFC1: 1****P ≤ 0.0001, 2***P = 0.0008, 3**P = 0.0057, 4*P = 0.0119; JOSD2: ****P ≤ 0.0001 (D). (E) Venn diagram summarizing top seven hits from each screen, *reproducible effect for siRNA pool, **both readouts altered by the same two siRNAs. Source data are available online for this figure.
Figure 3
Figure 3. OTUD6B catalytic activity is required to rescue KIFC1 levels and prevent multipolar spindle formation.
(AE) Overexpression of dTOMATO-OTUD6B but not catalytic dead dTOMATO-OTUD6B-C158S rescues KIFC1 levels in OTUD6B-depleted cells. U2OS cells were transfected with plasmids (48 h) and siRNAs (10 nM, 72 h) then immunoblotted (A). Plots show mean expression normalised to actin from n = 3 biological replicates for endogenous OTUD6B (B) and KIFC1 (C), error bars SD. ****P ≤ 0.0001 (B), 1*P = 0.0214, 2*P = 0.0112, ns, not significant (C), compared to siC by one-way ANOVA with Tukey’s multiple comparison test. In parallel, samples were co-stained for KIFC1 and DNA (Hoechst), representative images acquired with Nikon Eclipse Ti fluorescent microscope with, scale bar 10 µm. White arrows indicate examples of transfected cells, which were used for quantification (D). Mean pixel intensity scored for KIFC1 after background subtraction was measured for >250 cells per condition from n = 3 biological replicates; ns, not significant; ****P ≤ 0.0001 by Kruskal–Wallis with Dunn’s multiple comparison test (E). (F, G) GFP-OTUD6B but not catalytic-dead GFP-OTUD6B-C158S, rescues centrosome clustering. BT549 cells were transfected with 10 nM siRNAs for 72 h and plasmids for the final 24 h. Immunoblot shows expression of siOTUD6B_3 resistant GFP-OTUD6B, dotted line indicates break in membrane, n = 1 experiment (F). Cells were stained for tubulin and DAPI (DNA) and visualised using a Nikon Eclipse Ti fluorescent microscope. The percentage of bipolar and multipolar spindles were scored in 100 GFP-positive mitotic cells per condition from n = 1 experiment, ***P = 0.0005 by one-tailed Chi-square test (G). (HJ) KIFC1 overexpression can rescue the siOTUD6B_3 induced multipolar spindle phenotype. MDA-MB-231 cells, either non-induced (−Dox) or induced ( + Dox) to express GFP-KIFC1siRes, were transfected with 10 nM siRNAs and images captured using a Zeiss LSM880 confocal microscope. Cells were stained for KIFC1, α-tubulin, and DNA (DAPI) 72 h post-transfection, and KIFC1 fluorescence intensity quantified for >330 cells per condition from n = 1 experiment; ****P ≤ 0.0001 by Kruskal–Wallis with Dunn’s multiple comparison test (H) representative images, scale bar 10 µm (I). Cells were stained for pericentrin, α-tubulin, and DNA (DAPI) 48 h post-transfection, and the percentage of multipolar spindles calculated from all visible mitoses across multiple fields of view; n > 40 cells per condition from n = 1 experiment (J). Source data are available online for this figure.
Figure 4
Figure 4. OTUD6B localises to centrosomes and interacts with KIFC1.
(A, B) OUTD6B co-localises with pericentrin in interphase cells and prometaphase cells (A) and with tubulin (A) and KIFC1 at prometaphase (B). U2OS cells transfected with GFP or GFP-OTUD6B for 48 h before staining, representative maximum-intensity projections imaged with Zeiss LSM800 confocal from n = 2 biological replicates; scale bar 10 µm, or 2 µm on inset. (CE) Pearson co-localisation coefficients calculated with JACoP for GFP and GFP-OTUD6B with pericentrin at interphase (C) or prometaphase (D) and KIFC1 at prometaphase (E). Each data point represents a centrosome for pericentrin staining (n ≥ 10), or a cell for KIFC1 staining (n ≥ 7); ****P ≤ 0.0001 (C), ***P = 0.0007 (D), **P = 0.0154 (E) by unpaired t test. (F, G) KIFC1 and OTUD6B can interact in cells. U2OS cells were transfected with GFP-KIFC1 (F), or GFP-OTUD6B (G) for 24 h and pulled-down with GFP-nanobeads to co-immunoprecipitate endogenous proteins; immunoblots representative of n = 3 biological replicates. Source data are available online for this figure.
Figure 5
Figure 5. The N-terminus of OTUD6B is required for centrosome localisation and interaction with KIFC1.
(A) Schematic of GFP-OTUD6B mutants. (B) OTUD6B demonstrates catalytic activity in cells, which is abrogated by mutation of cysteine 158. U2OS cells were transfected with plasmids for 48 h, lysed and incubated with Ub-PA for 60 min then immunoblotted for OTUD6B, n = 1 experiment, *denotes Ub-PA conjugation causing GFP-OTUD6B gel shift. (C) KIFC1 interacts with the N-terminus of OTUD6B. U2OS were transfected with plasmids for 24 h and GFP-OTUD6B pulled-down with GFP-nanobeads to co-immunoprecipitate endogenous KIFC1; Immunoblot representative of n = 2 biological replicates. (D, E) Localisation of GFP-OTUD6B mutants in U2OS cells co-stained for centrosome (pericentrin), spindle (tubulin), and DNA (DAPI) markers. Representative images from n = 1 experiment presented as maximum-intensity projections imaged with Zeiss LSM800 confocal; scale bar 10 µm, or 2 µm on inset. FL, full length (D). Pearson co-localisation coefficients calculated with JACoP for GFP-OTUD6B with pericentrin at interphase for >7 cells from n = 1 experiment; **P = 0.0018, ****P ≤ 0.0001, ns not significant by one-way ANOVA with Tukey’s multiple comparison test (E). Source data are available online for this figure.
Figure 6
Figure 6. Regulation of mitotic KIFC1 deubiquitination requires OTUD6B catalytic activity.
(A) KIFC1 levels are regulated through the cell cycle. U2OS cells were transfected with 10 nM siRNAs for 48 h then synchronised using thymidine/STLC/ZM447439. Representative immunoblots and KIFC1 normalised to asynchronous cells, mean of n = 3 biological replicates (or n = 2 biological replicates for siOTUD6B_3 asynchronous cells), error bars SD; ns not significant, 1**P = 0.0018, 2*P = 0.0247, 3*P = 0.0240, 4*P = 0.0116, 5**P = 0.0034 by unpaired t test relative to the corresponding siC sample. S S-phase, M mitosis, P prometaphase; min (‘) after release from prometaphase are indicated. (BE) U2OS cells were transfected with plasmids (48 h) and siRNAs (10 nM, 72 h), synchronised at mitotic entry (prometaphase) or collected 30 min into mitotic exit (M30’) then immunoprecipitated with GFP-nanobeads; n = 1 experiment; M45’ data also shown in Appendix Fig. S7E. Numbers beneath immunoprecipitation blots indicate FLAG-ubiquitin signal normalised to GFP-KIFC1 pulldown detected by GFP antibody. OTUD6B depletion increases KIFC1 ubiquitylation at mitotic entry and mitotic exit (B). Overexpression of dTOMATO-OTUD6B but not catalytic dead dTOMATO-OTUD6B-C158S decreases KIFC1 ubiquitylation during mitosis (C). KIFC1 can be polyubiquitinated with wild-type or K11-only chains and interacts with endogenous OTUD6B during mitosis (D). OTUD6B depletion increases K11 ubiquitylation of KIFC1 during mitosis (E). (F, G) KIFC1 degradation is affected by OTUD6B depletion. KIFC1-Venus levels quantified in individual mitotic cells after release from double-thymidine block; >24 individual mitotic cells were scored per condition from n = 2 biological replicates. In vivo degradation curves plotted as a function of prophase, mean indicated, error bars SEM (F). Scatterplot representing KIFC1-Venus levels in individual cells at anaphase onset relative to prophase; ****P ≤ 0.0001; relative to siC by Kruskal–Wallis test with Dunn’s multiple comparison test (G). Source data are available online for this figure.
Figure 7
Figure 7. OTUD6B is required for breast cancer cell survival.
(A, B) Growth of breast cancer cells with centrosome amplification is reduced by KIFC1 or OTUD6B depletion. Cell viability and growth were monitored from 72 h to 120 h post-transfection with siRNAs using an ATP-dependent assay for BT549 (40 nM siRNA) (A) or live cell imaging of MDA-MB-231 (10 nM siRNA) (B) in n = 3 biological replicates; mean indicated, error bars SD; ns, not significant, *P = 0.0135, ****P ≤ 0.0001 (A), 1**P = 0.002, 2*P = 0.0241, 3*P = 0.0241 (B), compared to siC by one-way ANOVA with Dunnett’s post-hoc test. (CH) Clonogenic assays in cells transfected with siRNAs. Example image of colonies for hTERT-HME1 or BT549 (40 nM siRNA) (C, E) and MDA-MB231 (10 nM siRNA) (G) quantified using an automated colony counter (D, F, H) from n = 3 biological replicates, error bars SD; ns, not significant, 1***P = 0.0002, 2**P = 0.0065, 3**P = 0.0029 (F), ****P ≤ 0.0001, **P = 0.0012 (H), compared to siC by one-way ANOVA with Dunnett’s post-hoc test. (I, J) Genetic editing of OTUD6B impairs the growth of TNBC cells. Genomic DNA was extracted from parental or three OTUD6B CRISPR-edited BT549 clones (A5, C6, E7) from two gene editing experiments. Endpoint PCR for full length OTUD6B (1972 bp) or CRISPR editing with the sgRNA guide pair ( ~ 190 bp), indicates heterozygous knockout clones (I). Parental BT549 and three CRISPR-edited OTUD6B+/− clones (A5, C6, E7) 4 weeks post-sgRNA transfection imaged over 36 h to monitor cell division and growth, scale bar 200 µm (J). Source data are available online for this figure.
Figure EV1
Figure EV1. Relationship between OTUD6B, centrosome amplification, KIFC1 expression and patient survival.
(A) Centrosome amplification in breast cancer and control cell lines. Cells were stained for α-tubulin (green), pericentrin (red), and DNA (DAPI, blue) and visualised using a Nikon Eclipse Ti fluorescent microscope. Centrosome number was scored in >100 mitotic cells per line. Scale bar 10 μm. (BD) Correlation of KIFC1 and OTUD6B protein expression in a breast cell line panel. Representative immunoblot and quantitation normalised to actin shown relative to U2OS cell line, n = 1 experiment (B). Scatter plots comparing KIFC1 (C) or OTUD6B (D) with percentage centrosome amplification by two-tailed Pearson coefficient. MCF7 excluded from correlation as centrosome amplification low compared to other studies. (E) OTUD6B mRNA overexpression is an indicator of poor prognosis in breast cancer patients. Kaplan–Meier estimate of overall survival for all breast cancer patients stratified by high OTUD6B mRNA expression relative to diploid samples in the TCGA breast invasive carcinoma PanCancer Atlas; n = 1084 samples, P = 0.00046, long rank test. (F, G) KIFC1 and OTUD6B mRNA expression are most highly elevated in basal-like breast cancer in the TCGA PanCancer dataset. Patient data were stratified according to subtype; n = 981, ****P ≤ 0.0001 Kruskal–Wallis test with Dunn’s multiple comparisons test. (H) Positive correlation of KIFC1 and OTUD6B protein expression in breast cancer patient samples classified as basal-like. Scatter plot comparing expression by mass spectrometry from the CPTAC breast invasive carcinoma dataset; n = 23, *P = 0.0452 Pearson correlation.
Figure EV2
Figure EV2. OTUD6B knockdown reduces KIFC1 expression in various cell lines and increases multipolar spindles in breast cancer cell lines.
(AG) Cells were transfected with 10 nM OTUD6B or control siRNAs and analysed 72 h post-transfection; protein levels normalised to actin and mean of the controls, one experiment shown. BT549 (AD) showing correlation between OTUD6B and KIFC1 across samples (B). An siRNA specifically targeting the major OTUD6B isoform_1 (iso1) but not an untranscribed sequence 5’ of the OTUD6B gene (siO6B_untCON) reduces KIFC1 (C). OTUD6B depletion also reduces KIFC1 levels in MDA-MB-231 (E), U2OS (F) and hTERT-HME1 (G). (HJ) Three OTUD6B siRNAs induce multipolar spindles in TNBC cell lines with centrosome amplification. Cells were co-stained for centrosomes (pericentrin), spindle (tubulin) and DNA (DAPI); scale bar 10 µm (H). >100 metaphase cells were scored in each condition in MDA-MB-231 from n = 1 experiment, ****P ≤ 0.0001, **P = 0.0027 and *P = 0.0119 (I), or BT549 cells across n = 3 biological replicates, ****P ≤ 0.0001 (J) by One-sided Fisher’s exact test compared to siC.
Figure EV3
Figure EV3. OTUD6B depletion mimics the centrosome de-clustering phenotype of KIFC1 depletion without altering centrosome number.
(A, B) OTUD6B depletion does not induce centrosome amplification. The hTERT-HME1 breast epithelial cell line (A) or the MDA-MB-231 TNBC cell line (B) were transfected with 10 nM siRNA for 72 h, stained with tubulin and pericentrin and imaged with Nikon Eclipse Ti fluorescent microscope. >100 cells per condition were scored from n = 3 biological replicates (A) or 1 biological replicate (B); ns, not significant by One-sided Fisher’s exact test compared to siC. (C) OTUD6B depletion mimics centrosome de-clustering. BT549 cells were transfected with 40 nM siRNA for 72 h then co-stained for pericentrin, centrin and DNA (DAPI), n = 1 experiment. Z-stacks of individual mitotic cells were acquired with a Nikon Eclipse Ti fluorescent microscope, ( >15 mitotic cells per condition) and images presented as maximum-intensity projections. Insets show representative centrin foci; the percentage of multipolar spindles where all pericentrin foci contain at least two centrin foci is indicated. Scale bars, 10 µm. (D, E) OTUD6B depletion does not change centriole or centrosome number in interphase cells and does not induce centriole splitting. Experiment as described in (C) with >43 interphase cells imaged and scored for centriole and centrosome number (n indicated on graph), scale bar 5 µm.
Figure EV4
Figure EV4. The N-terminus is required for OTUD6B nuclear exclusion.
(A, B) U2OS cells were transfected with plasmids for 48 h then stained for KIFC1, pericentrin and DNA (Hoechst). Images were acquired with a Nikon Eclipse Ti fluorescent microscope. Representative images of cytoplasmic or nuclear distribution observed in cells transfected with each construct; scale bar 10 µm; dotted lines indicate cells scored as nuclear in the field shown (A). >100 interphase cells were scored per condition from one experiment (B).
Figure EV5
Figure EV5. OTUD6B depletion does not affect KIFC1 transcription or global protein stability in asynchronous cells.
(A) OTUD6B depletion does not significantly alter KIFC1 transcription. BT549 cells were transfected with 10 nM siRNA for 72 h. Expression by qRT-PCR normalised to ACTB and GAPDH, shown relative to mean of controls; mean for n = 3 biological replicates, error bars SD, 1**P = 0.0087, 2****P ≤ 0.0001, 3***P = 0.0025 and 4***P = 0.0022, compared to siC by one-way ANOVA with Dunnett post-hoc test. (B, C) U2OS (B) or BT549 (C) cells were transfected with 10 nM siRNA for 72 h and treated with 50 nM epoxomicin or DMSO for the final 6 h. Representative immunoblot (top) and mean values for KIFC1 expression normalised to actin and shown relative to the untreated sample for n = 4 (B) or n = 3 (C) biological replicates (below); error bars SD, *P = 0.0314, compared to DMSO by two-tailed t test. (DF) Comparison of KIFC1 and OTUD6B half-lives in U2OS (D) or BT549 (E) cell lines treated with 10 μg/ml cycloheximide (CHX). Mean expression relative to 0 h for n = 3 biological replicates (F), error bars SD, *P = 0.0416, one-tailed t-test. (G-H) OTUD6B depletion does not reduce KIFC1 stability in asynchronous cells. U2OS cells were transfected with siRNA for 72 h, prior to CHX addition and immunoblotting (G), expression relative to 0 h, one experiment (H). (I, J) OTUD6B depletion does not increase KIFC1 ubiquitylation in asynchronous cells. U2OS cells were transfected with siRNAs for 72 h, and GFP-KIFC1 for 24 h then treated with 50n M epoxomicin for the final 6 h before immunoprecipitation with GFP nanobeads, n = 2 biological replicates. Representative immunoblot (I) and quantification of ubiquitin smear normalised to the total amount of GFP-KIFC1 pulled down (J). (K) KIFC1 but not OTUD6B depletion increases the proportion of cells in S-phase. MDA-MB-231 cells were transfected with 10 nM siRNAs for 72 h, stained with 7-AAD and analysed by flow cytometry; error bars SD of mean for n = 3 biological replicates; *P = 0.0459 compared to siC by one-way ANOVA with Dunnett post-hoc test.

References

    1. Arnandis T, Monteiro P, Adams SD, Bridgeman VL, Rajeeve V, Gadaleta E, Marzec J, Chelala C, Malanchi I, Cutillas PR et al (2018) Oxidative stress in cells with extra centrosomes drives non-cell-autonomous invasion. Dev Cell 47:409–424.e409 - PMC - PubMed
    1. Basto R, Brunk K, Vinadogrova T, Peel N, Franz A, Khodjakov A, Raff JW (2008) Centrosome amplification can initiate tumorigenesis in flies. Cell 133:1032–1042 - PMC - PubMed
    1. Behan FM, Iorio F, Picco G, Goncalves E, Beaver CM, Migliardi G, Santos R, Rao Y, Sassi F, Pinnelli M et al (2019) Prioritization of cancer therapeutic targets using CRISPR-Cas9 screens. Nature 568:511–516 - PubMed
    1. Berger AC, Korkut A, Kanchi RS, Hegde AM, Lenoir W, Liu W, Liu Y, Fan H, Shen H, Ravikumar V et al (2018) A comprehensive pan-cancer molecular study of gynecologic and breast cancers. Cancer Cell 33:690–705.e699 - PMC - PubMed
    1. Berger AC, Korkut A, Kanchi RS, Hegde AM, Lenoir W, Liu W, Liu Y, Fan H, Shen H, Ravikumar V et al (2018) Breast invasive carcinoma TCGA, PanCancer Atlas. Source data from GDC (https://www.cbioportal.org/study?id=brca_tcga_pan_can_atlas_2018) [DATASET]

MeSH terms