. 2025 Jan 9;13(1):7.
doi: 10.1186/s40364-024-00715-5.

Histamine N-methyltransferase (HNMT) as a potential auxiliary biomarker for predicting adaptability to anti-HER2 drug treatment in breast cancer patients

Affiliations

Histamine N-methyltransferase (HNMT) as a potential auxiliary biomarker for predicting adaptability to anti-HER2 drug treatment in breast cancer patients

Tzu-Chun Cheng et al. Biomark Res. .

Erratum in

Abstract

Background: Up to 23% of breast cancer patients recurred within a decade after trastuzumab treatment. Conversely, one trial found that patients with low HER2 expression and metastatic breast cancer had a positive response to trastuzumab-deruxtecan (T-Dxd). This indicates that relying solely on HER2 as a single diagnostic marker to predict the efficacy of anti-HER2 drugs is insufficient. This study highlights the interaction between histamine N-methyltransferase (HNMT) and HER2 as an adjunct predictor for trastuzumab response. Furthermore, modulation of HER2 expression by HNMT may explain why those with low HER2 expression still respond to T-Dxd.

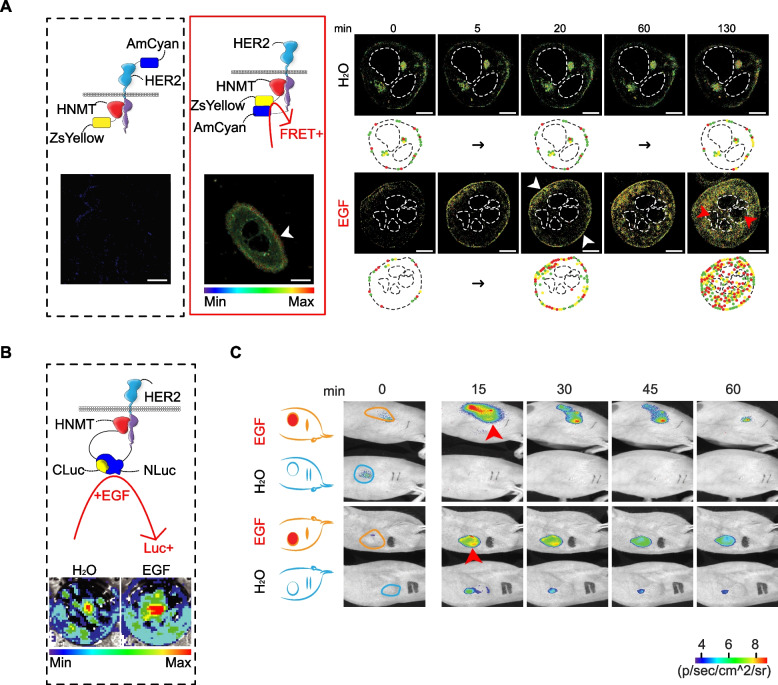
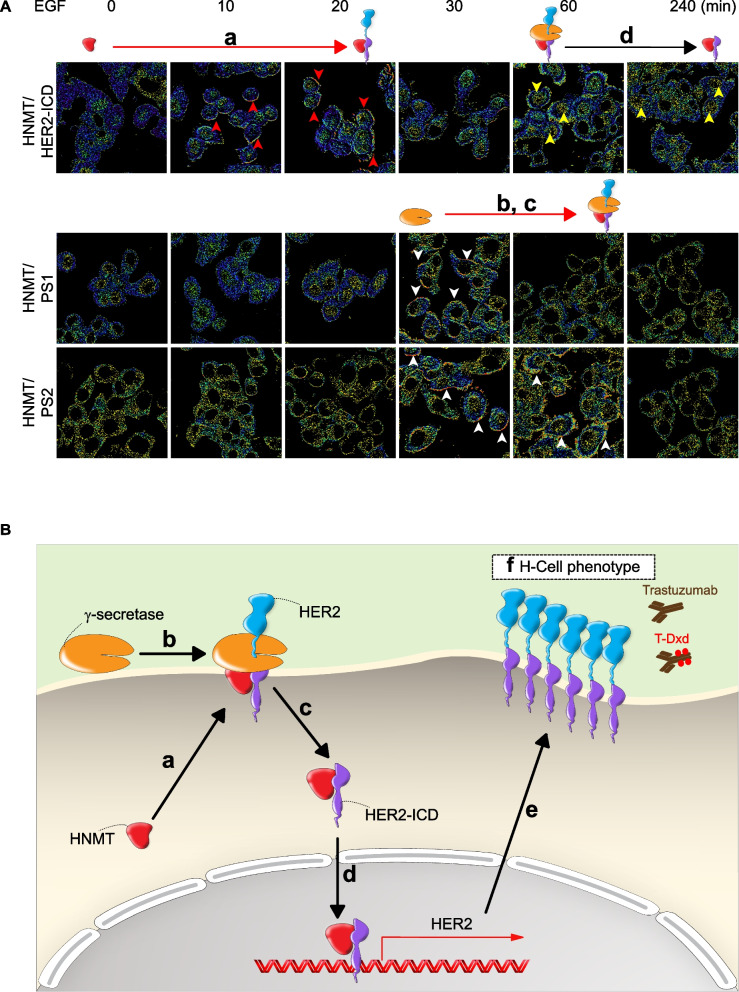
Methods: We investigated the impact of HNMT protein expression on the efficacy of anti-HER2 therapy in both in vivo and ex vivo models of patient-derived xenografts and cell line-derived xenografts. Our analysis included Förster resonance energy transfer (FRET) to assess the interaction strength between HNMT and HER2 proteins in trastuzumab-resistant and sensitive tumor tissues. Additionally, we used fluorescence lifetime imaging microscopy (FLIM), cleaved luciferase, and immunoprecipitation to study the interaction dynamics of HNMT and HER2. Furthermore, we evaluated the influence of HNMT activity on the binding of anti-HER2 antibodies to their targets through flow cytometry. We also observed the nuclear translocation of HNMT/HER2-ICD cells using fluorescent double staining and DeltaVision microscopy. Finally, ChIP sequencing was employed to identify target genes affected by the HNMT/HER2-ICD complex.

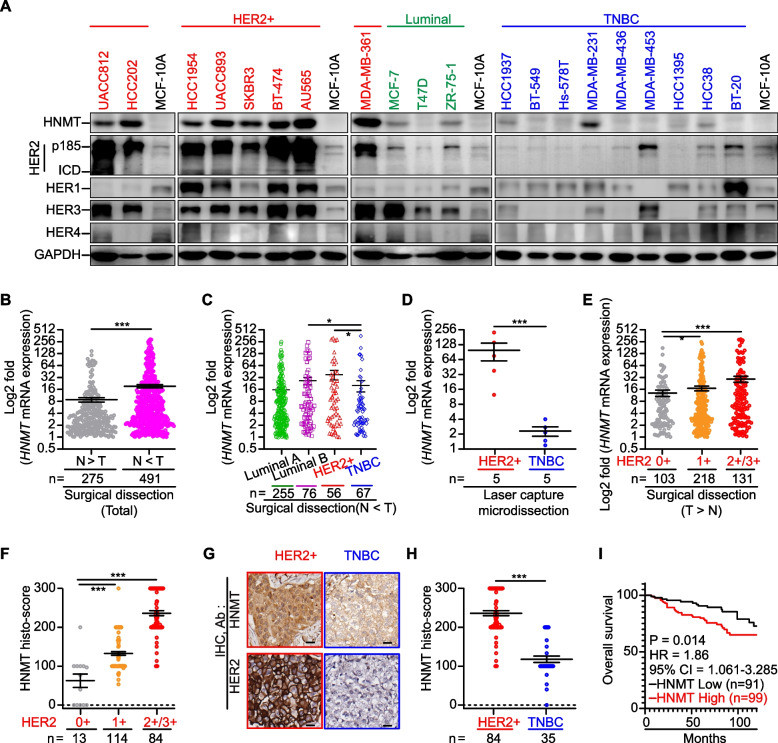
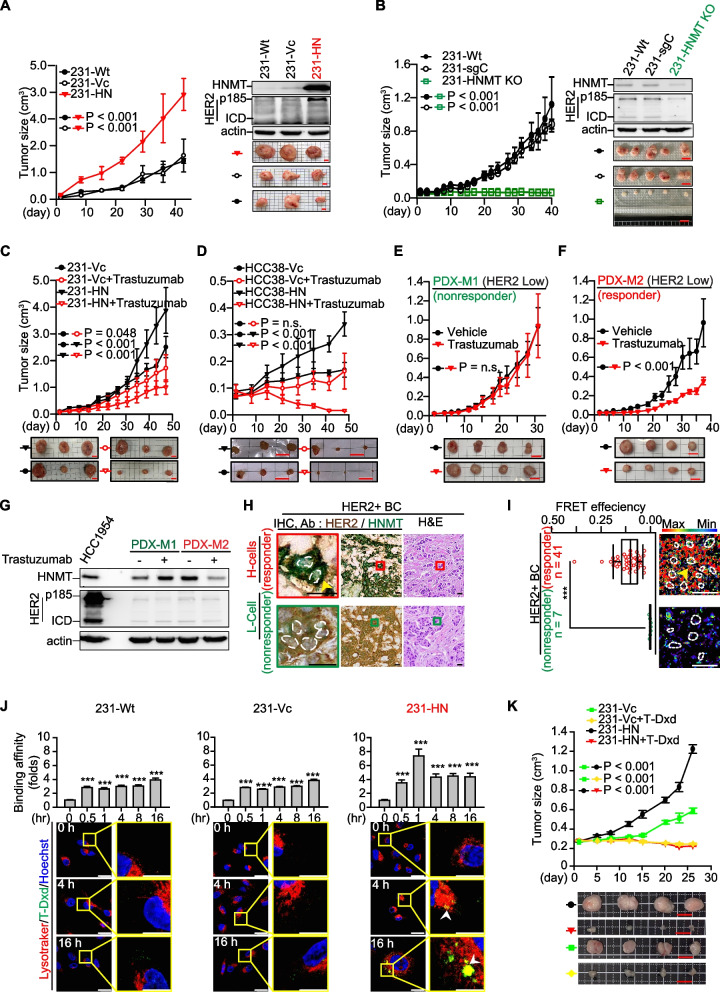
Results: This study highlights HNMT as a potential auxiliary biomarker for diagnosing HER2 + breast cancer. FRET analysis demonstrated a significant interaction between HNMT and HER2 protein in trastuzumab-sensitive tumor tissue (n = 50), suggesting the potential of HNMT as a predictor of treatment response. Mechanistic studies revealed that the interaction between HNMT and HER2 contributes to increased HER2 protein expression at the transcriptional level, thereby impacting the efficacy of anti-HER2 therapy. Furthermore, a subset of triple-negative breast cancers characterized by HNMT overexpression was found to be sensitive to HER2 antibody-drug conjugates such as T-Dxd.

Conclusions: These findings offer crucial insights for clinicians evaluating candidates for anti-HER2 therapy, especially for HER2-low breast cancer patients who could gain from T-Dxd treatment. Identifying HNMT expression could help clinicians pinpoint patients who would benefit from anti-HER2 therapy.

Keywords: Anti-HER2 therapy responder; Breast cancer; H-cell phenotype; Histamine N-methyltransferase; Nuclear translocation.


Conflict of interest statement

Declarations. Ethics approval and consent to participate: The study was conducted following the Declaration of Helsinki and was approved by the Institutional Review Board of Taipei Medical University Hospital (IRB number: CRC-14–10-01 and N201812005). All animal experiments were approved by the Institutional Animal Care and Use Committee (IACUC) of the National Defense Medical Center, Taiwan (LAC-101–0064 and IACUC-20–054). This study was conducted following the Guide for the Care and Use of Laboratory Animals. All participants in this study provided written informed consent. Consent for publication: Not applicable. Competing interests: The authors declare no competing interests.

Figures

Fig. 1
Fig. 1
HNMT expression in human BC patients and cell lines. A Western blot analysis confirmed the presence of HNMT and HER receptors in various cell types. B-E Subsequent quantitative real-time PCR analysis revealed differential HNMT mRNA expression in paired normal and tumor tissues from total BC patients (B) and in tissues from different subtype patients (C). Additionally, laser capture microdissection of cells from HER2 + and TNBC patients revealed distinct levels of HNMT mRNA expression (D). The fold change in HNMT mRNA expression according to HER2 status (E). F Histological scoring of HNMT protein levels by IHC staining in breast tumors from BC patients indicated a correlation with increased HER2 status. G-H Representative IHC images (G) and statistical analysis (H) demonstrate the HNMT protein's differential expression in mammary tumors from HER2 + and TNBC patients. I Kaplan‒Meier analysis revealed a potential association between HNMT protein expression and overall survival in BC patients. The data are presented as the mean ± SE, and statistical analysis was performed using a two-tailed unpaired Student's t-test (for laser capture microdissection data), a two-tailed Mann‒Whitney U test (for mRNA expression and histological scoring data), and a log-rank test (for survival analysis). Significance levels are denoted as *P < 0.05, **P < 0.01, and ***P < 0.001
Fig. 2
Fig. 2
HNMT protein expression in trastuzumab- or T-Dxd-treated tumors. A The tumor growth curve of MDA-MB-231 xenograft tumors with HNMT overexpression; n = 3 per group. B Tumor growth curve after HNMT gene was knocked out in MDA-MB-231 (231-HNMT KO) transplanted tumors; n = 5 in each group. The protein levels of HNMT and HER2 in tumor tissues were detected by western blot. C-F Groups of HNMT-overexpressing TNBC cell xenograft tumors, including MDA-MB-231 (C) and HCC38 (D) tumors, n = 3 per group. Additionally, HER2-low PDX xenograft tumors are denoted as M1 (E) and M2 (F), n = 4 per group. The tumor groups underwent treatment with trastuzumab to evaluate the tumor growth curves. Trastuzumab was administered at 15 mg/kg twice weekly as part of the assessment process. G HNMT and HER2 protein expression in tumor tissues was detected by western blotting. H Representative images of H&E and HNMT/HER2 dual IHC staining of tumor tissue from HER2 + BC patients. I Representative FRET images (right) and quantitative results of FRET efficiency (left) in HER2 + tumor sections. J After treatment with 10 μg/mL T-Dxd, the cells were subjected to flow cytometry analysis at various time points (0, 0.5, 1, 4, 8, 16 h, as shown in the upper panel) and IF staining at different time points (0, 4, 16 h, as shown in the lower panel). The flow cytometry analysis revealed that the duration of treatment influenced the binding affinity of T-Dxd to the cells. T-Dxd binding to the cells was visualized as green fluorescence in the IF staining experiment. At the same time, LysoTracker exhibited red fluorescence, and Hoechst displayed blue fluorescence, enabling the localization of T-Dxd within the cells. These experimental results will contribute to assessing T-Dxd's binding affinity for BC. The experiments were conducted independently three times. K The TNBC cell-derived xenograft tumors were randomly assigned to either the untreated group or the group receiving anti-HER2 therapy (T-Dxd, 4 mg/kg, administered once weekly, n = 4 per group). Tumor growth curves were provided for both groups. The data are the means ± SE. Statistical analysis was performed using a two-tailed unpaired Student's t-test. ***P < 0.001. Scale bars = 0.8 cm (A, C), 1 cm (B, E, F, K), 1.13 cm (D), 10 µm (H), 20 µm (I), and 18.4 µm (J)
Fig. 3
Fig. 3
Time-dependent dynamics of the HNMT and HER2 interaction in BC cells. A Time-lapse FLIM-FRET images (0, 5, 20, 60, 130 min) of HNMT and HER2 complex formation in control and EGF-treated cells. We labeled the blue fluorescent protein (AmCyan) at the N-terminal (AmCyan-HER2) and C-terminal (HER2-AmCyan) of the HER2 protein. In contrast, the C-terminal of the HNMT protein was labeled with a yellow fluorescent protein (ZsYellow). We used different combinations of HER2 protein fragments and HNMT to observe the formation of HNMT/HER2 protein complexes. Black box: AmCyan-HER2 and HNMT-ZsYellow; red box: HER2-AmCyan and HNMT-ZsYellow. Scale bar = 7.5 µm. B The HER2 protein was labeled with N-terminally cleaved luc protein (N-Luc), while the HNMT protein was labeled with C-terminally cleaved luc protein (C-Luc). Luc activity was detected using bioluminescence images (bottom) after 30 min of treatment with 100 ng/mL EGF. C Time-lapse bioluminescence images (0, 15, 30, 45, 60 min) in vivo of mice bearing luc-carrying cancer cells (Fig. 3B) after treatment with EGF. n = 2 per group
Fig. 4
Fig. 4
Cytoplasmic HER2-ICD shedding and nuclear translocation in H-cells. A Endogenous expression of the HNMT and HER2 proteins in two HER2 + BC tumor tissues was detected by western blot analysis (left) and IHC double staining (right). Cytosolic HER2-ICD (stained green, yellow arrows) and membranous HER2-ECD (stained brown) were detected by specific antibodies as indicated. H&E staining of BC tumors is shown. B Schematic illustration of the inhibition of HER2-ICD shedding by γ-secretase inhibitors (DAPT and MW-167). C Western blot confirming the expression of indicator proteins with/without CHX or γ-secretase inhibitor (10 μM, 24 h) in SKBR3 cells overexpressing HNMT. D Representative FRET images of SK-HN and SK-Vc cells treated with/without EGF (100 ng/mL, 60 min) confirm that HER2 (top) or HNMT (bottom) interacts with PS1 or PS2. The yellow (for HER2 and the PS1 or PS2 complex) and white (for HNMT and the PS1 or PS2 complex) arrows indicate a positive FRET signal. E Time-lapse fluorescence images (0, 60, 90, 120 min) of HNMT in SKBR3 cells expressing HNMT-ZsYellow treated with 100 ng/mL EGF. Yellow arrows indicate nuclear translocations. F Fluorescence images consisting of 35 x–y frames were captured every 0.5 μm on the y-axis using a deconvolution microscope. Representative fluorescence images of SKBR3 cells treated with and without 100 ng/mL EGF (120 min). The white arrows indicate nuclear translocation. G Schematic representation of EGF-induced HAP activation of the HER2 promoter. H Cells were treated with 100 ng/mL EGF for 120 min. Schematic representation of the distribution of HBS-1 and HBS-2 in the HER2 gene (top). Snapshot of IGV showing the frequency of detection by ChIP-sequencing analysis of the HBS-1 and HBS-2 loci (middle). Potential sequences of HBS-1 and HBS-2 are shown after the alignment of ChIP-sequencing data (bottom). I ChIP real-time PCR analysis of HER2-Sc and HER2-Si cells with or without EGF treatment. The data are presented as the mean ± SE. Statistical analysis was performed using a two-tailed unpaired Student's t-test. ***P < 0.001. Scale bars = 20 μm (A), 10 µm (D, E), and 10 μm (F)
Fig. 5
Fig. 5
The molecular mechanism by which HNMT enhances BC cell sensitivity to anti-HER2 targeted drugs. The molecular mechanism underlying HER2-induced oncogenesis involves a series of intricate steps. A In this study, EGF (100 ng/mL) was added to SKBR3 cancer cells, and the kinetic process of complex formation was observed. (a) Firstly, in response to EGF activation of HER2 signaling, cytoplasmic HNMT translocates to the cell membrane, and the HNMT/HER2 complex can be observed on the cell membrane within approximately 10–20 min (red arrows). Following this, (b-c) HNMT facilitates the recruitment of γ-secretase, which occurs around 30 min. Subsequently, the γ-secretase (PS1/PS2) complex forms with HER2, taking approximately 30–60 min. During this process, the HER2-ICD enters the cytoplasm (white arrowhead). (d-e) After 60 min of EGF treatment, it is observable that the HNMT/HER2-ICD complex enters the cell nucleus (yellow arrow). It binds to the HER2 promoter, inducing the upregulation of HER2 and HER2-associated oncogenic proteins. The newly synthesized HER2 protein subsequently translocates to the cell membrane, contributing to the manifestation of an H-cell phenotype and enhancing the binding of therapeutic agents such as trastuzumab or T-Dxd in HER2 + cells. B Based on the above results, the molecular mechanism of HNMT involvement in HER2 gene activation can be simplified, as shown in the schematic diagram

References

    1. Sung H, et al. Global cancer statistics 2020: GLOBOCAN estimates of incidence and mortality worldwide for 36 cancers in 185 countries. CA Cancer J Clin. 2021;71(3):209–49. - PubMed
    1. Harbeck N, et al. Breast cancer. Nat Rev Dis Primers. 2019;5(1):66. - PubMed
    1. DeSantis CE, et al. Breast cancer statistics, 2019. CA Cancer J Clin. 2019;69(6):438–51. - PubMed
    1. Slamon DJ, et al. Studies of the HER-2/neu proto-oncogene in human breast and ovarian cancer. Science. 1989;244(4905):707–12. - PubMed
    1. Kumler I, Tuxen MK, Nielsen DL. A systematic review of dual targeting in HER2-positive breast cancer. Cancer Treat Rev. 2014;40(2):259–70. - PubMed

LinkOut - more resources