. 2024 Dec 2;28(1):111510.
doi: 10.1016/j.isci.2024.111510. eCollection 2025 Jan 17.

Mapping the chromothripsis landscape in urothelial carcinoma unravels great intratumoral and intertumoral heterogeneity

Affiliations

Mapping the chromothripsis landscape in urothelial carcinoma unravels great intratumoral and intertumoral heterogeneity

Yuchen Zeng et al. iScience. .

Abstract

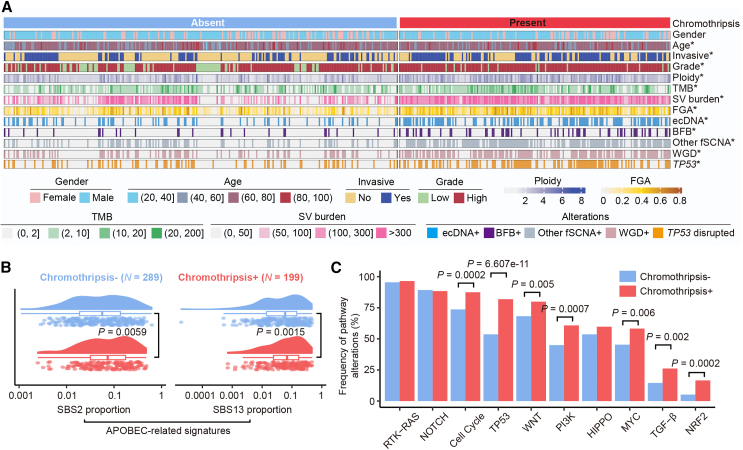
Chromothripsis, a hallmark of cancer, is characterized by extensive and localized DNA rearrangements involving one or a few chromosomes. However, its genome-wide frequency and characteristics in urothelial carcinoma (UC) remain largely unknown. Here, by analyzing single-regional and multi-regional whole-genome sequencing (WGS), we present the chromothripsis blueprint in 488 UC patients. Chromothripsis events exhibit significant intertumoral heterogeneity, being detected in 41% of UC patients, with an increase from 30% in non-muscle-invasive disease (Ta/1) to 53% in muscle-invasive disease (T2-4). The presence of chromothripsis correlates with an unstable cancer genome and poor clinical outcomes. Analysis of multi-regional WGS data from 52 patients revealed pronounced intratumoral heterogeneity with chromothripsis events detectable only in specific tumor regions rather than uniformly across all areas. Chromothripsis events evolve under positive selection and contribute to tumor dissemination. This study presents a comprehensive genome-wide chromothripsis landscape in UC, highlighting the significance of chromothripsis in UC development.

Keywords: Cancer; Cancer systems biology; Genomic analysis; Genomics.


Conflict of interest statement

The authors declare no competing interests.

Figures

None
Graphical abstract
Figure 1
Figure 1
Chromothripsis landscape in UC (A) Overview of the experimental workflow and a brief model illustrating the process of chromothripsis (created with BioRender.com). (B) Classification of chromothripsis events into high-confidence (HC) and low-confidence (LC) categories. (C) Patterns and prevalence of chromothripsis across the entire cohort (488 UC patients). (D) Percentage of canonical and non-canonical chromothripsis events at the chromosome level (N = 402). (E) Percentage of patients with single and multiple (2–7) chromothriptic chromosomes. (F) Presence of chromothripsis by clinical subgroup across 488 UC patients (Fisher’s exact test, two-sided). (G) Kaplan-Meier survival curves illustrating the overall survival of UC patients stratified by chromothripsis status (log rank test). (H) Hazard ratios with ±95% confidence intervals and p values for chromothripsis status, gender, age, and tumor location calculated using a Cox regression on overall survival.
Figure 2
Figure 2
Hallmarks of chromothripsis on UC genome instability, mutation, and transcription (A) Patient classification by chromothripsis status. The asterisk denotes a statistically significant association with the presence of chromothripsis (Wilcoxon rank-sum test for age, ploidy, TMB, SV burden, and FGA; two-sided Fisher’s exact test for other factors). FGA, the fraction of genome altered; TMB, tumor mutation burden; SV, structural variation; fSCNA, focal somatic copy number amplification. BFB, breakage-fusion-bridge; WGD, whole-genome duplication. (B) Proportion of APOBEC-related mutations (COSMIC SBS2 and SBS13) between chromothripsis and chromothripsis+ tumors (Wilcoxon rank-sum test). (C) Percentage of patients with alterations for 10 canonical oncogenic pathways (Fisher’s exact test, two-sided).
Figure 3
Figure 3
Co-occurrence of chromothripsis with ecDNA and focal amplification (A) Chromothripsis event (chromosome 11) detected in CCGA-UBC-75T. (B and C) Structural variant and breakpoint graph (B), along with the structure (C) of the CCND1-containing ecDNA identified in CCGA-UBC-75T. The CCND1-containing ecDNA is localized within chromothripsis regions. (D) CCND1 amplification validated through interphase fluorescent in situ hybridization (FISH). Scale bars, 10 μm.
Figure 4
Figure 4
Intratumoral chromothripsis heterogeneity in UC (A) Oncoprint tables of samples from the multi-regional WGS cohort (N = 193 tumors from 52 patients are shown). Each column represents one tumor. Genetic alterations, including chromothripsis, WGD, ecDNA, BFB, other fSCNA, and TP53 disrupted, as well as the number of chromosomes affected by chromothripsis, are indicated. fSCNA, focal somatic copy number amplification. BFB, breakage-fusion-bridge; WGD, whole-genome duplication. (B) Proportion of trunk and branch chromothripsis events across 35 patients with chromothripsis+ tumors. A trunk chromothripsis event was defined as chromothripsis detectable across all tumor regions in the same patient, while a branch chromothripsis event was specific to specific tumor regions. (C) Representative images illustrating the multi-regional sampling sites of patient CUGA-MR-001. (D) Example of heterogeneous chromothripsis events involving chromosomes 6 and 13, detected in regions R3 and LNM from patient CUGA-MR-001. (E) A schematic illustration of chromothripsis evolution in cancer. Initiating driver instigates the initiation of tumors. After genome doubling of cancer cells, a subset of cancer cells experiences chromothripsis events, while others do not. As the tumor progresses, cells with chromothripsis undergo parallel evolution, whereas another subset, under the pressure of natural selection, generates new chromothripsis events and actively contributes to tumor metastasis. These dynamic processes collectively contribute to the subclonal evolution of the tumor.
Figure 5
Figure 5
Discovery of chromothripsis in urinary genomic DNA from UC (A) Chromothripsis and other genetic alterations in paired tumor and urine samples (N = 166). Each column represents one patient. Each row indicates genetic alterations detected in preoperative urine sediment (indicated by ‘‘U”) and paired tumors (indicated by ‘‘T”). (B) Comparison of the tumor purity between urine and paired tumor samples (paired t test). Tumor purity was calculated from WGS data using the FACETS algorithm. Values are represented as median with 25th and 75th percentile. (C) Proportion of patients with indicated events: T+ & U+: chromothripsis detected in both tumor and urine samples. T+ & U: chromothripsis detected only in tumors. T & U+: chromothripsis detected only in urine. T & U: chromothripsis undetected in both tumor and urine samples. (D) Proportion of urine samples with chromothripsis, stratified by tumor location (Fisher’s exact test, two-sided).

References

    1. Flaig T.W., Spiess P.E., Abern M., Agarwal N., Bangs R., Buyyounouski M.K., Chan K., Chang S.S., Chang P., Friedlander T., et al. NCCN Guidelines® Insights: Bladder Cancer, Version 3.2024. J. Natl. Compr. Cancer Netw. 2024;22:216–225. doi: 10.6004/jnccn.2024.0024. - DOI - PubMed
    1. Tran L., Xiao J.F., Agarwal N., Duex J.E., Theodorescu D. Advances in bladder cancer biology and therapy. Nat. Rev. Cancer. 2021;21:104–121. doi: 10.1038/s41568-020-00313-1. - DOI - PMC - PubMed
    1. Glaser A.P., Fantini D., Shilatifard A., Schaeffer E.M., Meeks J.J. The evolving genomic landscape of urothelial carcinoma. Nat. Rev. Urol. 2017;14:215–229. doi: 10.1038/nrurol.2017.11. - DOI - PubMed
    1. Sfakianos J.P., Cha E.K., Iyer G., Scott S.N., Zabor E.C., Shah R.H., Ren Q., Bagrodia A., Kim P.H., Hakimi A.A., et al. Genomic Characterization of Upper Tract Urothelial Carcinoma. Eur. Urol. 2015;68:970–977. doi: 10.1016/j.eururo.2015.07.039. - DOI - PMC - PubMed
    1. Fujii Y., Sato Y., Suzuki H., Kakiuchi N., Yoshizato T., Lenis A.T., Maekawa S., Yokoyama A., Takeuchi Y., Inoue Y., et al. Molecular classification and diagnostics of upper urinary tract urothelial carcinoma. Cancer Cell. 2021;39:793–809.e8. doi: 10.1016/j.ccell.2021.05.008. - DOI - PMC - PubMed

LinkOut - more resources