. 2025 Mar 27;145(13):1422-1436.
doi: 10.1182/blood.2024025245.

α-Ketoglutarate dehydrogenase is a therapeutic vulnerability in acute myeloid leukemia

Affiliations

α-Ketoglutarate dehydrogenase is a therapeutic vulnerability in acute myeloid leukemia

Scott E Millman et al. Blood. .

Abstract

Perturbations in intermediary metabolism contribute to the pathogenesis of acute myeloid leukemia (AML) and can produce therapeutically actionable dependencies. Here, we probed whether α-ketoglutarate (αKG) metabolism represents a specific vulnerability in AML. Using functional genomics, metabolomics, and mouse models, we identified the αKG dehydrogenase complex, which catalyzes the conversion of αKG to succinyl coenzyme A, as a molecular dependency across multiple models of adverse-risk AML. Inhibition of 2-oxoglutarate dehydrogenase (OGDH), the E1 subunit of the αKG dehydrogenase complex, impaired AML progression and drove differentiation. Mechanistically, hindrance of αKG flux through the tricarboxylic acid (TCA) cycle resulted in rapid exhaustion of aspartate pools and blockade of de novo nucleotide biosynthesis, whereas cellular bioenergetics was largely preserved. Additionally, increased αKG levels after OGDH inhibition affected the biosynthesis of other critical amino acids. Thus, this work has identified a previously undescribed, functional link between certain TCA cycle components and nucleotide biosynthesis enzymes across AML. This metabolic node may serve as a cancer-specific vulnerability, amenable to therapeutic targeting in AML and perhaps in other cancers with similar metabolic wiring.


Conflict of interest statement

Conflict-of-interest disclosure: S.W.L. declares outside consultancy and equity for Oric Pharmaceuticals, Blueprint Medicines, Mirimus, Senecea Therapeutics, Faeth Therapeutics, Selectin Therapeutics, and PMV Pharmaceuticals and outside consultancy (no equity) for Fate Therapeutics (unrelated to this manuscript). Z.S. has received research funds and reagents from Stemline Therapeutics and research reagents from Jazz Pharmaceuticals (neither of which are relevant to this study). The remaining authors declare no competing financial interests.

Figures

None
Graphical abstract
Figure 1.
Figure 1.
OGDH is a bona fide genetic dependency across AML systems. (A) Schematic of the TCA cycle highlighting the αKG dehydrogenase complex. (B) Differential gene dependency in AML vs all non-AML (other) cancer types, based on difference of mean depletion or enrichment of sgRNAs targeting individual genes across available CRISPR screens. An y-axis value <0 indicates preferential dependency in AML and a value >0 indicates preferential dependency in other. Each data point represents an individual gene. Selected genes are labeled. (C) OGDH, DLST, and DLD gene effect across CRISPR screens for AML vs other cell lines included in the DepMap database. A lower gene effect indicates an increased likelihood of gene dependency, with 0 indicating nondependency and –1 representing the median of all pan-essential genes. Each data point represents an individual cell line, and the mean ± standard error are shown. P values indicated (Wilcoxon rank-sum test). (D) OGDH gene dependency ranking across CRISPR screens for AML vs other cell lines included in the DepMap database. Each data point represents an individual cell line, and the mean ± standard error are shown. P value is indicated (Wilcoxon rank-sum test). (E) For each indicated gene, the violin plot shows change in sgRNA abundance (measured as log2 fold change) in publicly available whole-genome CRISPR screens across multiple AML vs other cancer cell lines. P values are indicated (Wilcoxon rank-sum test). (F-G) Western blot analysis showing the expression of OGDH in AML cell lines transduced with the indicated shRNA after 3 days of doxycycline treatment. (F) NrasG12D; MLL-AF9 cells. (G) p53R172H cells. (H-I) Depletion of Ogdh shRNAs in the competition assay. (H) NrasG12D; MLL-AF9 murine leukemia cells were infected with retroviruses encoding the indicated doxycycline-inducible shRNAs linked to a GFP reporter and admixed with 20% uninfected (GFP) cells. The relative percentages of GFP+ cells (normalized to day 1 for each shRNA) were counted on the indicated days after doxycycline treatment. P values of shOgdh vs shControl groups indicated (2-way analysis of variance [ANOVA] with Sidak multiple comparisons test). (I) p53R172H murine leukemia cells were infected with lentiviruses encoding reverse tetracycline-controlled transactivator and the indicated doxycycline-inducible shRNAs linked to a blue fluorescent protein (BFP) reporter on single backbone (LT3 BEPIR). Infected cells were admixed with 20% uninfected cells. The relative percentages of BFP+ cells (normalized to day 2 for each shRNA) were counted on the indicated days after doxycycline treatment. (J) Western blot analysis showing expression of OGDH in PDX1 AML cells 4 days after transduction with the indicated shRNAs. (K) Cell proliferation of PDX1 AML cells transduced with the indicated shRNAs (normalized to day 6 after infection for each shRNA). (L) Depletion of OGDH shRNAs in a competition assay in PDX2 cells. PDX2 AML cells were infected at day –7 with a lentivirus encoding shControl or shOGDH linked to a GFP reporter and a second lentivirus encoding shControl linked to a red fluorescent protein (RFP) reporter. The GFP:RFP ratio (normalized to day 0 for each shRNA pair) was measured on the indicated days. P value of shOGDH vs shControl group is indicated (2-way ANOVA). αKGDC, α-ketoglutarate dehydrogenase complex; ns, not significant; OAA, oxaloacetate.
Figure 2.
Figure 2.
OGDH is required for AML progression in vivo. (A) Schematic of in vivo knockdown experiment using transplantation of shRNA-transduced NrasG12D; MLL-AF9 AML. (B) Leukemia burden after shRNA knockdown of Ogdh in MLL-fusion AML. NrasG12D; MLL-AF9 AML clones transduced with retroviruses encoding doxycycline-inducible shControl or shOgdh were transplanted into sublethally irradiated recipient mice. Luminescence imaging was performed before (day 4) and 6 days after treatment with doxycycline vs vehicle (day 10). (C) Quantification of average radiance for the bioluminescence imaging shown in panel B. P values indicated (1-way ANOVA with Sidak multiple comparisons test; n = 5 per condition). (D) Survival curves are shown, and P values are indicated (log-rank test; n = 5-7 per condition). (E) Schematic of in vivo knockdown experiment using transplantation of shRNA-transduced p53R172H AML. (F) Leukemia burden after shRNA knockdown of Ogdh in p53-mutant AML. p53R172H AML clones transduced with retroviruses encoding doxycycline-inducible shControl or shOgdh were transplanted into sublethally irradiated recipient mice. GFP+ percentage in peripheral blood was measured at day 14. P values indicated (1-way ANOVA with Sidak multiple comparisons test; n = 7-8 per condition). Avg., average; max, maximum; min, minimum; Neo, neomycin resistance cassette; ns, not significant; p, photons; pre-tx, pre-treatment; puro, puromycin resistance cassette; PGK, phosphoglycerate kinase 1 promoter; rtTA, reverse tetracycline-controlled transactivator; s, seconds; sr, steradian; TRE, tetracycline response element.
Figure 3.
Figure 3.
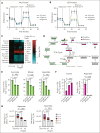
OGDH inhibition reduces TCA cycle flux and aspartate biosynthesis. (A-B) Analysis of mitochondrial bioenergetics. Agilent Seahorse XF Cell Mito Stress Test assay was performed on NrasG12D; MLL-AF9 AML cells (A) and p53R172H AML cells (B) at 48 hours after OGDH depletion for the measurement of cellular oxygen consumption rate (OCR). Mitochondrial inhibitors are individually labeled and were added at the indicated time points. (C) TCA cycle and related metabolite levels in p53R172H AML cells. LC-MS was performed at 48 hours after knockdown with the indicated shRNAs. Data are shown as a heat map of log2 fold change relative to shControl-treated cells. Red color represents upregulated; blue color, downregulated. P values are indicated (2-way ANOVA with Sidak multiple comparisons test; n = 3-6 per condition). (D) Schematic of oxidative flux (carbons labeled in green) or reductive flux (carbons labeled in purple) through the TCA cycle by 13C5-glutamine tracing. Red “X” indicates block observed in p53R172H AML after OGDH knockdown. Labeled carbons are indicated in gray, green, or purple. (E) Fraction (%) of m+4 labeling from 13C5-glutamine for the indicated metabolites in p53R172H AML after induction of shRNAs targeting OGDH (or control) for 48 hours and labeling for 6 hours. P values indicated (1-way ANOVA with Dunnett multiple comparisons test; n = 3 per condition). (F) Fraction (%) of m+5 labeled citrate or m+3 labeled aspartate from 13C5-glutamine in p53R172H AML after induction of shRNAs targeting OGDH (or control) for 48 hours and labeling for 6 hours. P values indicated (1-way ANOVA with Dunnett multiple comparisons test or Kruskal-Wallis with Dunn multiple comparisons test as appropriate; n = 3 per condition). (G) After induction of shRNAs targeting OGDH (or control) in p53R172H AML for 48 hours and labeling for 6 hours, LC-MS was used to determine the steady-state level and fraction of aspartate labeling from 13C6-glucose (left) or 13C5-glutamine (right). With 13C6-glucose tracing, the m+2 and m+4 fractions represent 1 and 2 forward rotations through the TCA cycle, respectively, whereas with 13C5-glutamine tracing m+2 represents 2 forward rotations and m+4 represents 1. Aspartate levels are shown as peak area in arbitrary units (a.u.) × fractional percentage of labeling with each tracer. P values are indicated for total labeled aspartate in shControl vs shOgdh groups (1-way ANOVA with Dunnett multiple comparisons test; n = 3 per condition). Ac-CoA, acetyl-coenzyme A; ctl, shControl; FCCP, carbonyl cyanide 4-(trifluoromethoxy)phenylhydrazone; ns, not significant.
Figure 4.
Figure 4.
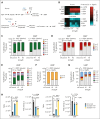
TCA cycle disruption compromises nucleotide biosynthesis in AML. (A) Schematics of the de novo purine (upper) and pyrimidine (lower) biosynthesis pathways highlighting aspartate (Asp)-dependent steps. (B) LC-MS for measurement of the levels of selected nucleotide intermediates (shown in heat map) was performed on p53R172H AML cells at 48 hours after knockdown with the indicated shRNAs. Data are shown as log2 fold change relative to shControl-treated cells. P values are indicated (2-way ANOVA with Sidak multiple comparisons test; n = 3-6 per condition). (C-D) Labeling of IMP and AMP. After induction of shRNAs targeting Ogdh (or Control) in p53R172H AML for 48 hours and labeling for 6 hours, LC-MS was used to determine the fraction (%) of IMP or AMP labeling from 13C6-glucose (C) or 15N1 glutamine (D). (E-G) The fraction (%) of UMP labeling from 13C6-glucose (E), 15N1-glutamine (F), or 13C5-glutamine (G) was measured. For panels C-G, P values are indicated for total percentage of labeled metabolites in shControl (Ctl) vs shOgdh groups (Wilcoxon rank-sum test or unpaired t test as appropriate; n = 3-6 per condition). (H) Levels or ratios of selected TCA cycle and nucleotide metabolites in PDX1 cells. LC-MS for measurement of the indicated metabolites was performed at 7 days after knockdown with the indicated shRNAs. Data are shown as either peak area (a.u) or a ratio. P values are indicated (1-way ANOVA with Sidak multiple comparisons test; n = 3 per condition). CA, carbamoyl aspartate; GDP; guanosine diphosphate; GTP, guanosine-5'-triphosphate; Pi; inorganic phosphate; R5P, ribose 5-phosphate.
Figure 5.
Figure 5.
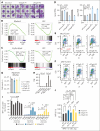
Biosynthetic failure in AML impairs cell cycle progression and drives differentiation. (A) Representative Cytospin and Hema3 stains of NrasG12D; MLL-AF9 clones transduced with the indicated shRNAs after 4 days of doxycycline treatment (n = 9 per condition). Scale bar, 10 μm. (B-C) Gene set enrichment analysis (GSEA) after OGDH depletion. NrasG12D; MLL-AF9 AML clones (B) or p53R172H AML cells (C) transduced with retroviruses encoding doxycycline-inducible shControl or shOgdh (2 independent shRNAs sequenced separately and pooled during analysis) were subjected to RNA sequencing after 4 days of treatment with doxycycline. GSEA identified pathways of interest that were upregulated or downregulated. (D) Transcript levels of Gata2 (left) and Gypa (right) in p53R172H AML cells treated with doxycycline for 4 days and sorted for BFP. BFP+ indicates shRNA on; BFP– indicates shRNA off. P values for shOgdh off (BFP) vs on (BFP+) indicated (unpaired t test; n = 4 per condition) (E-F) Cell cycle analysis by 5-ethynyl-2′-deoxyuridine (EdU) tracing. NrasG12D; MLL-AF9 (E) or p53R172H (F) AML cells treated with doxycycline for 4 days and sorted for GFP or BFP, respectively, were labeled with EdU for 1 hour. They were then fixed, permeabilized, stained with propidium iodide (PI), and subjected to cell cycle analysis by flow cytometry. Left lower gate represents G1 phase; upper gate, S phase; right lower gate, G2 phase/mitosis (M). Percentages of cells falling within each gate are indicated. (G) Extracellular aspartate levels in media were measured at 48 hours after knockdown of p53R172H AML cells with the indicated shRNAs. (H) Baseline transcript levels of Slc1a3 and Slc1a5 in p53R172H AML cells, MLL-fusion AML cells, and normal murine cKit-positive progenitor cells. (I) Relative number (% of control) of BFP+ cells after 4 days of induction of the indicated shRNA in p53R172H AML cells transduced with an empty vector or an exogenous Asp transporter (+SLC1A3). Media containing fetal bovine serum (FBS) was either unmodified (RPMI) or supplemented with 5 mM L-aspartate (L-Asp) or 10 mM L-glutamine (L-Gln) as indicated. P values are indicated (1-way ANOVA with either Dunn or Sidak multiple comparisons test as appropriate). (J) Median fluorescent intensity (MFI) of Cd11b after 4 days of induction of the indicated shRNAs in p53R172H AML cells transduced with an empty vector or vector for expression of an exogenous aspartate transporter (+SLC1A3). Media containing FBS was supplemented with 5 mM L-Asp. P values are indicated (1-way ANOVA with Sidak multiple comparisons test). FDR, false discovery rate; LSC, leukemia stem cell; NES, normalized enrichment score; ns, not significant; TPM, transcripts per million.
Figure 6.
Figure 6.
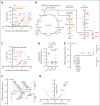
A functional genetic link between αKG dehydrogenase activity and de novo nucleotide biosynthesis exists across cancers. (A) Gene codependency with OGDH across all cancers. The graph shows correlation (r; x-axis) and –log10(P value) (y-axis; genes with P > 10E-5 not shown) of gene dependency with OGDH dependency across all cancer types, based on composite depletion or enrichment of sgRNAs targeting individual genes across available CRISPR screens. A positive Pearson coefficient indicates gene codependency with OGDH. Selected genes of interest are labeled with blue indicating TCA enzymes; yellow, pyrimidine biosynthesis enzymes; and red, purine biosynthesis enzymes. (B) Schematic of the TCA cycle and its connectivity to purine and pyrimidine biosynthesis, highlighting significantly correlated OGDH codependencies as determined in the analysis depicted in panel A. (C) Gene codependency with OGDH in nonhematologic cancers. The analysis was conducted as in panel A, except that hematologic cancers were excluded. (D) Quantification of the correlation between OGDH and all genes encoding components of the de novo nucleotide biosynthesis pathway, nucleotide salvage pathway, or shared between these 2 pathways. P values are indicated (Kruskal-Wallis with Dunn multiple comparisons test). (E-F) Differential gene dependency in AML vs all non-AML (other) cancer types, based on difference of mean depletion or enrichment of sgRNAs targeting individual genes across available CRISPR screens. An y-axis value <0 indicates preferential dependency in AML, and an y-axis value >0 indicates preferential dependency in other cancer types. The highlighted genes are those encoding components of the de novo nucleotide synthesis pathway (E; green) and those encoding components of the nucleotide salvage pathway (F; gray). Each data point represents an individual gene. (G) Correlation of relative metabolite levels with OGDH dependency across all cancer cell types. A positive Pearson coefficient indicates relative enrichment of an individual metabolite in cells demonstrating OGDH dependency. Selected nucleotide precursors are labeled. CMP, cytidine 5′-monophosphate; GMP, guanosine monophosphate; ns, not significant.

Comment in

References

    1. Dohner H, Wei AH, Appelbaum FR, et al. Diagnosis and management of AML in adults: 2022 recommendations from an international expert panel on behalf of the ELN. Blood. 2022;140(12):1345–1377. - PubMed
    1. Dang L, White DW, Gross S, et al. Cancer-associated IDH1 mutations produce 2-hydroxyglutarate. Nature. 2009;462(7274):739–744. - PMC - PubMed
    1. Ward PS, Patel J, Wise DR, et al. The common feature of leukemia-associated IDH1 and IDH2 mutations is a neomorphic enzyme activity converting alpha-ketoglutarate to 2-hydroxyglutarate. Cancer Cell. 2010;17(3):225–234. - PMC - PubMed
    1. Ward PS, Thompson CB. Metabolic reprogramming: a cancer hallmark even warburg did not anticipate. Cancer Cell. 2012;21(3):297–308. - PMC - PubMed
    1. Losman JA, Looper RE, Koivunen P, et al. (R)-2-hydroxyglutarate is sufficient to promote leukemogenesis and its effects are reversible. Science. 2013;339(6127):1621–1625. - PMC - PubMed

MeSH terms

Substances