. 2025 Mar 6;145(10):1034-1046.
doi: 10.1182/blood.2024025406.

Cullin-5 controls the number of megakaryocyte-committed stem cells to prevent thrombocytosis in mice

Affiliations

Cullin-5 controls the number of megakaryocyte-committed stem cells to prevent thrombocytosis in mice

Maria Kauppi et al. Blood. .

Abstract

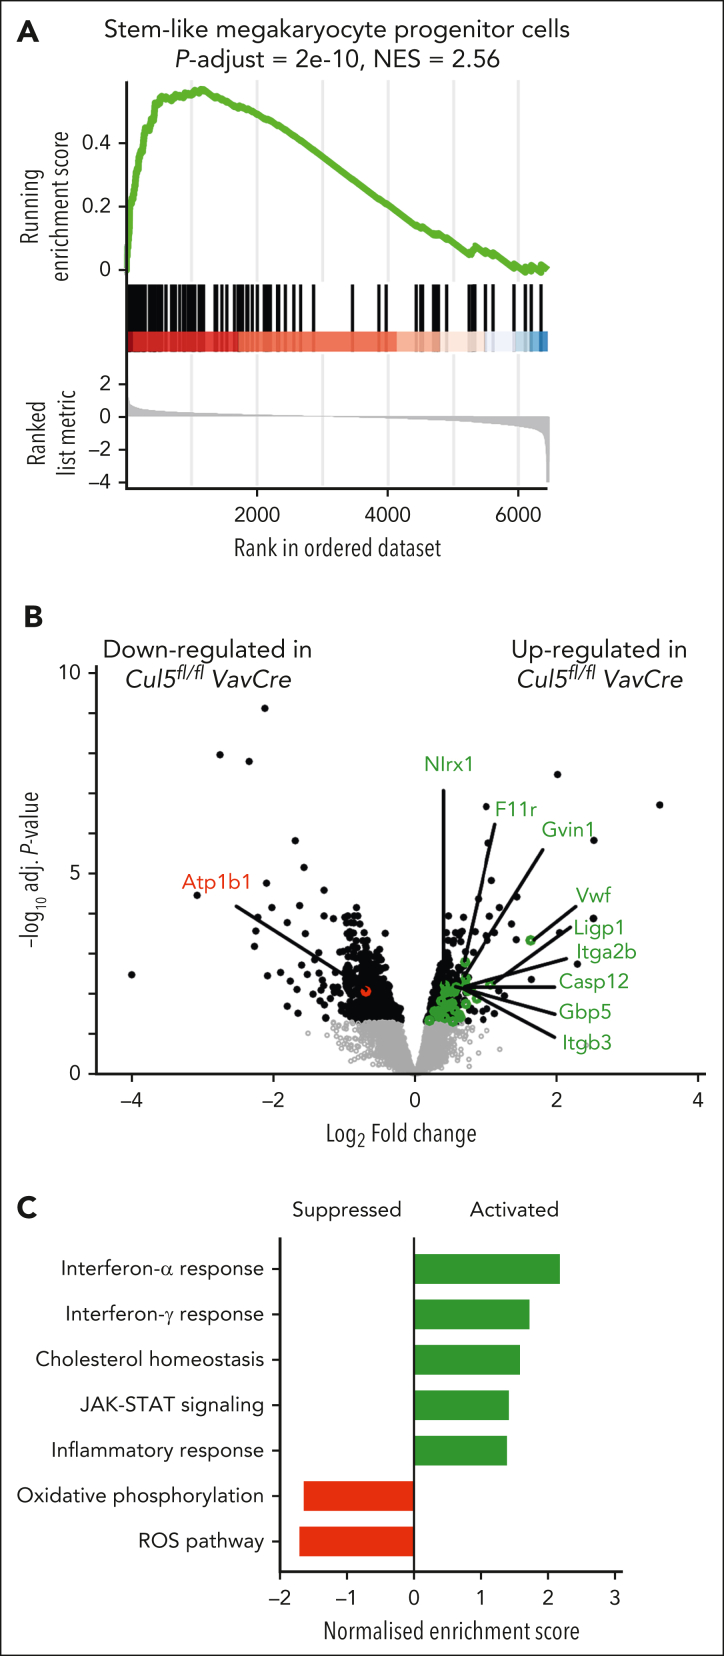
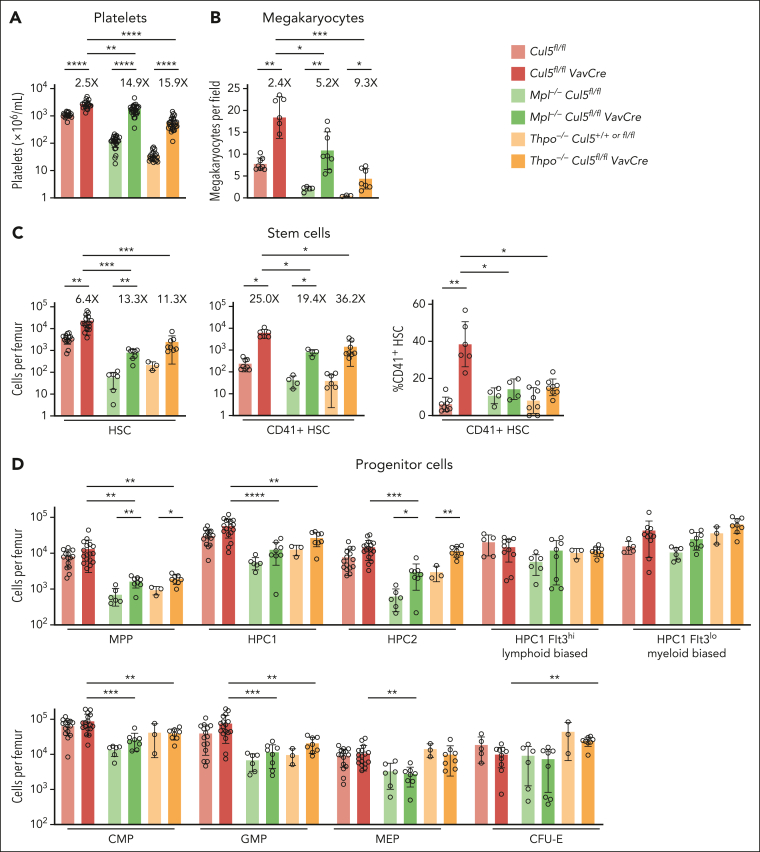
Cullin-5 (Cul5) coordinates the assembly of cullin-RING-E3 ubiquitin ligase complexes that include the suppressors of cytokine signaling (SOCS)-box-containing proteins. The SOCS-box proteins function to recruit specific substrates to the complex for ubiquitination and degradation. In hematopoiesis, SOCS-box proteins are best known for regulating the actions of cytokines that utilize the JAK-STAT signaling pathway. However, the roles of most SOCS-box proteins have not been studied in physiological contexts and any actions for Cul5/SOCS complexes in signaling by several hematopoietic cytokines, including thrombopoietin (TPO) and interleukin-3 (IL-3), remain unknown. To define additional potential roles for Cul5/SOCS complexes, we generated mice lacking Cul5 in hematopoiesis; the absence of Cul5 is predicted to impair the SOCS-box-dependent actions of all proteins that contain this motif. Here, we show that Cul5-deficient mice develop excess megakaryopoiesis and thrombocytosis revealing a novel mechanism of negative regulation of megakaryocyte-committed stem cells, a distinct population within the hematopoietic stem cell pool that have been shown to rapidly, perhaps directly, generate megakaryocytes, and which are produced in excess in the absence of Cul5. Cul5-deficient megakaryopoiesis is distinctive in being largely independent of TPO/myeloproliferative leukemia protein and involves signaling via the β-common and/or β-IL-3 receptors, with evidence of deregulated responses to IL-3. This process is independent of the interferon-α/β receptor, previously implicated in inflammation-induced activation of stem-like megakaryocyte progenitor cells.


Conflict of interest statement

Conflict-of-interest disclosures: The authors declare no competing financial interests.

Figures

None
Graphical abstract
Figure 1.
Figure 1.
Excess megakaryopoiesis in Cul5fl/flVavCre mice. Numbers of (A) platelets (n = 21–24) and (B) megakaryocytes per field (n = 5–8) from histological sections of sternal BM from Cul5fl/flVavCre and Cul5fl/fl, Cul5+/+ and Cul5+/+VavCre control mice. Numbers of (C) MkP (LinSca1Kit+CD150+CD41+, n = 6-12) and (D) HSC (LinSca1+Kit+CD150+CD48), multipotent progenitor (MPP) cells (LinSca1+Kit+CD150CD48lo/−), HPC1 (LinSca1+Kit+CD150CD48+), HPC2 (LinSca1+Kit+CD150+CD48+), HPC1Flt3hi and HPC1Flt3lo cells (top panel, n = 4-17), and common myeloid progenitor (CMP) (LinSca1Kit+CD34+ FcγRII/IIIlo), granulocyte-macrophage progenitor (GMP) (LinSca1Kit+CD34+ FcgRII/III+), megakaryocyte-erythroid progenitor (MEP) (LinSca1Kit+CD34FcgRII/III) and colony-forming erythroid (CFU-E) (LinSca1Kit+CD150EndoglinhiFcγRII/IIIlo) (lower panel, n = 4-17) in Cul5fl/flVavCre and Cul5fl/fl, Cul5+/+ and Cul5+/+VavCre control mice. Each point is data from an individual mouse, bars represent mean ± standard deviation (SD). ∗∗P < .01, ∗∗∗∗P < .0001 for comparison of data from Cul5fl/flVavCre mice with that of control genotypes (1-way analysis of variance [ANOVA] with Dunnett correction for multiple comparisons).
Figure 2.
Figure 2.
Megakaryopoiesis is normal in Cul5fl/flPF4Cre mice. (A) Western blot analysis showing effective depletion of Cul5 in platelets from Cul5fl/flPF4Cre mice. Each sample is from an independent mouse of the genotypes shown. Numbers of (B) platelets (n = 5-6), (C) megakaryocytes per field from histological sections of sternal BM (n = 6), and (D) HSCs (LinSca1+Kit+CD150+CD48, n = 6) in Cul5fl/flPF4Cre and Cul5fl/fl control mice. Each point is data from an individual mouse, bars represent mean ± SD. No statistically significant differences (P < .05) were observed for comparison of data from Cul5fl/flPF4Cre mice to that of Cul5fl/fl mice (unpaired Welch t test).
Figure 3.
Figure 3.
Increased numbers of megakaryocyte-committed cells in the HSC compartment of Cul5fl/flVavCre mice. (A) Numbers of megakaryocyte colonies and other myeloid colonies cultured from whole BM (per 25 000 cells, n = 3) and sorted BM populations (per 500 cells, n = 3-4) as shown (LSK [LinSca1+Kit+], HSC [LinSca1+Kit+CD150+CD48; CD41+HSC, CD41loHSC], MPP [LinSca1+Kit+CD150CD48lo/−], HPC1 [LinSca1+Kit+CD150CD48+], HPC2 [LinSca1+Kit+CD150+CD48+]). (B) Differential counts (per 500 cells) of colony types in cultures of LSK cells from Cul5fl/flVavCre and control Cul5fl/fl mice (n = 7). Cells were plated in semisolid agar cultures containing stem cell factor, IL-3 and EPO, and incubated for 7 days before fixation, staining, and counting. (C) Numbers per femur (left panel) and percentage in the HSC population (right panel) of CD41+HSC (LinSca1+Kit+CD150+CD48CD41+, n = 6-8). The fold-difference in numbers of CD41+HSC between Cul5fl/flVavCre and Cul5fl/fl mice is indicated above the bar graph. (D) Expression profiles (left panel), median VWF signal intensity (center panel) of VWF expression measured by mass cytometry and proportion of VWF+ cells in HSC (right panel, LinSca+Kit+CD150+CD48) from Cul5fl/flVavCre and Cul5+/+ or fl/fl mice (n = 3). Each point represents data from an individual mouse, bars represent mean ± SD. ∗P < .05, ∗∗P < .01, ∗∗∗P < .001 for comparison of data from Cul5fl/flVavCre with Cul5+/+ or fl/fl mice (unpaired Welch t test with Holm-Sidak correction for multiple comparisons). Eo, eosinophil; Ery, erythroid; G, granulocyte; GM, granulocyte-macrophage; M, macrophage; Meg, megakaryocyte; Meg/E, megakaryocyte/erythroid; mixed, mix of 3 or more colony types and blast cell colonies.
Figure 4.
Figure 4.
Single-cell sequencing of LSK cells from Cul5fl/flVavCre mice. (A) Upper panel shows distinct cell clusters identified from single-cell RNA sequencing of purified LSK cells from Cul5fl/flVavCre and Cul5fl/fl mice. Comparisons of differential gene expression of clusters compared to published RNA-sequence datasets from wild-type hematopoietic cells (ImmGen, GSE109125) revealed similarity of clusters with HSC; MMP2; MMP3; MMP4 as indicated. Notably, cell cluster 2, which was specifically identified in the Cul5fl/flVavCre sample showed similarity to LT-HSC and prominent VWF expression (lower panel). Low frequency clusters with gene expression patterns resembling MEP, GMP, and monocytes were also identified. (B) Relative number of cells in specific clusters.
Figure 5.
Figure 5.
Proteomic analysis of Cul5fl/flVavCre LSK cells. (A) Gene set enrichment analysis (GSEA) was performed and “signal-to-noise ratio” statistics were used to rank proteins identified as characteristic of stem-like MkP according to their correlation with either Cul5fl/fl or Cul5fl/flVavCre LSK cells. The graph below represents the ranked, ordered, nonredundant list of proteins; those on the far left (red) show a higher correlation with Cul5fl/flVavCre LSK cells, whereas those on the far right (blue) correlated the most with Cul5fl/fl samples. The vertical black lines indicate the position of each protein of the studied set in the ordered, nonredundant data set. The green curve corresponds to the ES (enrichment score) curve, which is the running sum of the weighted enrichment score obtained from GSEA software. (B) Volcano plot showing statistical significance (−log10 adjusted P value) vs magnitude of protein expression changes (log2 fold change) from a comparison of Cul5fl/flVavCre LSK cells with Cul5fl/fl controls. Overlaid are proteins significantly enriched in a previously published set of proteins identified as characteristic of stem-like MkP that were enriched (green) or suppressed (red) in the proteome of Cul5fl/flVavCre cells compared with Cul5fl/fl controls; the top 10 of these exhibiting the greatest fold-change enrichment in Cul5fl/flVavCre LSK cells are labeled. (C) Enrichment or suppression of proteins associated with inflammatory or interferon responses as well as selected pathways associated with stem cell regulation in the proteome of Cul5fl/flVavCre compared with Cul5fl/fl controls. The gene sets used in this comparison are provided in supplemental Table 7; pathways activated or suppressed with adjusted P value <.1 are shown. NES, normalised enrichment score; ROS, reactive oxygen species.
Figure 6.
Figure 6.
Excess megakaryopoiesis in Cul5fl/flVavCre mice is largely independent of Mpl and TPO. Numbers of (A) platelets (n = 21-28), (B) megakaryocytes per field from histological sections of sternal BM (n = 3-8) and (C) HSC (LinSca1+Kit+CD150+CD48, n = 3-17, left panel), CD41+HSC (n = 4-8, center panel) and percentage CD41+HSC in the HSC population (n = 4-8, right panel) in Cul5fl/flVavCre, Cul5fl/fl, Mpl–/–Cul5fl/flVavCre, Mpl–/–Cul5fl/fl, Thpo–/–Cul5fl/flVavCre, and Thpo–/–Cul5+/+ or fl/fl mice. Fold-differences in numbers of platelets, megakaryocytes, HSCs, and CD41+HSC between Cul5fl/flVavCre and Cul5fl/fl mice, Mpl–/–Cul5fl/flVavCre and Mpl Cul5fl/fl mice or Thpo–/–Cul5fl/flVavCre and Thpo–/–Cul5+/+ or fl/fl mice are indicated above the bar graphs. (D) Numbers of MPP (LinSca1+Kit+CD150CD48lo/–), HPC1 (LinSca1+Kit+CD150CD48+), HPC2 (LinSca1+Kit+CD150+CD48+), HPC1Flt3hi and HPC1Flt3lo cells (upper panel, n = 3-17), and CMP (LinSca1Kit+CD34+FcgRII/IIIlo), GMP (LinSca1Kit+CD34+FcgRII/III+), MEP (LinSca1Kit+CD34FcgRII/III) and CFU-E (LinSca1Kit+CD150EndoglinhiFcγRII/IIIlo) (lower panel, n = 3-17) in Cul5fl/flVavCre, Cul5fl/fl, Mpl–/–Cul5fl/flVavCre, Mpl–/–Cul5fl/fl, Thpo–/–Cul5fl/flVavCre, and Thpo–/–Cul5+/+ or fl/fl mice. Each point represents data from an individual mouse, bars represent mean ± SD. ∗P < .05, ∗∗P < .01, ∗∗∗P < .001, ∗∗∗∗P < .0001 for comparison of Cul5fl/flVavCre, Mpl–/–Cul5fl/flVavCre and Thpo–/–Cul5fl/flVavCre data with their respective Cul5+/+ or fl/fl controls and Cul5fl/flVavCre with Mpl–/–Cul5fl/flVavCre and Thpo–/–Cul5fl/flVavCre (1-way ANOVA with Dunnett’s correction for multiple comparisons). Data from Cul5fl/flVavCre and Cul5fl/fl are reproduced from Figure 1A-B,D and Figure 3C for comparison.
Figure 7.
Figure 7.
βc and/or βIL3 receptor signaling enhances megakaryopoiesis in Cul5-deficient mice. Numbers of (A) platelets (n = 5), (B) megakaryocytes per field from histological sections of sternal BM (n = 5), and (C) HSC (LinSca1+Kit+CD150+CD48, n = 5, left panel), CD41+HSC (n = 5, center panel) and percentage CD41+HSC in the HSC population (n = 5, right panel) in Cul5fl/flVavCre, Cul5fl/fl, βc–/–βIL3–/–Cul5+/+ or fl/fl and βc–/–βIL3–/–Cul5fl/flVavCre, mice. Fold-differences in numbers of platelets, megakaryocytes, HSC and CD41+HSC between Cul5fl/flVavCre and Cul5fl/fl mice or βc–/–βIL3–/–Cul5fl/flVavCre and βc–/–βIL3–/–Cul5+/+ or fl/fl mice are indicated above the bar graphs. (D) Numbers of MPP (LinSca1+Kit+CD150CD48lo/–), HPC1 (LinSca1+Kit+CD150CD48+), HPC2 (LinSca1+Kit+CD150+CD48+), HPC1Flt3hi and HPC1Flt3lo cells (upper panel, n = 5), and CMP (LinSca1Kit+CD34+FcgRII/IIIlo), GMP (LinSca1Kit+CD34+FcgRII/III+), MEP (LinSca1Kit+CD34FcgRII/III) and CFU-E (LinSca1Kit+CD150EndoglinhiFcγRII/IIIlo) (lower panel, n = 4) in Cul5fl/flVavCre, Cul5fl/fl, βc–/–βIL3–/–Cul5+/+ or fl/fl and βc–/–βIL3–/–Cul5fl/flVavCre, mice. Each point is data from an individual mouse, bars represent mean ± SD. ∗P < .05, ∗∗P < .01 for comparison of Cul5fl/flVavCre and βc–/–βIL3–/–Cul5fl/flVavCre data with their respective Cul5+/+ or fl/fl controls and Cul5fl/flVavCre with βc–/–βIL3–/–Cul5fl/flVavCre (1-way ANOVA with Dunnett’s correction for multiple comparisons). (E) Proliferation of Cul5fl/flVavCre and Cul5fl/fl LSK cells in liquid cultures stimulated with IL-3 or GM-CSF, assessed after 3 days using CellTitreGlo. Each line represents data from a single mouse. (F) Analysis of phospho(p)Stat5 induction by mass cytometry in LSK cells from Cul5fl/flVavCre and Cul5fl/fl mice. Each line shows mean ± SD of 3 independent samples pooled from multiple mice of each genotype stimulated with 1000 units/mL IL-3 or GM-CSF for the times indicated. ∗P < .05 for comparison of data from Cul5fl/flVavCre with Cul5fl/fl at each time point (paired t test with Holm-Sidak correction for multiple comparisons). min, minutes; RLU, relative light units.

Comment in

References

    1. Linossi EM, Nicholson SE. The SOCS box-adapting proteins for ubiquitination and proteasomal degradation. IUBMB Life. 2012;64(4):316–323. - PubMed
    1. Morris R, Kershaw NJ, Babon JJ. The molecular details of cytokine signaling via the JAK/STAT pathway. Protein Sci. 2018;27(12):1984–2009. - PMC - PubMed
    1. Alexander WS, Starr R, Fenner JE, et al. SOCS1 is a critical inhibitor of interferon gamma signaling and prevents the potentially fatal neonatal actions of this cytokine. Cell. 1999;98(5):597–608. - PubMed
    1. Chong MM, Cornish AL, Darwiche R, et al. Suppressor of cytokine signaling-1 is a critical regulator of interleukin-7-dependent CD8+ T cell differentiation. Immunity. 2003;18(4):475–487. - PubMed
    1. Cornish AL, Chong MM, Davey GM, et al. Suppressor of cytokine signaling-1 regulates signaling in response to interleukin-2 and other gamma c-dependent cytokines in peripheral T cells. J Biol Chem. 2003;278(25):22755–22761. - PubMed

MeSH terms

LinkOut - more resources