. 2025 Jun 21;27(5):1325-1340.
doi: 10.1093/neuonc/noaf007.

Establishing a living biobank of pediatric high-grade glioma and ependymoma suitable for cancer pharmacology

Affiliations

Establishing a living biobank of pediatric high-grade glioma and ependymoma suitable for cancer pharmacology

Clémence Deligne et al. Neuro Oncol. .

Abstract

Background: Brain tumors are the deadliest solid tumors in children and adolescents. Most of these tumors are glial in origin and exhibit strong heterogeneity, hampering the development of effective therapeutic strategies. In the past decades, patient-derived tumor organoids (PDT-O) have emerged as powerful tools for modeling tumoral cell diversity and dynamics, and they could then help define new therapeutic options for pediatric brain tumors.

Methods: Through an integrative approach based on our expertise and a careful review of the literature about glioblastoma 3D primary cultures, we set up a standardized methodological pipeline for the establishment, characterization, and biobanking of PDT-O through direct 3D in vitro culture of the deadliest pediatric glial brain tumors. To assess PDT-O fidelity and validate their preclinical relevance, we performed comprehensive histological, molecular, and drug-response analyses.

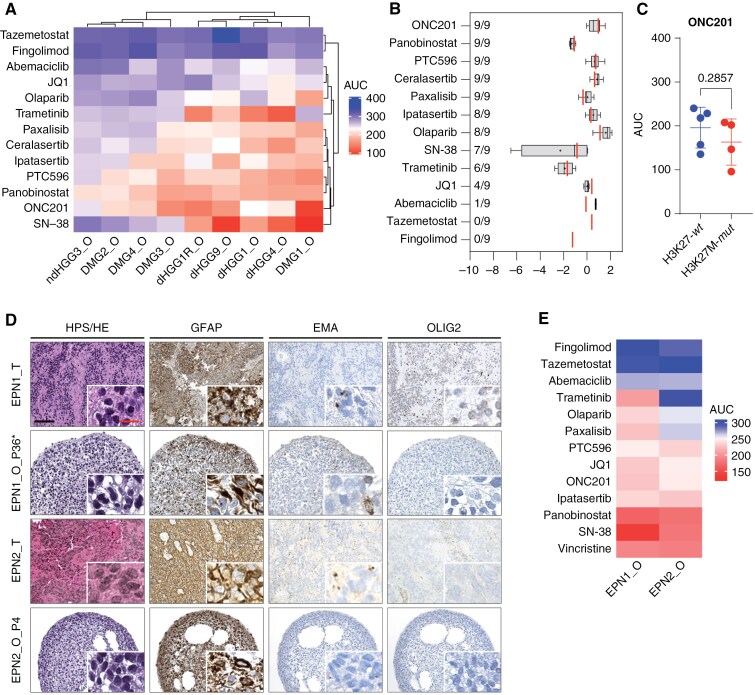
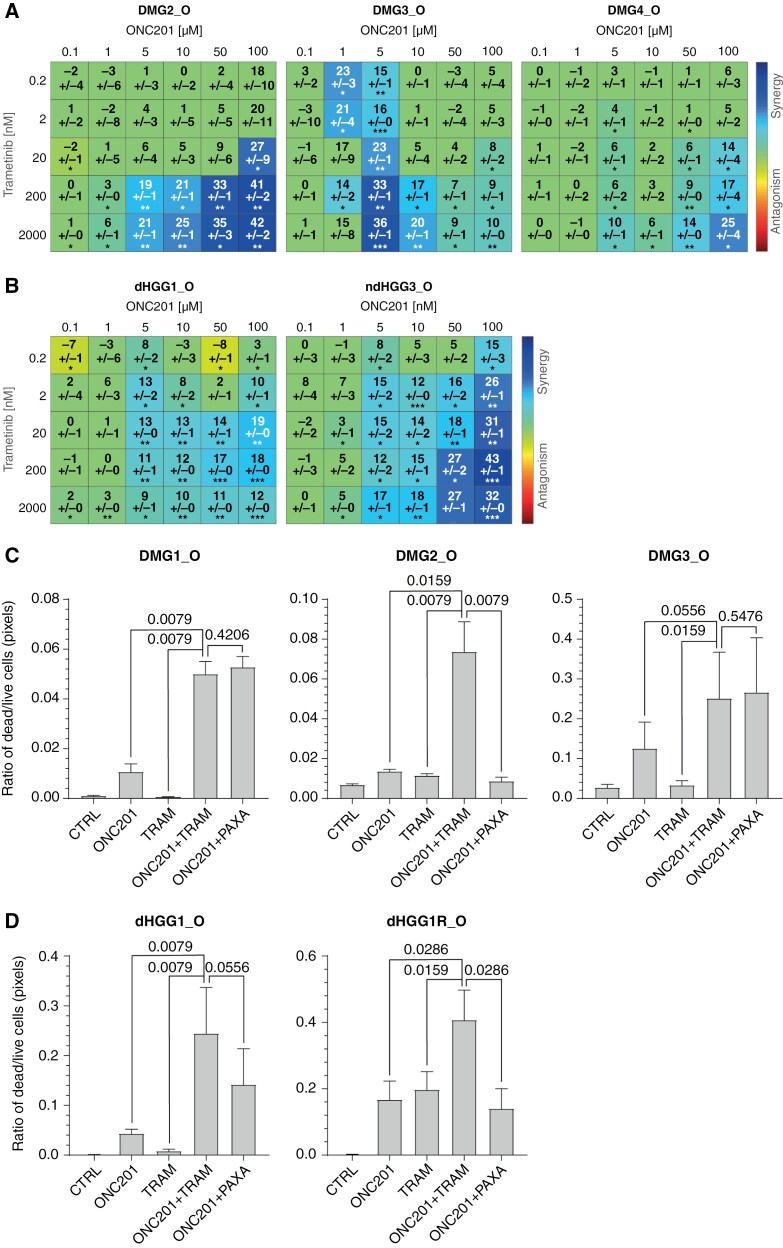
Results: Our methodological pipeline allowed the rapid and efficient generation of PDT-O recapitulating their parental tumor features, including intratumoral heterogeneity, even after several passages and cryopreservation/revival as 3D cultures. Moreover, we successfully performed preclinical test responses on these PDT-O to standard-of-care therapies and new therapeutic options. Finally, we identified ONC201 as a selective drug for pediatric glial tumor types not restricted to H3K27-altered glial tumors, as well as combination strategies to increase the therapeutic response to ONC201.

Conclusions: Hence, we describe a fast and robust process to biobank PDT-O for pediatric glial brain tumors. These PDT-O models have the potential for patient-specific modeling even after long-term expansion in vitro, and we established the proof-of-concept of their usefulness to support powerful preclinical studies.

Keywords: drug combinations; ependymoma; glioma; pediatric brain tumor; tumor organoids.


Conflict of interest statement

The authors declare no competing interests.

Figures

Graphical Abstract
Graphical Abstract
Figure 1.
Figure 1.
pHGG-derived tumor organoids preserve histologic features of parental tumor subtypes. Representative hematoxylin-phloxine-saffron (HPS) and immunohistochemistry images of dHGG1-O, dHGG1R-O, DMG1-O, and their tumors of origin. Key clinical marker proteins routinely used for pHGG diagnosis, that is, Ki67, GFAP, OLIG2, SOX2, SOX10, and VIM, were stained. Abbreviations: -O, tumor organoid; -T, tumor. Black scale bar: 100 µm; red scale bar: 25 µm, identical for all images. For tissues, one piece of 0.5 cm2 was used for this characterization; for PDT-O, 8 to 18 spheres were fixed between passages P3 and P6, depending on the model.
Figure 2.
Figure 2.
pHGG-derived tumor organoids preserve multiomics features of parental tumor subtypes. (A) Heatmap of Pearson correlation coefficients between all samples based on normalized transcriptomic data (gene expression). The correlation coefficients were calculated on all genes, except for the 10% with the highest average expression in tissue, to exclude the immune and healthy components due to normal cell contamination. The hierarchical clustering was based on the Euclidean distance. (B) Heatmap of Pearson correlation coefficients between all samples based on genomic data. Correlation coefficients were calculated using the variant allele frequency, and the hierarchical clustering was based on the Euclidean distance. (A, B) Abbreviations: -O, tumor organoid; -T, tumor. Tissue samples are annotated “1” or “2” as an indication of the number of biological replicates and PDT-O samples are annotated with passage number (P). PDT-O were further annotated with “*” when submitted to a cryopreservation/thawing cycle.
Figure 3.
Figure 3.
pHGG-O preserve intratumoral heterogeneity and cellular hierarchies of gliomas. (A) UMAPs of DMG1-O depicting module scores of OPC- (shared and variable), OC-, AC-, and MES-like cell programs,, color-coded with a blue (low score) to red (high score) gradient. (B) UMAPs of dHGG1R-O depicting module scores of NPC1/2-, OPC-, AC-, and MES2-like cell programs, color-coded with a blue (low score) to red (high score) gradient.
Figure 4.
Figure 4.
PDT-O are predictive of clinical responses in corresponding patients. (A) Timelines of patient clinical history. Treatment regimens of hemispheric H3K27-wt pHGG (left) and DMG (right) patients with major molecular alterations, status (alive/dead), timing of PDT-O derivation, and overall survival from diagnosis to last known status (September 2024). Abbreviations: -O, tumor organoid; -T, tumor; TMZ, Temozolomide; RT, radiotherapy; MTX, Methotrexate; PARPi, PARP inhibitor; ATRi, ATR inhibitor; mth, month; yr: year. (B–D) Drug dose–response curves. Representative results of 3 independent experiments. Red-dotted lines represent the maximal plasmatic concentrations (Cmax, in 10log nM or µM). Abbreviations: -O, tumor organoid; -T, tumor. (B) NTRK-inhibitor Larotrectinib (from 0.57 to 18 750 nM) in dHGG1-O and dHGG1R-O. (C) mTOR inhibitor Everolimus (from 0.0001 to 1 µM) in DMG1-O, DMG2-O, and DMG3-O. (D) ONC201 (from 0.01 to 100 µM) in DMG4-O and DMG4R-O.
Figure 5.
Figure 5.
PDT-O are eligible for screenings for a personalized selection of effective drugs. (A) Heatmap of the AUCs calculated from N = 3 independent experiments for each drug at the concentrations presented in Supplementary Table S6, for all H3K27-wt pHGG-O and DMG-O models. AUCs are color-coded with a blue (high AUC, low drug efficiency) to red (low AUC, high drug efficiency) gradient. (B) Drug screen “hits” within the context of clinically achievable plasmatic drug levels. Box-plot of IC50 absolute values (in 10log µM) calculated from N = 3 independent experiments for all drugs in each PDT-O line, including the number of samples reaching 50% of viability in the range of tested concentrations. Red lines represent the maximal plasmatic concentrations (Cmax, in 10log µM). (C) Scatter plot of the AUCs for ONC201 in all pHGG-O and DMG-O models based on H3K27M status: H3K27-wild-type (H3K27-wt, blue) or H3K27M-mutant (H3K27M-mut, red). P-value was determined using a Mann–Whitney test (2-tailed). (D) Representative hematoxylin-phloxine-saffron (HPS), hematoxylin-eosin (HE), and immunohistochemistry images of EPN1-O, EPN2-O, and their tumors of origin (EPN1-T, EPN2-T). Key clinical marker proteins routinely used for pEPN-PFA diagnosis, that is, GFAP, EMA, and OLIG2, were stained. Black scale bar: 300 µm; red scale bar: 50 µm. For tissues, one piece of 0.5 cm2 was used for this characterization; for PDT-O, 4 to 5 spheres were fixed at passages P36* (submitted to a cryopreservation/thawing cycle; EPN1-O) and P4 (EPN2-O). (E) Heatmap of the AUCs calculated from N = 3 independent experiments for each drug at the concentrations presented in Supplementary Table S6, for all pPFA-EPN-O samples. AUCs are color-coded with a blue (high AUC, low drug efficiency) to red (low AUC, high drug efficiency) gradient.
Figure 6.
Figure 6.
Trametinib is synergistic with ONC201 across pHGG-O models. (A, B) Quantification of ONC201 and Trametinib combination effects in terms of synergy, additivity, and/or antagonism in selected PDT-O lines. Combination effect (synergy, additivity, or antagonism) between both drugs was determined on 3 independent tumoroids using Combenefit software and Loewe synergy and antagonism analysis. Scores < −5 indicate an antagonist effect, scores between −5 and 5 indicate an additive effect, scores between 5 and 10 indicate a low synergistic effect, and scores >10 indicate a synergistic effect. *P-value < .05, **P-value < .001, ***P-value < .0001. (A) DMG-O models (DMG2-O, DMG3-O, and DMG4-O) and (B) H3K27-wt pHGG-O models (dHGG1-O and ndHGG3-O). (C, D) Quantification of live/dead immunofluorescence stainings of selected PDT-O lines, treated with DMSO only (CTRL), ONC201 (10 µM), Trametinib (TRAM; 20 nM), ONC201 and Trametinib (ONC201 + TRAM; 10 µM and 20 nM, respectively) or ONC201 and Paxalisib (ONC201 + PAXA; 10 µM and 0.5 µM, respectively). The ONC201 and Paxalisib combination was used as a synergy control, as demonstrated by Jackson et al. Quantification was performed by measuring the ratio of the pixel surface area of dead cells to the one of live cells using the ImageJ software on 3 to 5 independent tumoroids per condition. P-values were determined using Mann–Whitney tests (2-tailed). (C) DMG-O models (DMG1-O, DMG2-O, and DMG3-O) were treated for 72 h (DMG1-O and DMG3-O) or 96 h (DMG2-O). (D) H3K27-wt pHGG-O (dHGG1-O and dHGG1R-O) models were treated for 72 h.

References

    1. Pollack IF. Brain tumors in children. N Engl J Med. 1994;331(22):1500–1507. - PubMed
    1. Louis DN, Perry A, Wesseling P, et al. The 2021 WHO classification of tumors of the central nervous system: a summary. Neuro Oncol. 2021;23(8):1231–1251. - PMC - PubMed
    1. MacDonald TJ, Aguilera D, Kramm CM.. Treatment of high-grade glioma in children and adolescents. Neuro Oncol. 2011;13(10):1049–1058. - PMC - PubMed
    1. Pohl LC, Leitheiser M, Obrecht D, et al. Molecular characteristics and improved survival prediction in a cohort of 2023 ependymomas. Acta Neuropathol. 2024;147(1):24. - PMC - PubMed
    1. Lewis PW, Müller MM, Koletsky MS, et al. Inhibition of PRC2 activity by a gain-of-function H3 mutation found in pediatric glioblastoma. Science. 2013;340(6134):857–861. - PMC - PubMed

Substances

LinkOut - more resources