. 2025 Jan 10:12:RP92979.
doi: 10.7554/eLife.92979.

Surprising features of nuclear receptor interaction networks revealed by live-cell single-molecule imaging

Affiliations

Surprising features of nuclear receptor interaction networks revealed by live-cell single-molecule imaging

Liza Dahal et al. Elife. .

Abstract

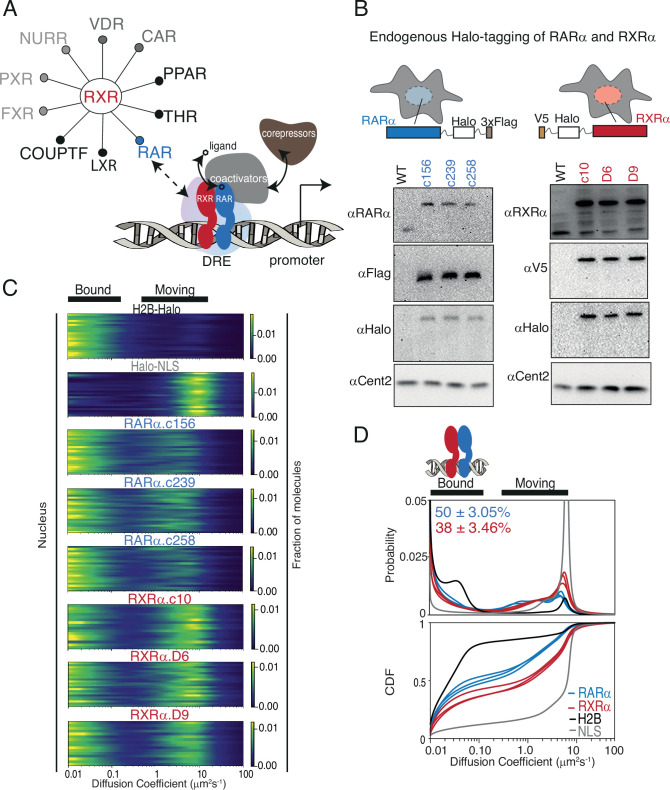
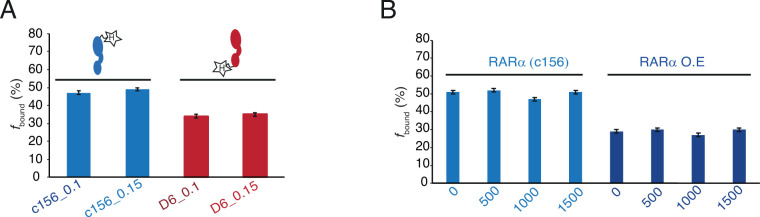
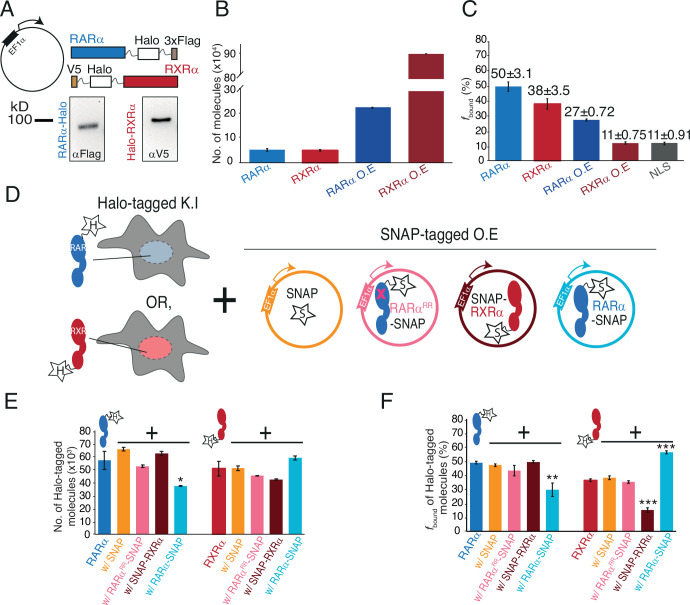
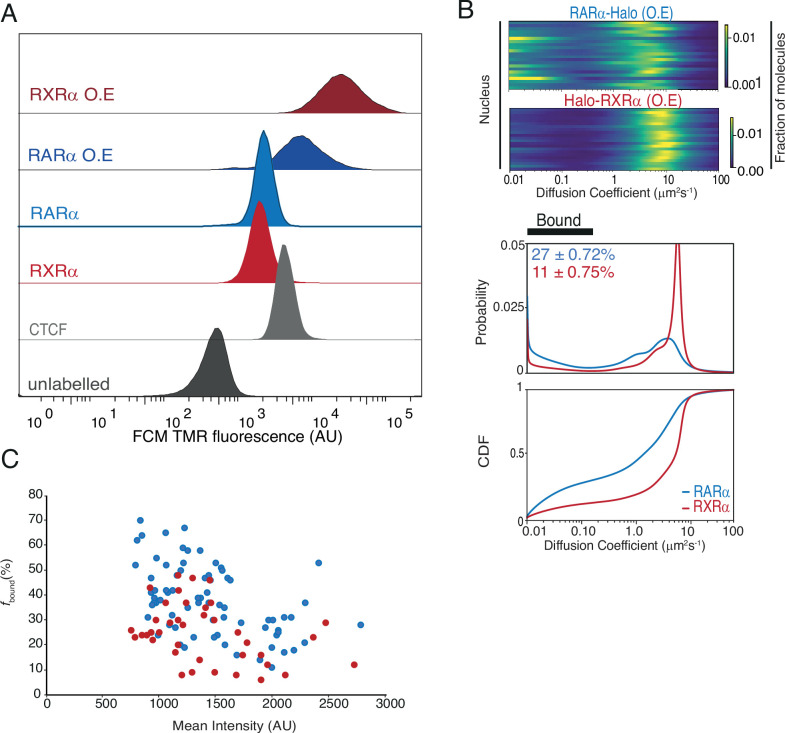
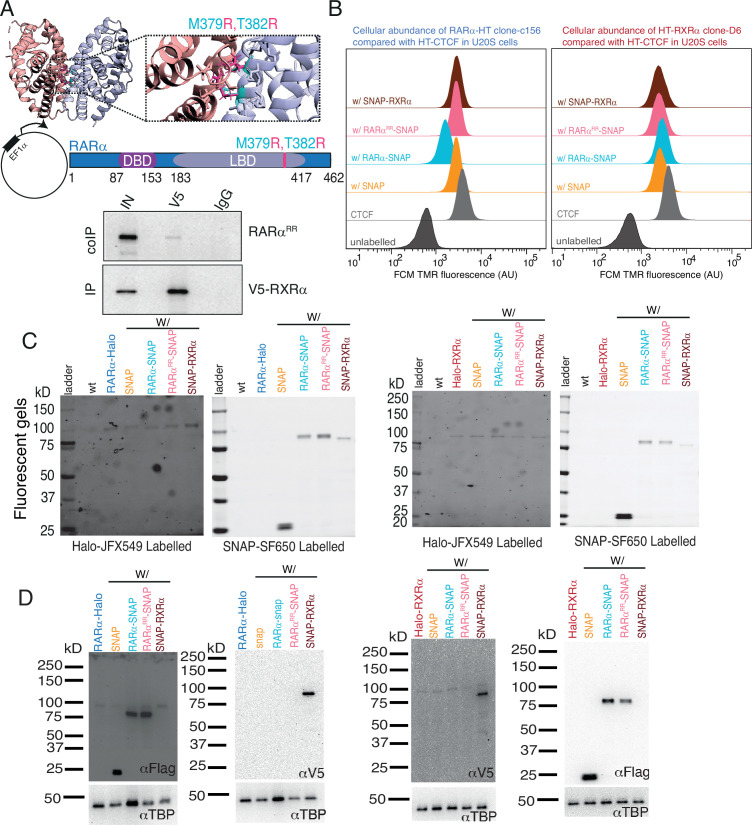
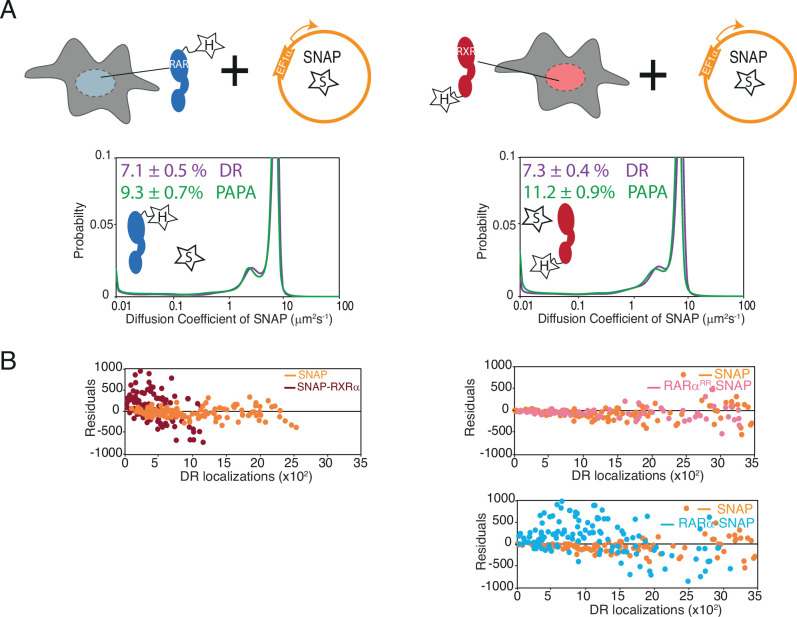
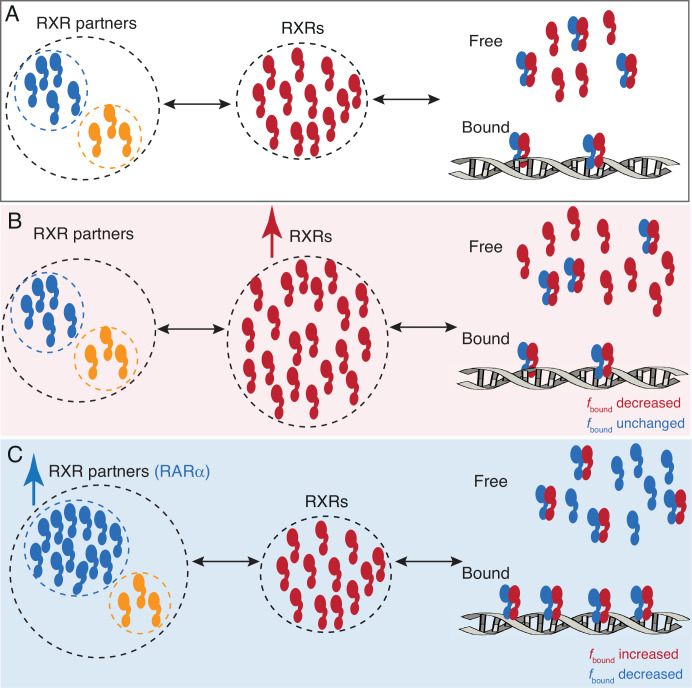
Type II nuclear receptors (T2NRs) require heterodimerization with a common partner, the retinoid X receptor (RXR), to bind cognate DNA recognition sites in chromatin. Based on previous biochemical and overexpression studies, binding of T2NRs to chromatin is proposed to be regulated by competition for a limiting pool of the core RXR subunit. However, this mechanism has not yet been tested for endogenous proteins in live cells. Using single-molecule tracking (SMT) and proximity-assisted photoactivation (PAPA), we monitored interactions between endogenously tagged RXR and retinoic acid receptor (RAR) in live cells. Unexpectedly, we find that higher expression of RAR, but not RXR, increases heterodimerization and chromatin binding in U2OS cells. This surprising finding indicates the limiting factor is not RXR but likely its cadre of obligate dimer binding partners. SMT and PAPA thus provide a direct way to probe which components are functionally limiting within a complex TF interaction network providing new insights into mechanisms of gene regulation in vivo with implications for drug development targeting nuclear receptors.

Keywords: chromosomes; gene expression; gene regulatory networks; human; molecular biophysics; nuclear receptors; protein-protein interactions; single-molecule tracking; structural biology; transcription factors.


Conflict of interest statement

LD, GD, RT No competing interests declared, TG is an inventor of pending patent application (PCT/US2021/062616) related to the use of PAPA as a molecular proximity sensor, AH is currently an employee of Eikon Therapeutics, XD is a co-founder of Eikon Therapeutics, Inc and an inventor on a pending patent application (PCT/US2021/062616) related to the use of PAPA as a molecular proximity sensor

Figures

Figure 1.
Figure 1.. Endogenous Halo-tagging of RARa and RXRa to characterize their diffusive behavior.
(A) Schematic showing Type II nuclear receptors (T2NRs) like RXR-RAR bind direct response elements (DREs) as heterodimers to activate or repress transcription by recruiting co-activators (in presence of ligand) or co-repressors (in absence of ligand). A competitive interaction network between the obligate heterodimeric partner RXR with other T2NRs acts as a complex regulatory node for gene expression. Mechanistic features of protein-protein interaction within this regulatory node and its effect on chromatin binding in live cells are yet to be explored. (B) Cartoon showing Halo-tagging scheme of RARa and RXRa along with western blots of U2OS wild-type (WT) and knock-in (KI) RARa (left) and RXRa (right) homozygous clones. (C) Fast single-molecule tracking (fSMT). Likelihood of diffusion coefficients based on model of Brownian diffusion with normally distributed localization error for H2B-Halo (black), Halo-NLS (gray), RARa clones (blue), and RXRa clones (red) with black lines on top of the figure illustrating bound and moving populations. Each line represents a nucleus. (D) Diffusive spectra, probability density function (top), and cumulative distribution function (CDF) (bottom) - with drawing illustrating bound states as heterodimers of RARa and RXRa bound to chromatin.
Figure 1—figure supplement 1.
Figure 1—figure supplement 1.. Verification of endogenous tagging and single-molecule tracking (SMT) analysis.
(A) Genotyping gels showing selected homozygously Halo-tagged (HT) RARα (c156, c239, and c258) and RXRα (C10, D6, and D9) clones. (B) Co-immunoprecipitation of overexpressed, HT RARα (left) and RXRα (right) in Cos7 cells. V5-tagged RXRα was immunoprecipitated and HT RARα was immunoblotted (left). HT RXRα was immunoprecipitated and Flag-tagged RARα was immunoblotted (right). (C) Luciferase assays showing retinoic acid responsive promoter activity of wild-type (WT) and HT RARα (top) and RXRα (bottom) clones in presence and absence of all-trans retinoic acid (atRA). (D) Confocal images of HT RARα (top) and RXRα (bottom) showing nuclear localization. (E) Subsampling knock-in (KI) RARα-Halo (blue, top) and Halo-RXRα (red, bottom) trajectories from fast SMT (fSMT) used to estimate fbound. Sampling (with replacement) was done by number of trajectories (100, 1000, 5000, 10,000, and 12,500) extracted from varying number of cells (11, 22, 33, and 44). For each sample size, 100 replicates were performed and plotted as box plot showing variation and cross (x) indicating the mean.
Figure 1—figure supplement 2.
Figure 1—figure supplement 2.. Full-length western blots of wild-type (WT) U2OS cells and homozygously Halo-tagged RARα and RXRα knock-in (KI) clones.
(A) RARα is detected in WT and KI clones using a specific antibody against RARα. RARα is also detected in KI clones using a specific antibody against Halo and Flag-tag. The lower part of the membrane was cut and blotted for Centrin2 as a loading control. (B) RXRα is detected in WT and KI clones using a specific antibody against a C-terminal epitope of RXRα. Since this antibody also recognizes other isoforms of RXR (~54 kDa), we validated RXRα expression by using an N-term epitope-specific antibody of RXRα. But this epitope sequence is disrupted by Halo-tagging at the N-terminal due to which it does not recognize HT-RXRα in KI clones. Our genotyping gels (Figure 1—figure supplement 1A) give a clean single band confirming homozygous tagging and Sanger sequencing confirmed correct tagging. RXRα is also detected in KI clones using a specific antibody against Halo and V5-tag which show a clean gel confirming correct Halo-tagged RXRα product. The lower part of the membrane was cut and blotted for Centrin2 as a loading control.
Figure 1—figure supplement 3.
Figure 1—figure supplement 3.. Diffusion behavior of endogenous RARα and RXRα with and without all-trans retinoic acid (atRA) treatment.
Diffusion spectra and cumulative distribution function of knock-in (KI) (Α) RARα-Halo and (B) Halo-RXRα in absence and presence of atRA. Cells were treated without or with 1 nm, and 100 nM atRA for 24 hr before single-molecule tracking (SMT) experiments. Dimethyl sulfoxide (DMSO) was added to cells without atRA treatment as a control. (C) Cellular abundance of KI RARα and RXRα with or without 24 hr treatment with atRA using flow cytometry analysis. Y-axis of bar plot shows number of Halo-tagged RARα and RXRα molecules. Error bars represent stdev of mean for three biological replicates.
Figure 1—figure supplement 4.
Figure 1—figure supplement 4.. Diffusion coefficient and frame cut-off analysis in single-molecule tracking (SMT) data.
(A) Bar plot showing fbound% of knock-in (KI) Halo-tagged (HT) RARα (c156) and RXRα (D6) calculated with cut-off of 0.1 (μm2/s) and 0.15 (μm2/s) diffusion coefficients. (B) Bar plot showing fbound% of KI HT RARα (c156) and RARα overexpressed (OE) calculated with cut-off of 0, 500, 1000, and 1500 frames. Error bars denote stdev of bootstrapping mean.
Figure 2.
Figure 2.. Chromatin binding of RARα and RXRα can be saturated and is limited by RARα.
(A) Schematic and western blot of stably integrated EF1α promoter-driven Halo-tagged (HT) RARα (left) and RXRα (right) overexpression in wild-type (WT) U2OS cells. (B) Bar plot; y-axis shows number of HT knock-in (KI) and overexpressed (OE) RARα (blue) and RXRα (red) molecules quantified using flow cytometry. (C) Bar plot; y-axis depicts chromatin-bound fraction (fbound%) of KI and OE RARα, RXRα compared to Halo-NLS (control). (D) Assay condition schematics to determine which of the partners in the RARα/RXRα heterodimer complex is limiting for chromatin binding; parental KI HT RARα or RXRα clones with OE SNAP (orange), SNAP-RXRα (brown), RARα-SNAP (light blue), and RARαRR-SNAP (pink) using stably integrated EF1α promoter-driven transgene. (E) Bar chart; y-axis denotes number of KI HT RARα and RXRα molecules (depicted as blue and red cartoon respectively with ‘H’ labeled star attached) in presence or absence of transgene products. Error bars denote stdev of the mean from three biological replicates. (F) Bar plot showing fbound% of KI HT RARα and RXRα in presence or absence of exogenously expressed SNAP proteins. Error bars for (B), (E) denote stdev of the mean from three biological replicates. Error bars for (C), (F) represent stdev of bootstrapping mean. p-Value≤0.001 (***), ≤0.01 (**), and ≤0.05 (*).
Figure 2—figure supplement 1.
Figure 2—figure supplement 1.. Cellular abundance and diffusion behavior of overexpressed Halo-tagged (HT) RARα and RXRα.
(A) Cellular abundance of HT knock-in (KI) versus overexpressed (OE) RARα and RXRα compared with standard Halo-CTCF cell line using flow cytometry analysis. X-axis shows TMR fluorescence intensity of HT molecules in U2OS cells. (B) Likelihood of diffusion coefficients for OE HT RARα and RXRα. Each line represents a nucleus. Diffusion spectra showing probability density function and cumulative distribution function for OE HT RARα and RXRα is shown underneath. (C) fbound% of KI and overexpressed HT RARα and RXRα extracted from single cells plotted against mean nuclear intensity of single cells. Each dot represents a data collected from a single nucleus.
Figure 2—figure supplement 2.
Figure 2—figure supplement 2.. Verification of mutant RARα (RARαRR) and exogenous SNAP-tagged protein expression.
(A) Rosetta modeled structure of the ligand binding domain (LBD) of RARα (pale blue) and RXRα (pale red) heterodimer (PDB code: 1DKF) with point mutation M379R and T382R. Original residues M379 and T382 are shown as cyan sticks and substituted residue arginine (R) is shown as pink sticks. Below the PDB structure is a schematic representation of M379R,T382R mutation in RARα (RARαRR) along with co-immunoprecipitation in Cos7 cells. V5-tagged RXRα was immunoprecipitated and RARαRR was immunoblotted. RARαRR disrupts heterodimerization with RXRα. (B) Cellular abundance of knock-in (KI) Halo-tagged (HT) RARα and RXRα in presence of overexpressed (OE) SNAP proteins using flow cytometry (FCM) analysis. FCM estimated fluorescence of TMR labeled HT RARα and RXRα molecules were compared with Halo-CTCF in U2OS along with unlabeled U2OS control. (C) Fluorescent gels and (D) western blots showing HT KI RARα and RXRα along with OE SNAP proteins in stably integrated conditions. U2OS cells were labeled with Halo ligand JFX549 (100 nM) and SNAP ligand SF650 (50 nM) before lysis.
Figure 2—figure supplement 3.
Figure 2—figure supplement 3.. Live-cell confocal images to verify protein expression.
(A) Confocal images of overexpressed (OE) Halo-tagged (HT) RARα and RXRα. Confocal images of U2OS cells expressing knock-in (KI) HT (B) RARα and (C) RXRα in presence of stably integrated OE SNAP proteins. HT molecules were labeled with 100 nM JFX549, and SNAP-tagged (ST) molecules were labeled with SF-650.
Figure 2—figure supplement 4.
Figure 2—figure supplement 4.. Fast single-molecule tracking (fSMT) of Halo-tagged (HT) RARα and RXRα with (w/) different transgene products.
(A) Likelihood diffusion coefficients and (B) diffusion spectra, probability density function (top), and cumulative distribution function (bottom) for knock-in (KI) HT RARα (left) and RXRα (right) in absence and presence of stably integrated overexpressed (OE) SNAP proteins. Each line in (A) represents a nucleus. fbound% reported shows chromatin binding of RXRα is limited by the availability of RARα but not vice versa. Cartoon above the spectra illustrates bound population as heterodimers of RARα and RXRα bound to chromatin.
Figure 2—figure supplement 5.
Figure 2—figure supplement 5.. Single-molecule tracking (SMT) analysis to verify change in fbound% with respect to mean intensity.
(A) fbound% of knock-in (KI) Halo-tagged (HT) RXRα in presence of overexpressed RARα-SNAP and RARαRR-SNAP extracted from single cells plotted against mean nuclear intensity of single cells. Each dot represents a data collected from a single nucleus.
Figure 3.
Figure 3.. Proximity-assisted photoactivation (PAPA)-single-molecule tracking (SMT) shows direct interaction between Halo-tagged (HT) knock-in (KI) and SNAP-tagged overexpressed RARα and RXRα in live cells.
(A) Schematic illustrates how PAPA signal is achieved. First, SNAP-tagged (ST) protein is labeled with ‘receiver’ fluorophore like JFX650 (star with letter ‘S’) and HT protein is labeled with ‘sender’ fluorophore like JFX549 (star with letter ‘H’). When activated by intense red light the receiver fluorophore goes into a dark state (gray star with S). Upon illumination by green light, the receiver and sender molecules distal to one another do not get photoactivated (red X) but receiver SNAP molecules proximal to the sender gets photoactivated (green ✓). Pulses of violet light can induce direct reactivation (DR) of receiver independent of interaction with the sender. PAPA experiments. (B) Plots showing PAPA versus DR reactivation. (C) Diffusion spectra of PAPA and DR trajectories obtained for ST proteins for the represented conditions; parental HT RARα KI cell, stably expressing RXRα-SNAP (brown, left panel), as well as parental HT RXRα KI cell stably expressing RARα-SNAP (light blue, middle panel) and RARαRR-SNAP (light pink, right panel). A linear increase in PAPA versus DR reactivation is seen for non-interacting SNAP controls and a sublinear increase is seen for interacting SNAP proteins. Respective colored lines show linear fits of the data (see residuals in Figure 3—figure supplement 1B). SNAP control data are re-plotted in middle and right panels. Cartoon inside diffusion spectra depicts if the expressed HT and ST proteins are expected to interact or not. fbound% errors represent stdev of bootstrapping mean.
Figure 3—figure supplement 1.
Figure 3—figure supplement 1.. Controls for proximity-assisted photoactivation (PAPA) experiments.
(A) Diffusion spectra of PAPA and direct reactivation (DR) trajectories obtained for SNAP proteins below each corresponding conditions presented as cartoons; the parental Halo-tagged (HT) RARα (left) and RXRα (right) knock-in (KI) cells stably expressing control SNAP protein (orange). Cartoon inside diffusion spectra depicts that the expressed Halo and SNAP proteins are not expected to interact. (B) Residuals of the linear fit for PAPA versus DR localizations for SNAP (orange) and SNAP-RXRα (brown) proteins in presence of HT RARα (left panel), as well as SNAP (orange), RARαRR-SNAP (light pink), and RARα-SNAP (light blue) proteins in presence of HT RXRα (right panel). Same SNAP control data are re-plotted in all plots shown in (B).
Figure 4.
Figure 4.. A model for RARa limited chromatin binding of RARa-RXRa heterodimers.
(A) Pool of RXRα (red) and RXR partners (RARα - blue, other Type II nuclear receptors [T2NRs] - yellow) along with some number of chromatin-bound RARα-RXRα heterodimers exist under normal conditions. (B) When the pool of free RXRα is increased, the number of chromatin-bound RARα-RXRα heterodimers does not change. (C) When the pool of RARα is increased, chromatin binding of RARα-RXRα heterodimers increases, until it reaches saturation. Note: For simplicity we have omitted to show heterodimerization of other T2NRs (yellow) with RXRα (red).

Update of

Similar articles

Cited by

References

    1. Amati B, Brooks MW, Levy N, Littlewood TD, Evan GI, Land H. Oncogenic activity of the c-Myc protein requires dimerization with Max. Cell. 1993;72:233–245. doi: 10.1016/0092-8674(93)90663-b. - DOI - PubMed
    1. Ayer DE, Kretzner L, Eisenman RN. Mad: a heterodimeric partner for max that antagonizes myc transcriptional activity. Cell. 1993;72:211–222. doi: 10.1016/0092-8674(93)90661-9. - DOI - PubMed
    1. Baudino TA, Cleveland JL. The Max network gone mad. Molecular and Cellular Biology. 2001;21:691–702. doi: 10.1128/MCB.21.3.691-702.2001. - DOI - PMC - PubMed
    1. Boka AP, Mukherjee A, Mir M. Single-molecule tracking technologies for quantifying the dynamics of gene regulation in cells, tissue and embryos. Development. 2021;148:dev199744. doi: 10.1242/dev.199744. - DOI - PubMed
    1. Bouchard C, Dittrich O, Kiermaier A, Dohmann K, Menkel A, Eilers M, Lüscher B. Regulation of cyclin D2 gene expression by the myc/max/mad network: myc-dependent TRRAP recruitment and histone acetylation at the cyclin D2 promoter. Genes & Development. 2001;15:2042–2047. doi: 10.1101/gad.907901. - DOI - PMC - PubMed

MeSH terms