. 2025 Jan 28;44(1):115165.
doi: 10.1016/j.celrep.2024.115165. Epub 2025 Jan 9.

The adiponectin-PPARγ axis in hepatic stellate cells regulates liver fibrosis

Affiliations

The adiponectin-PPARγ axis in hepatic stellate cells regulates liver fibrosis

Shangang Zhao et al. Cell Rep. .

Abstract

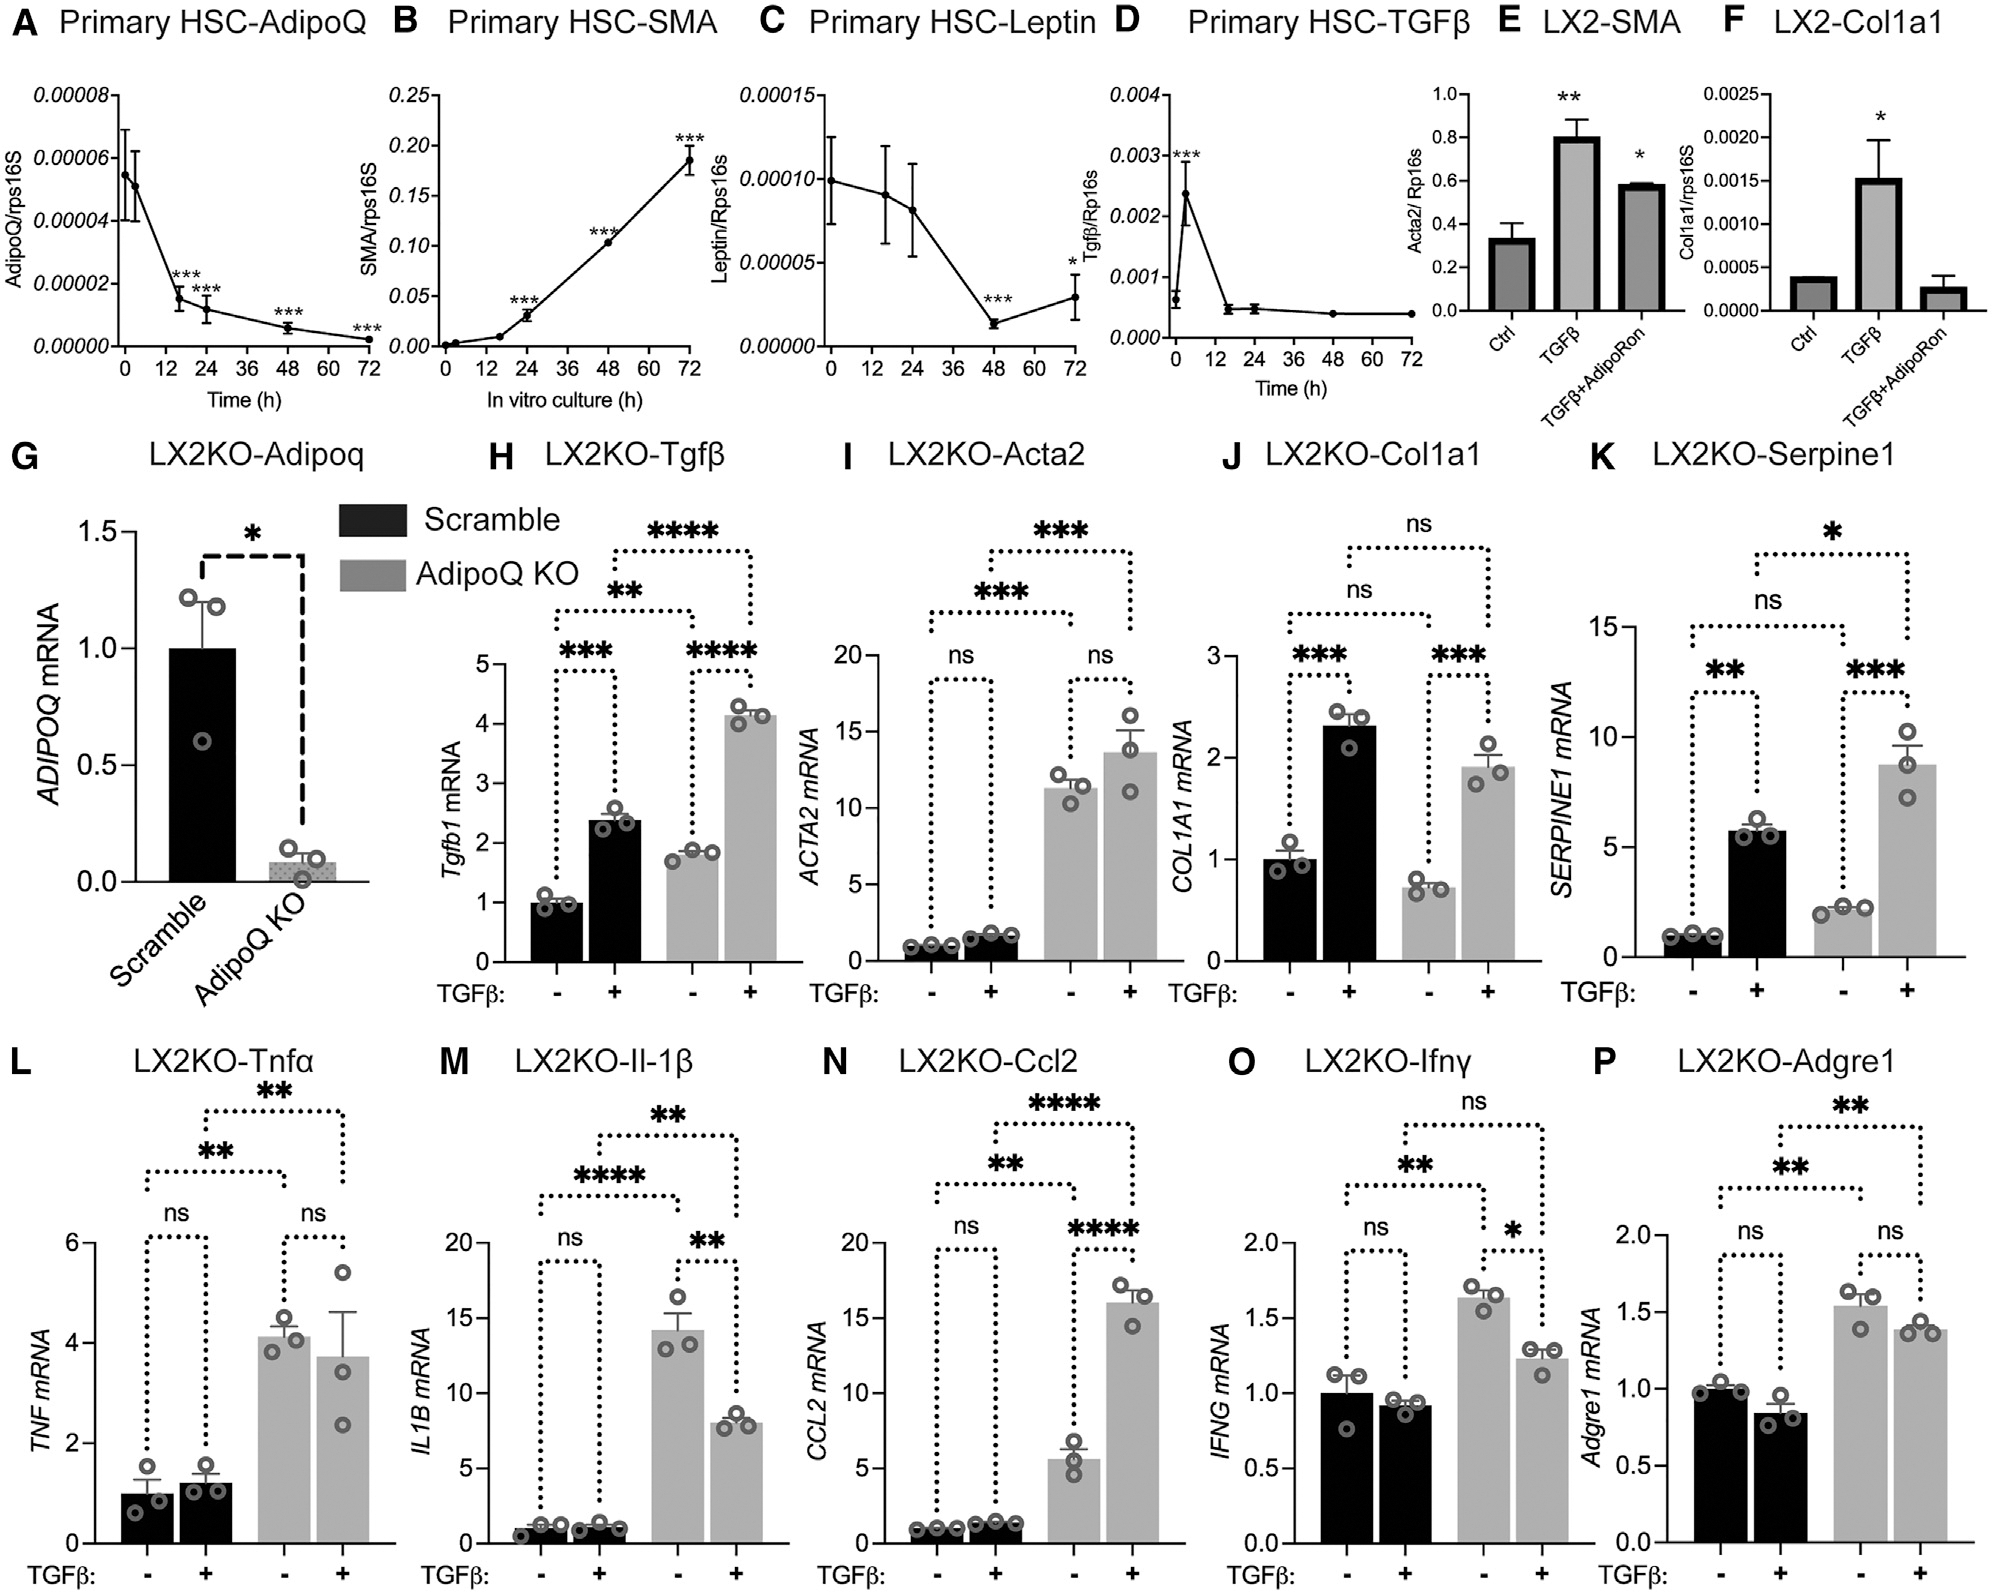
Hepatic stellate cells (HSCs) are key drivers of local fibrosis. Adiponectin, conventionally thought of as an adipokine, is also expressed in quiescent HSCs. However, the impact of its local expression on the progression of liver fibrosis remains unclear. We recently generated a transgenic mouse line (Lrat-rtTA) that expresses the doxycycline-responsive transcriptional activator rtTA under the control of the HSC-specific lecithin retinol acyltransferase (Lrat) promoter, which enables us to specifically and inducibly overexpress or eliminate genes in these cells. The inducible elimination of HSCs protects mice from methionine/choline-deficient (MCD) diet-induced liver fibrosis, confirming their causal involvement in fibrosis development. We generated HSC-specific adiponectin overexpression and null models that demonstrate that HSC-specific adiponectin overexpression dramatically reduces liver fibrosis, whereas HSC-specific adiponectin elimination accelerates fibrosis progression. We identify a local adiponectin-peroxisome proliferator-activated receptor gamma (PPARγ) axis in HSCs that exerts a marked influence on the progression of local fibrosis, independent of circulating adiponectin derived from adipocytes.

Keywords: CP: Metabolism; PPARγ; adiponectin; liver fibrosis; obesity.


Conflict of interest statement

Declaration of interests The authors declare no competing interests.

Figures

Figure 1.
Figure 1.. Adiponectin expression in HSCs is negatively associated with their activation
(A–D) Freshly isolated mouse HSCs were cultured for different times. mRNA expression of (A) adiponectin, (B) smooth muscle actin, (C) leptin, and (D) TGF-β (n = 3). (E and F) LX2 cells were starved in serum-free medium overnight and then treated with 20 ng/mL TGF-β and/or 5 μM AdipoRon for 24 h. mRNA expression of (E) smooth muscle actin and (F) COL1A1 (n = 3). (G–P) Ctrl and adiponectin knockout LX2 cell lines were treated in the presence and absence of TGF-β. (G) Expression of adiponectin was determined. Fibrotic markers, including (H) TGF-β, (I) Acta 2, (J) Col1a1, and (K) Serpine, and inflammation markers, including (L) TNFα, (M) IL-1β, (N) Ccl2, (O) Ifnγ, and (P) Adgre1, were measured. Data are displayed as mean ± SEM and analyzed by unpaired Student’s t test for all the figures: *p < 0.05, **p < 0.01, ***p < 0.001.
Figure 2.
Figure 2.. Overexpression of adiponectin in HSCs protects from thermoneutrality-induced liver fibrosis
(A–K) Control (Lrat-rtTA) and LAPNTG (Lrat-rtTA+TRE-Adipoq) mice were housed under thermoneutral conditions and fed HFD+DOX to induce liver fibrosis. (A) Experimental setup. (B) Adiponectin mRNA expression in HSCs after 2 weeks’ doxycycline. (C) Circulating adiponectin levels after 2 weeks’ doxycycline (n = 5). (D) Body weight development. (E) OGTT after 8 weeks (n = 5–8). (F–J) Liver mRNA expression of (F) Col1a1, (G) Col3a1, (H) Col4a4, (I) TGF-β, and (J) smooth muscle actin after 1 year under thermoneutral conditions. (K) Liver trichrome staining. Scale bar represents 100 μm. (L) Picrosirius red staining. Scale bar represents 100 μm. (M) Quantification of fibrotic area. (N–U) Control (MUP-uPA+Lrat-rTA) and MUPLAPNTG (MUP-uPA+Lrat-rtTA+TRE-Adipoq) mice were fed chow+DOX. (N) Experimental setup. (O–Q) Liver mRNA expression of (O) smooth muscle actin, (P) Col3a1, and (Q) Col4a4 after 20 weeks. (R) Liver trichrome staining after 20 weeks (n = 10). (S) Picrosirius red staining. (T) Quantification of fibrotic area. (U) Liver tumors after 20 weeks’ HFD plus Dox600 (n = 10). Data are displayed as mean ± SEM and analyzed by unpaired Student’s t test for all the figures: *p < 0.05, **p < 0.01, ***p < 0.001.
Figure 3.
Figure 3.. Deletion of adiponectin in HSCs exacerbates thermoneutrality-induced liver fibrosis
Control (Lrat-rtTA+Adipoq flox/flox) and LAPNKO (Lrat-rtTA+TRE-Cre+Adipoq flox/flox) mice were housed under thermoneutral conditions and fed either chow+DOX or HFD+DOX to induce liver fibrosis. (A) Experimental setup. (B–D) mRNA expression of (B) adiponectin in HSCs, (C) adiponectin in subcutaneous adipose tissue, and (D) leptin in subcutaneous adipose tissue after 10 weeks (n = 8). (E and F) Circulating levels of (E) adiponectin and (F) leptin after 10 weeks. (G) Body weight of chow+DOX-fed mice after 10 weeks (n = 8). (H) Body weight of HFD+DOX-fed mice after 20 weeks (n = 10). (I) OGTT of chow+DOX-fed mice after 8 weeks (n = 7–10). (J) OGTT of HFD+DOX-fed mice after 8 weeks (n = 10). (K–P) Liver mRNA expression of (K) smooth muscle actin, (L) Col1a1, (M) Col3a1, (N) Col4a4, (O) TGF-β, and (P) leptin expression in HFD+DOX-fed mice after 20 weeks (n = 10). (Q) Liver trichrome staining of HFD+DOX-fed mice after 20 weeks (n = 10). Scale bar represents 100 μm. (R) Picrosirius red staining. Scale bar represents 100 μm. (S) Quantification of fibrotic area. Data are displayed as mean ± SEM and analyzed by unpaired Student’s t test for all the panels: *p < 0.05, **p < 0.01, ***p < 0.001.
Figure 4.
Figure 4.. Overexpression of PPARγ in HSCs protects from CCl4-induced liver fibrosis
(A–C) Ctrl and LX2KO cells were cultured in the presence and absence of TGF-β. Quantification of (A) PPARγ2 and (B) TP53 and (C) MTT assay, to quantify cell proliferation, was performed. (D) HSC PPARγ2 mRNA expression in LAPNTG mice fed HFD+DOX600 for 10 weeks (n = 5). (E) HSC PPARγ2 mRNA expression in LAPNKO mice fed HFD+DOX600 for 10 weeks (n = 5). (F–K) Control (Lrat-rtTA) and LPPARG2 (Lrat-rtTA+TRE-PPARgγ2) mice were fed chow+DOX and then injected twice weekly with CCl4 for another 8 weeks to induce liver fibrosis. (F) Experimental setup. (G) Body weight before and after CCl4 injection. (H–K) Liver mRNA expression of (H) Col1a1, (I) Col3a1, (J) TGF-β, and (K) smooth muscle actin (n = 5). Data are displayed as mean ± SEM and analyzed by unpaired Student’s t test for all the panels, except (C), which was analyzed by two-way ANOVA: *p < 0.05, **p < 0.01, ***p < 0.001.

References

    1. Kisseleva T, and Brenner D (2021). Molecular and cellular mechanisms of liver fibrosis and its regression. Nat. Rev. Gastroenterol. Hepatol. 18, 151–166. 10.1038/s41575-020-00372-7. - DOI - PubMed
    1. Berumen J, Baglieri J, Kisseleva T, and Mekeel K (2021). Liver fibrosis: Pathophysiology and clinical implications. WIREs Mech. Dis. 13, e1499. 10.1002/wsbm.1499. - DOI - PMC - PubMed
    1. Scherer PE, Williams S, Fogliano M, Baldini G, and Lodish HF (1995). A novel serum protein similar to C1q, produced exclusively in adipocytes. J. Biol. Chem. 270, 26746–26749. 10.1074/jbc.270.45.26746. - DOI - PubMed
    1. Berg AH, Combs TP, Du X, Brownlee M, and Scherer PE (2001). The adipocyte-secreted protein Acrp30 enhances hepatic insulin action. Nat. Med. 7, 947–953. 10.1038/90992. - DOI - PubMed
    1. Zhao S, Kusminski CM, and Scherer PE (2021). Adiponectin, Leptin and Cardiovascular Disorders. Circ. Res. 128, 136–149. 10.1161/CIRCRESAHA.120.314458. - DOI - PMC - PubMed

Publication types

LinkOut - more resources