. 2025 Jan 10;11(2):eadq8114.
doi: 10.1126/sciadv.adq8114. Epub 2025 Jan 10.

Molecular dynamics at immune synapse lipid rafts influence the cytolytic behavior of CAR T cells

Affiliations

Molecular dynamics at immune synapse lipid rafts influence the cytolytic behavior of CAR T cells

Ahmed Z Gad et al. Sci Adv. .

Abstract

Chimeric antigen receptor T cells (CART) targeting CD19 through CD28.ζ signaling induce rapid lysis of leukemic blasts, contrasting with persistent tumor control exhibited by 4-1BB.ζ-CART. We reasoned that molecular dynamics at the CART immune synapse (CARIS) could explain differences in their tumor rejection kinetics. We observed that CD28.ζ-CART engaged in brief highly lethal CARIS and mastered serial killing, whereas 4-1BB.ζ-CART formed lengthy CARIS and relied on robust expansion and cooperative killing. We analyzed CARIS membrane lipid rafts (mLRs) and found that, upon tumor engagement, CD28.ζ-CAR molecules rapidly but transiently translocated into mLRs, mobilizing the microtubular organizing center and lytic granules to the CARIS. This enabled fast CART recovery and sensitivity to low target site density. In contrast, gradual accumulation of 4-1BB.ζ-CAR and LFA-1 molecules at mLRs built mechanically tonic CARIS mediating chronic Fas ligand-based killing. The differences in CD28.ζ- and 4-1BB.ζ-CARIS dynamics explain the distinct cytolytic behavior of CART and can guide engineering of more adaptive effective cellular products.


Figures
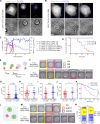
Fig. 1.
Fig. 1.. Dynamics of individual CAR T cell killing of target cells.
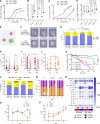
(A and B) Time-lapse microscopy of CD19-CARCD28ζ (A) and CD19-CAR4-1BBζ (B) T cells conjugated with Daoy.CD19 target cells. Time zero represents formation of a CAR and target cell conjugate. Green, emerald GFP CAR; blue, SYTOX viability dye (uptake indicates target cell death); silver, calcein AM viability dye (loss indicates target cell death). (C) Quantification of percent CAR at the CARIS in CD19-CARCD28ζ (red solid line) and CD19-CAR4-1BBζ (blue solid line) T cells and the corresponding %Calcein (red dashed line) and %SYTOX (black solid line) in target cells conjugated to CD19-CARCD28ζ and %Calcein in target cells conjugated to CD19-CAR4-1BBζ T cells (blue dashed line); mean + SEM. [(A) to (C)], n = 5. (D) Percentage survival for Daoy.CD19 conjugated to CD19-CARCD28ζ or CD19-CAR4-1BBζ T cells. n = 20. (E) Schematic representation for TIMING assay. HER2-CAR T cells (PKH26 Red cell membrane label); Raji.HER2 tumor cells (GFP tagged/PKH67 Green cell membrane label) at 1:1. Annexin V (blue) marker for tumor cell death. (F) Filmstrip for representative images of the TIMING assay at 1:1. Yellow box, initial contact; red box, target death; blue box, detachment. (G) Tseek; (H) Tdeath; and (I) Tcontact of all encounters. (J) Tcontact of cytolytic encounters. (K) Percentage of Raji.HER2 survival after contact with HER2-CAR T cells. n = 600. (L) Schematic of serial killing experiment. (M) Filmstrip for representative images of HER2-CAR T cells and Raji.HER2 at 1:2. Yellow box initial contact; red box, target cell death; black box, death of both target cells. (N) Percentage of CARIS that lead to 0, 1, or 2 target cell deaths at 1:2. One-way ANOVA of areas under the curve with Holm-Sidak corrected multiple comparisons (C), log-rank (Mantel-Cox) test [(D) and (K)], Student’s t test [(G) to (J)], or χ2 test (N). Representative of two to three donors [(A) to (D)] or data from two donors pooled [(F) to (N)]. *P < 0.05, ***P < 0.001,****P < 0.0001. (E) and (L) were created using Biorender.com.
Fig. 2.
Fig. 2.. CAR T cell expansion, phenotypic shift, and relationship to kinetics of target cell killing.
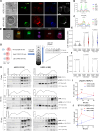
(A to D) T cell tracking synchronized with tumor cell tracking of CD19-CAR T cells versus Daoy.CD19 (A) and HER2-CAR T cells versus LN229 (C). Rate constant (ρcytotox) for CAR T cell fold expansion (foldx) in relation to their cytotoxicity for CD19-CAR T cells (B) and HER2-CAR T cells (D). Dot, technical replicate. (E and F) Schematic (E) and filmstrip (F) of the TIMING cooperative/additive killing experiment of HER2-CAR T cells and Raji.HER2 at 2:1. (G) Percentage of CARIS that lead to 0 or 1 target cell death (two HER2-CAR T cells made contact with one Raji.HER2), compared to the killing at 1:1. (H to K) TIMING: Tseek (H), Tcontact (I), and Tdeath (J) and percentage of Raji.HER2 survival after CAR T cell contact (K) in wells having CD4 versus CD8 of HER2-CAR T cells and Raji.HER2 at 1:1. n = 457. (L) Percentage of events that lead to 0, 1, or 2 target cell deaths in wells that have one CD4 or CD8 HER2-CAR T cell that contacted two tumor targets. (M to P) Flow cytometry for CD4/CD8 polarization of HER2-CAR T cells or NT (M) and fold change of cytokine secretion (MILLIPLEX) to NT done on the supernatant collected after 24 and 48 hours (N) and change in percentage of CM (O) and EM (P) for T cells (50/50 CD4:CD8) cocultured with LN229. One-way ANOVA [(B), (D), (H), (I), and (J)] or repeated measures (RM) two-way ANOVA [(M), (O), and (P)] with Holm-Sidak corrected multiple comparisons, χ2 test [(G) and (L)], or log-rank (Mantel-Cox) test (K). Representative of three to four donors [(A) and (C); single donor values depicted in (B) and (D), respectively], pooling of data from two donors [(E) to (L)], or the mean and SD for three donors [(M), (O), and (P)]. n.s. = not significant, *P < 0.05, **P < 0.01, ***P < 0.001, ****P < 0.0001. (E) was created using Biorender.com.
Fig. 3.
Fig. 3.. Association of CAR molecules with mLRs.
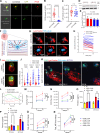
(A) Confocal microscopy of HER2-CAR T cell conjugates with the HER2-amplified breast cancer line, BT474, imaged for CARs [emerald GFP (green)], actin [phalloidin (red)], LAT (blue), and CTB (gray). Distribution of the fluorescence intensity on the membrane of (B) HER2-CARCD28ζ and (C) HER2-CAR4-1BBζ T cells conjugates in arbitrary units (a.u.). n = 7. The distance signifies the start to the end of the arrow drawn around CAR T cells in the bright-field images in (A). (D to F) ImageStream flow cytometry for NT and HER2-CAR T cells conjugated with LN229. Nuclei (DAPI), CARs (emerald GFP), actin (phalloidin), LAT, and CTB. Fluorescence intensity of (E) LAT and (F) CTB in immature (non-actin–enriched) versus mature (actin-enriched) CARIS. N = 3; n = 23,565. (G) Schematic representation for isolation of detergent-resistant membranes using detergent iodixanol (OptiPrep) density gradient of CAR T cells (baseline) and CAR T cell tumor cell conjugates, followed by probing fractions for lipid raft (LAT) and nonlipid raft (CD71) markers on WB. Created using Biorender.com. (H) WB for membrane fractions from HER2-CAR T cells at baseline (0 min) and in conjugation with LN229 at early (15 min) and late (60 min) CARIS. Probes are for CAR (CD3ζ), phosphorylated CARs (pY142 CD3ζ), LAT (lipid raft marker), and transferrin receptor [CD71, nonlipid raft (non-LR) marker]. Curves show the cholesterol concentration within each fraction. Mwt, molecular weight. (I and J) Percentage of CAR molecules recruited to the lipid raft fractions of HER2-CAR T cells against LN229 (I) or BT474 (J). Data from three donors pooled [(E) ad (F)], representative of three donors (H), or mean of three donors + SD [(I) ad (J)]. Conditions compared using the Mann-Whitney U test with Holm corrected multiple comparisons [(E) and (F)] or RM two-way ANOVA with Holm-Sidak corrected multiple comparisons [(I) and (J)]. **P < 0.01.
Fig. 4.
Fig. 4.. Expression dynamics of adhesion molecules on CAR T cells and the effect on CARIS avidity.
(A) Hypothetical schematic of mechanisms of LFA-1 activation. (B to D) Flow cytometry for CD11a (B) and CD18 (C) expression on HER2-CAR T cells at baseline and for aLFA-1 (D) in response to plate bound recombinant HER2, using an LFA-1 extended-open conformation-specific antibody (m24). MFI, mean fluorescence intensity. (E) WB for membrane fractions from HER2-CAR T cells at baseline (0 min) and in conjugation with LN229 (15 and 60 min) probed for CAR (CD3ζ), LFA-1 (CD18), LAT, and CD71. (F) Percentage LFA-1 (CD18) recruited to the LR fractions from (E). (G) ImageStream flow cytometry for HER2-CAR T cells conjugated with LN229 (30 min). CARs (emerald GFP), actin (phalloidin), nuclei (DAPI), and aLFA-1 (m24). (H to J) Fluorescence intensity of activated aLFA-1 (H) and its correlation with actin intensity (I) or CAR intensity (J) at the CARIS of mature synapses. N = 3; n = 9007. (K and L) Flow cytometry for ICAM-1 expression at baseline on CD4 and CD8 (K) and product (L) of HER2-CAR T cells. (M) Schematic representation of z-Movi acoustic force microscopy for testing CARIS avidity. A force ramp of 0 to 1000 pN was applied to pull HER2-CAR T cells off an LN229 monolayer toward acoustic nodes. (N) z-Movi ultrasound microscopy measuring the percentage of HER2-CAR T cells bound to LN229 at 500 pN after 2, 5, 20, or 40 min of incubation. (O) Detachment forces for individual cells after 5 or 40 min of incubation. Median represents the force needed to detach 50% of CAR T cells (EF50). Mean of three donors + SD [(B) to (D), (F), (K), and (L)], data pooled from three donors [(H) to (J)] or three to five avidity runs [(N) and (O)] compared using one-way [(B), (C), and (O)] or RM two-way Holm-Sidak corrected ANOVA [(D) and (N), ratio paired t test (F), Mann-Whitney U test (H), or Spearman correlation (non-Gaussian distribution) [(I) and (J)]. *P < 0.05, **P < 0.01, ****P < 0.0001. (A) and (M) created using Biorender.com.
Fig. 5.
Fig. 5.. Killing mechanisms deployed by CAR T cells upon tumor cell engagement.
(A) Z-projection confocal microscopy of CD19-CAR T cells conjugated with Daoy.CD19 (20 min), CAR [emerald GFP (green)], and PKCθ (red) and transmitted light (TL). (B and C) Quantitation of (B) PKCθ and (C) CAR accumulated at CARIS. n = 48. (D and E) WB for total PKCθ in CD19-CAR T cells at baseline and after 20 min of recombinant CD19 stimulation (D), quantified in (E). (F) Schematic representation for lytic granule convergence to the MTOC and MTOC polarization to CARIS. Created using Biorender.com. (G) Time-lapse imaging of CD19-CAR T cells seeded on CD19 Fc + anti-CD18–coated glass, probed for lytic granules (LysoTracker) and MTOC (SiR-tubulin). (H) Change in the mean distance between lytic granules and the MTOC per cell of CD19-CARCD28ζ (red line) and CD19-CAR4-1BBζ (blue line) T cells. n = 32. (I) ImageStream for HER2-CAR T cells + LN229 (30 min). CARs [emerald GFP (green)], actin [phalloidin (red)], and MTOC [pericentrin (blue)]. (J) Distance between MTOC and CARIS. n = 360. Dot, conjugate [(B), (C), and (J)]. (K and L) Time-lapse tracking of distance of lytic granule centroid (LysoTracker) and MTOC (SiR-tubulin) from CARIS of CD19-CARCD28ζ T cells + Daoy.CD19 (K) and SYTOX (target cell death); quantification of the percentage of CAR.emeraldGFP at CARIS (green), MTOC distance to CARIS (turquoise), and lytic granule centroid distance to CARIS (red) (L). Mean + SEM. n = 15. (M and N) CD107a flow cytometry on HER2-CAR (M) and CD19-CAR (N) T cells cocultured with LN229 and Daoy.CD19, respectively. (O and P) Supernatant of HER2-CAR T cells + LN299 (O) and CD19-CAR T cells + Daoy.CD19 (P) tested for perforin using ELISA. (Q and R) FasL flow cytometry on HER2-CAR (Q) and CD19-CAR (R) T cells cocultured with LN229 and Daoy.CD19, respectively. Student’s t test [(B) and (C)], RM two-way ANOVA [(H), (M), (N), (Q), and (R)], or one-way ANOVA [(J), (O) and (P)], with Holm-Sidak corrected multiple comparisons. n.s. = not significant, *P < 0.05, **P < 0.01, ***P < 0.001, ****P < 0.0001.

References

    1. Dagher O. K., Schwab R. D., Brookens S. K., Posey A. D. Jr., Advances in cancer immunotherapies. Cell 186, 1814–1814.e1 (2023). - PubMed
    1. Saez-Ibañez A. R., Upadhaya S., Partridge T., Shah M., Correa D., Campbell J., Landscape of cancer cell therapies: Trends and real-world data. Nat. Rev. Drug Discov. 21, 631–632 (2022). - PubMed
    1. Upadhaya S., Yu J. X., Shah M., Correa D., Partridge T., Campbell J., The clinical pipeline for cancer cell therapies. Nat. Rev. Drug Discov. 20, 503–504 (2021). - PubMed
    1. Cappell K. M., Kochenderfer J. N., A comparison of chimeric antigen receptors containing CD28 versus 4-1BB costimulatory domains. Nat. Rev. Clin. Oncol. 18, 715–727 (2021). - PubMed
    1. Lee D. W., Kochenderfer J. N., Stetler-Stevenson M., Cui Y. K., Delbrook C., Feldman S. A., Fry T. J., Orentas R., Sabatino M., Shah N. N., Steinberg S. M., Stroncek D., Tschernia N., Yuan C., Zhang H., Zhang L., Rosenberg S. A., Wayne A. S., Mackall C. L., T cells expressing CD19 chimeric antigen receptors for acute lymphoblastic leukaemia in children and young adults: A phase 1 dose-escalation trial. Lancet 385, 517–528 (2015). - PMC - PubMed

MeSH terms

Substances