. 2025 Jan 10;11(2):eadq6652.
doi: 10.1126/sciadv.adq6652. Epub 2025 Jan 10.

Chromatin conformation, gene transcription, and nucleosome remodeling as an emergent system

Affiliations

Chromatin conformation, gene transcription, and nucleosome remodeling as an emergent system

Luay M Almassalha et al. Sci Adv. .

Abstract

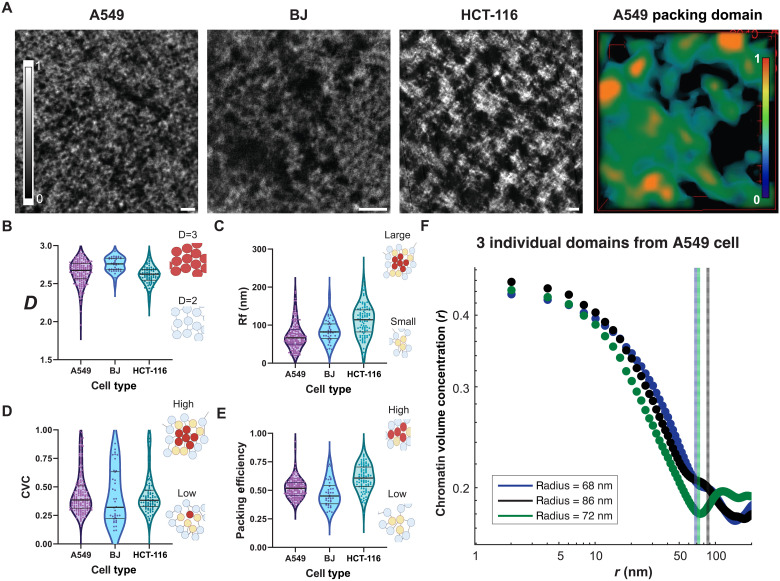
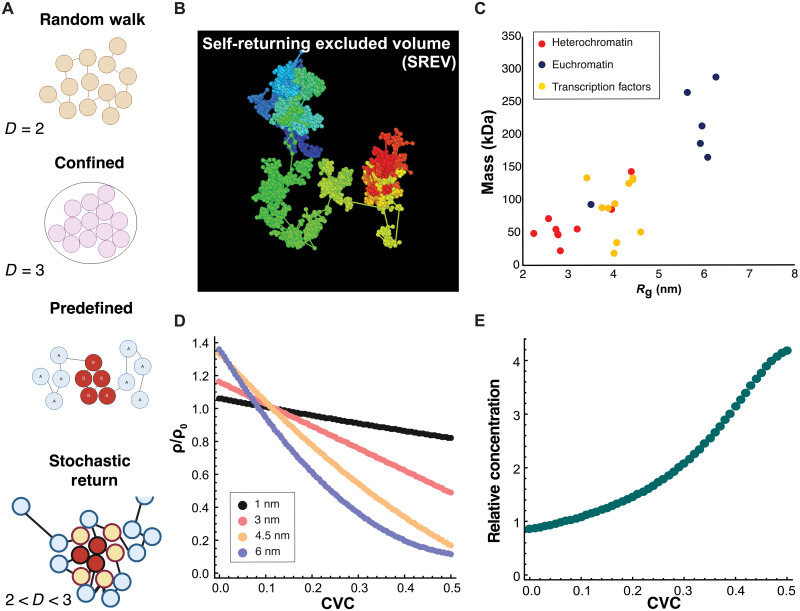
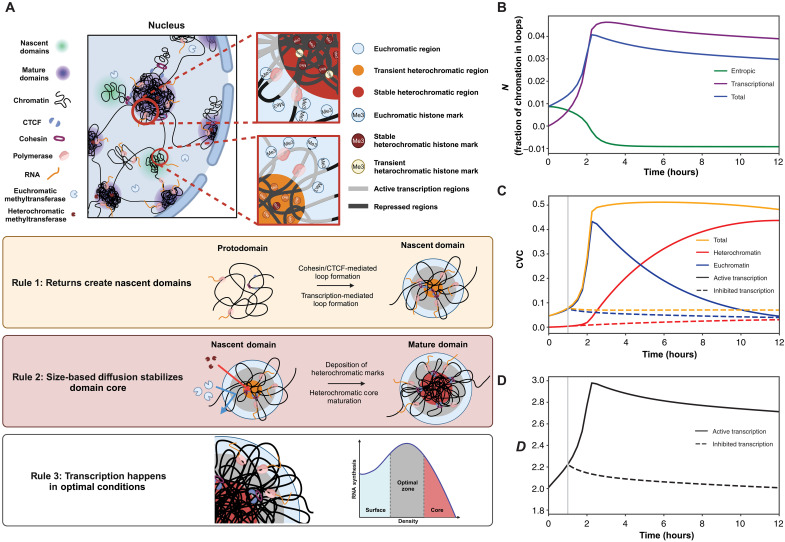
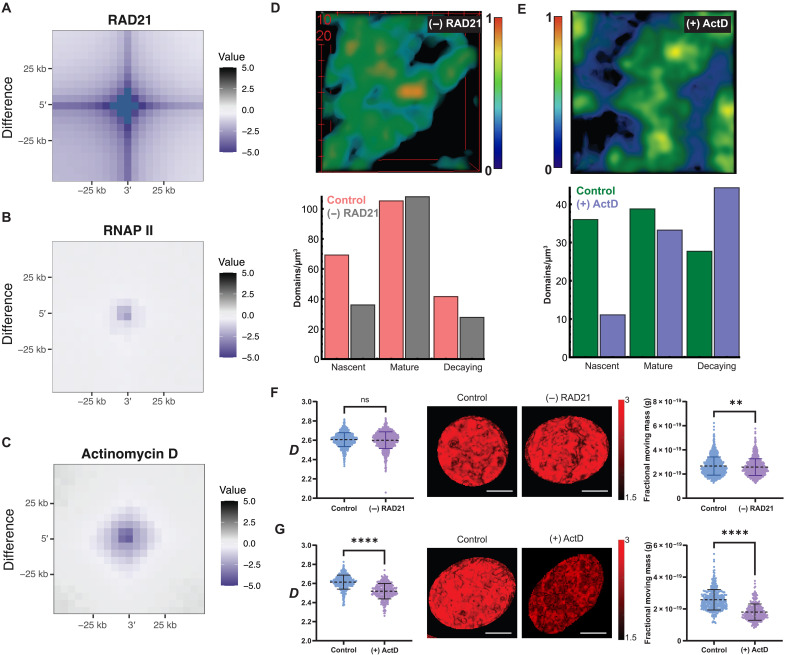
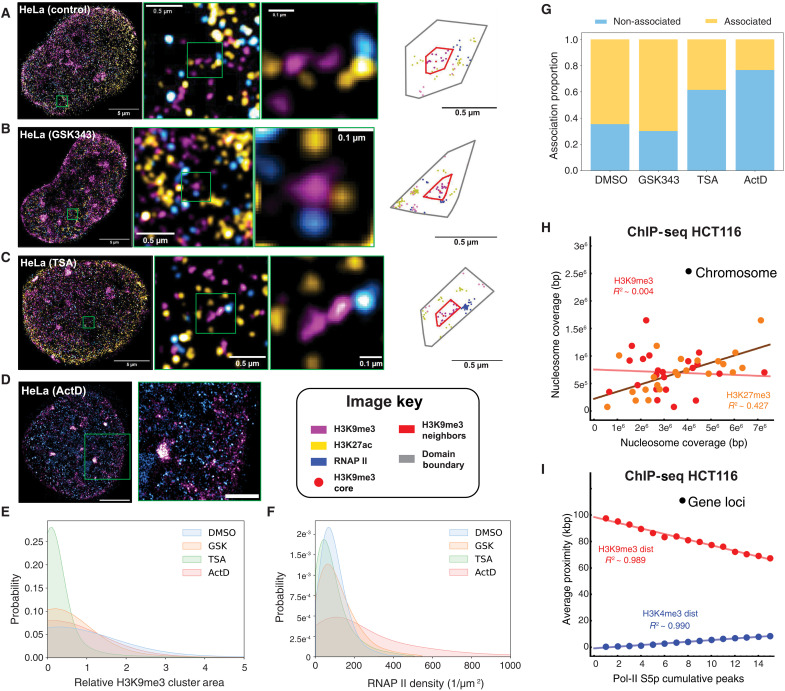
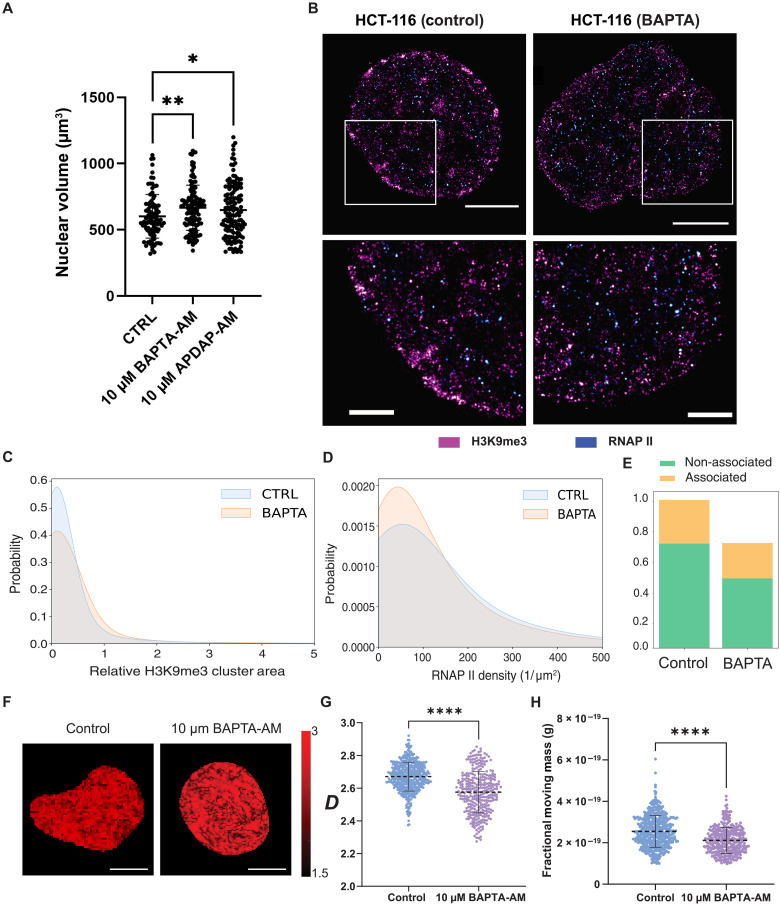
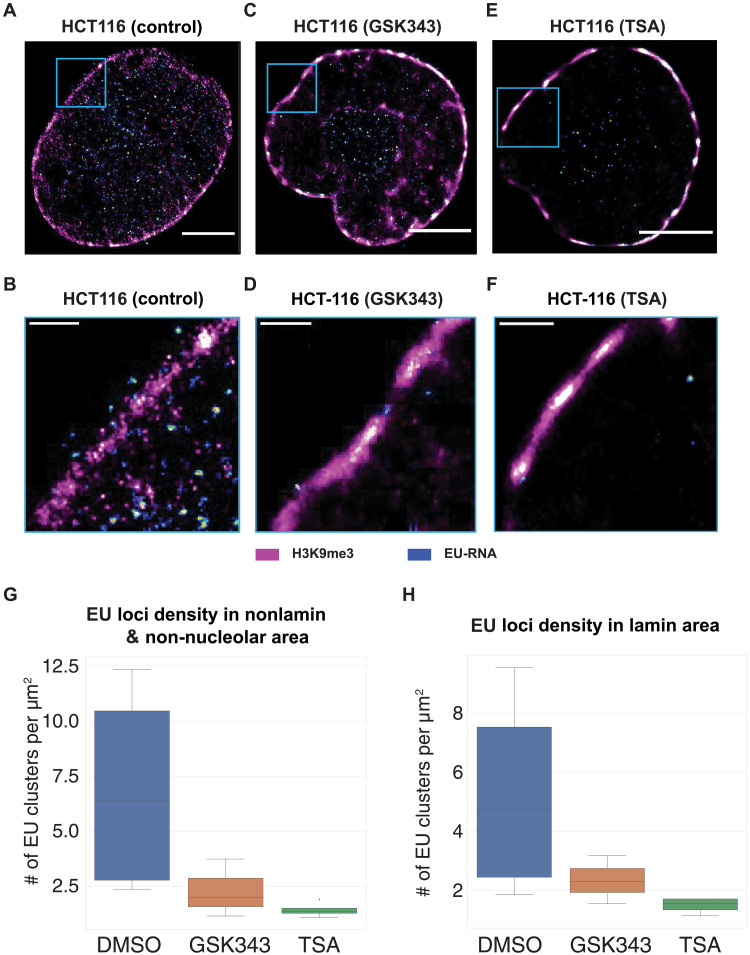
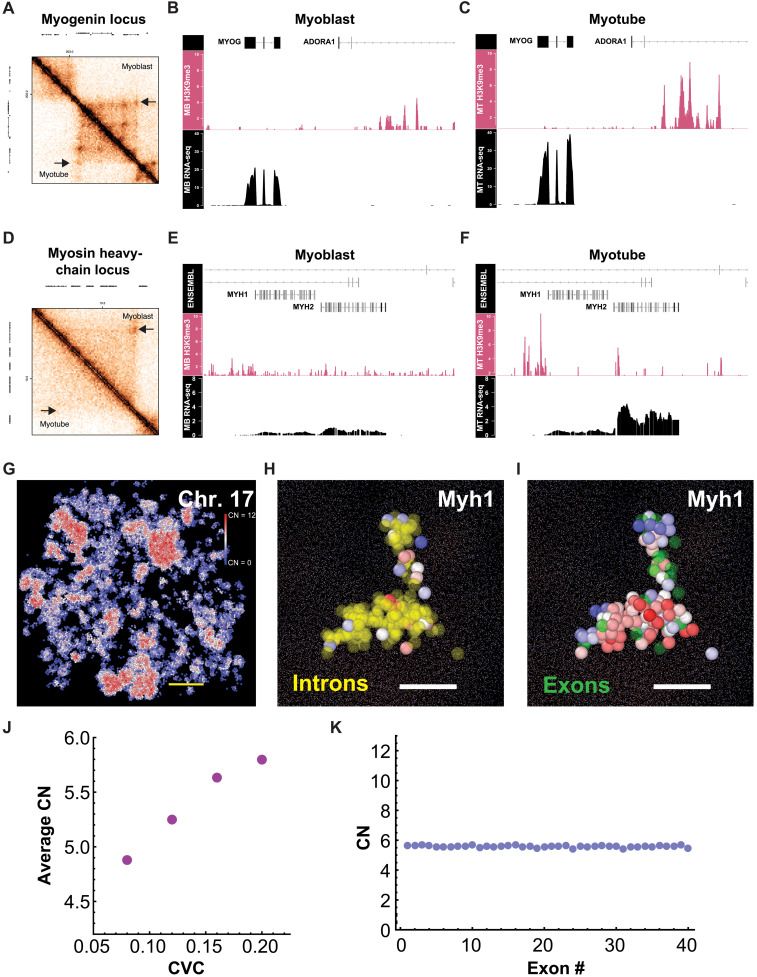
In single cells, variably sized nanoscale chromatin structures are observed, but it is unknown whether these form a cohesive framework that regulates RNA transcription. Here, we demonstrate that the human genome is an emergent, self-assembling, reinforcement learning system. Conformationally defined heterogeneous, nanoscopic packing domains form by the interplay of transcription, nucleosome remodeling, and loop extrusion. We show that packing domains are not topologically associated domains. Instead, packing domains exist across a structure-function life cycle that couples heterochromatin and transcription in situ, explaining how heterochromatin enzyme inhibition can produce a paradoxical decrease in transcription by destabilizing domain cores. Applied to development and aging, we show the pairing of heterochromatin and transcription at myogenic genes that could be disrupted by nuclear swelling. In sum, packing domains represent a foundation to explore the interactions of chromatin and transcription at the single-cell level in human health.


Figures

Fig. 1.
Fig. 1.. PDs are the predominant supra-nucleosome structure independent of the cell line.
(A) High-resolution mean projection from ChromSTEM in A549, BJ, and HCT-116 cells with a representative domain tomogram from the A549 cell. Scale bars, 200 nm. Domain size, 200 nm by 200 nm. (B to E) Analysis of structural properties of domains for these distinct cell types demonstrates heterogeneity of domain structures by cell type. (B) Scaling of chromatin packing ranges between two and three in all cell types. (C) Domain radius typically range from 50 to 200 nm between all cell lines. (D) Variations in CVC within domains are observed. (E) Quantification of chromatin packing efficiency. (F) Representative spatial distribution of density from domain interiors toward their periphery demonstrates a conserved, power-law geometry with a decay to the average nuclear density at the periphery. Domain boundary for blue (68 nm), black (86 nm), and green (72 nm).
Fig. 2.
Fig. 2.. Stochastic returns and excluded volume influence domain interactions with remodeling enzymes.
(A) Schematic representation of modeling frameworks in chromatin. A random walk and a confined random walk are cases of nucleosomes with fixed distances. In both cases, the produced structure results in a limiting case of chromatin domains with a D = 2 (random walk) and D = 3 (confined random walk or fractal globule). Forced attractions can produce more complex structures, but the discrete partitions result in two separated structures (low density, A; high density, B states). Stochastically forced returns that depend on the distance between the nucleosomes produce corrugated, mass-fractal structures that resemble ChromSTEM-resolved domains. These have a continuous decrease in density from high-density cores (red) to intermediate conditions (yellow) and lastly to outer zones (blue) before transition to interdomain space. (B) Representative chromosome fragment from SR-EV demonstrating the formation of chromatin PDs due to the intersection of stochastic return events and the excluded volume of monomers (nucleosomes). (C) The molecular mass in kilodaltons versus the radius of gyration, Rg, in nanometers predicted from AlphaFold configurations organized by enzyme function (red, heterochromatin; yellow, transcription factors; blue, euchromatin). Euchromatin enzymes have a radius that is approximately twice the size of heterochromatin enzymes, P < 0.001. (D) Simulated protein penetration relative to the average penetration as a function of size demonstrating preferential localization of larger enzymes to low-density regions (CVC < 0.1) and small molecules minimally affected by higher CVC. (Black, 1-nm radius, small molecule. Red, 3-nm radius, heterochromatin protein. Yellow, 4.5-nm radius, transcription factors. Blue, 6-nm radius, euchromatin protein). (E) Molecule size results in differential localization as a function of domain CVC in SR-EV configurations with increased relative concentration of smaller molecules to domain interiors (3-nm heterochromatin versus 6-nm euchromatin enzyme is shown).
Fig. 3.
Fig. 3.. A phenomenological model of domain self-assembly.
(A) Visual schematic of domain structures within the nucleus demonstrating their intersection with RNA polymerase, cohesin, and nucleosome modifiers. Nascent domains and mature domains represent temporally evolving processes due to the intersection of nucleosome remodeling with return/loop-mediating processes. Proposed three-rule framework for domain assembly, stabilization, and function. Rule 1. The process of returns creates local density variations resulting in nascent domain formation. Rule 2. The excluded volume properties of domains and nucleosome remodeling enzymes result in preferential localization of heterochromatin remodeling enzymes to the interior of domains. Rule 3. Transcription depends nonmonotonically on local crowding and requires optimal zone configurations to accelerate. CTCF, CCCTC-binding factor. (B) Model predictions of the effect of transcriptional activation on the total number of observed loops (blue), entropic loops (green), and polymerase-mediated loops (purple) over time after transcriptional initiation. The negative frequency of entropic loops denotes the loss of entropically mediated loops over time as transcriptionally mediated loops and total loops increase. (C) Model predictions of the change in CVC overtime following initiation of transcriptional reactions at 1 hour with resulting accumulation of heterochromatin within the domain interior. Inhibition of transcription results in the converse phenotype with the decrease in density and loss of heterochromatin formation. (D) Consequence of transcriptional activity on polymer scaling, D, within domains after initiation at 1 hour demonstrating the maturation of domain structures with transcriptional activation (D 2.2 ➔ 2.8).
Fig. 4.
Fig. 4.. Nascent domains are formed from transcriptionally mediate or cohesin-generated returns.
(A to C) Analysis of native loop domains upon depletion of RAD21 (A), depletion of RNA polymerase II (B), and transcription inhibition with 4-μm ActD (C) demonstrating the loss of loop anchors with these perturbations. RAD21 and Pol-II depletion was achieved by 5-Ph-IAA treatment over 6 hours. (D and E) Representative PDs (200 nm by 200 nm) from RAD21-depleted cells (D) and 4-μm ActD-treated cells (E) showing porous structure and high-density cores are maintained in mature domains. Cross-sectional analysis of domains by size and packing efficiency demonstrates a disproportionate loss of low efficiency, small domains with inhibition of transcription and RAD21 depletion. (F) Live-cell PWS nanoscopy in RAD21-depleted HCT-116 cells at 4 hours demonstrating no impact on average chromatin scaling, D, and a decrease in fractional moving mass (FMM), consistent with impaired domain formation but retention of overall higher-order structure. (G) Live-cell PWS nanoscopy of ActD-treated BJ fibroblast cells demonstrating a decrease in D and a decrease in FMM consistent with the increase in decaying domains (large, low packing efficiency) and impaired domain formation. ns, not significant. **P < 0.01, ****P < 0.0001.
Fig. 5.
Fig. 5.. Domains spatially couple heterochromatin, euchromatin, and active RNA polymerase.
(A) Multiplex SMLM demonstrating the spatial localization of heterochromatin (H3K9me3, magenta), euchromatin (H3k27ac, yellow), and active RNA polymerase II [serine-2 phosphorylated (Pol2-PS2), blue]. This shows the complex spatial organization of chromatin into unified domain structures with heterochromatin cores (red) supporting Pol2-PS2 within an ideal functional zone (gray). (B to D) Multiplexed SMLM demonstrating the impact of inhibition of EZH2 (GSK343), HDACs (TSA), and transcription (ActD) on domain structure. Although mature domain structures remain, the disruption of transcription results in loss of H3K9me3 cores and their dissociation from active RNA polymerase. TSA-mediated HDAC inhibition results in a loss of heterochromatin and euchromatin marks with the most pronounced decrease observed in the nuclear interior. (E) Quantification of H3K9me3 core size upon HDAC inhibition, EZH2 inhibition, and transcriptional inhibition demonstrating a decrease in core size in all conditions imaged in HeLa cells above. (F) Quantification of Pol2-PS2 distribution upon HDAC inhibition, EZH2 inhibition, and transcriptional inhibition demonstrating a decrease in total Pol2-PS2 upon disruption of heterochromatin formation in HeLa cells above. (G) Quantification of the frequency of Pol2-PS2 observed near a surrounding H3K9me3 core in the above conditions. At the baseline, ~60% of Pol2-PS2 in HeLa cells is spatially associated with domains, and this is lost both with HDAC inhibition and disruption of transcription by ActD. (H) Analysis from ChIP-seq of the correlation between chromosome wide (a global measure) of heterochromatin markers with Pol2 serine-5 phosphorylated (Pol2-Ps5) isoform (initiated transcription). (I) Linear proximity analysis of constitutive heterochromatin (H3K9me3) and euchromatin (H3K4me3) as a function of Pol2-Ps5 density on gene bodies. Findings are consistent with H3K27me3 associating with nascent domains and H3K9me3 with mature domains. In contrast, H3K4me3 distance increases as a function of Pol2-Ps5 density likely due to localization in the outer zone.
Fig. 6.
Fig. 6.. Divalent ion chelation results in domain collapse.
(A) Nuclear volume increases with chelation via BAPTA (calcium) and APDAP (magnesium) within 1 hour. (B) Representative multiplexed SMLM with Pol2-PS2 (blue) and H3K9me3 (magenta) in HCT-116 cells with and without chelation of divalent ions (calcium and magnesium) via BAPTA treatment at 1 hour. (C) Quantification of divalent chelation on H3K9me3 domains demonstrating a global loss of domain interiors. (D and E) Quantification of Pol2-PS2 demonstrating an increase in dissociation upon chelation. (F to H) Live-cell PWS nanoscopy of BAPTA-treated HCT-116 cells at 1 hour demonstrating a decrease in D (G) and a decrease in FMM (H) consistent with domain collapse and inhibition of domain formation. *P < 0.05, **P < 0.01, and ****P < 0.0001.
Fig. 7.
Fig. 7.. Inhibition of heterochromatin enzymes paradoxically suppresses transcription in situ due to impairment of ideal conditions.
(A to F) Representative multiplexed SMLM of nascent RNA measured by EU synthesis (blue) and H3K9me3 (magenta) in HCT-116 in controls compared to inhibition of EZH2 (B) and HDACs (C) demonstrating the profound loss of synthesis with inhibition of heterochromatin enzymes. (G and H) Quantification of the effect of heterochromatin enzyme suppression on RNA synthesis throughout the nucleus in comparison to adjacent to the nuclear border demonstrating loss of transcription independent of the nuclear region in HCT-116 cells. Note that the average CVC in HCT-116 cells is ~0.2 to 0.35 on ChromSTEM above, indicating that these cells are near optimal physiochemical conditions at the baseline. HDAC inhibition and EZH2 inhibition can still increase local transcription for initially high-density regions and globally in cell lines with a higher initial CVC (>0.35).
Fig. 8.
Fig. 8.. Domain assembly occurs during myogenic differentiation and depends on CVC.
(A to C) Transformation of the myogenic regulator, Myog, chromatin loci during development demonstrating the loss of loops (rule 1) with accompanying increase in heterochromatin adjacent to the gene body (rule 2) and acceleration of transcription (rule 3). (D to F) Transformation of the fast-twitch myosin heavy chains (Myh 1 and Myh2) chromatin loci during myoblast differentiation with loss of adjacent loop (rule 1) with accompanying increase in heterochromatin adjacent to the gene body (rule 2) and amplified transcription (rule 3) of structural myogenic proteins. (G) Representative configuration from SR-EV of chromosome 17 (scale bar, 200 nm) with color coding representing the coordination number (CN) representing the number of nucleosomes in contact. A CN of less than 5 represents an outer zone density configuration, 6 to 7 optimal transcriptional configuration, and greater than 7 representing an interior configuration. (H) Generated configuration from SR-EV of Myh1 representing quantified CN of exon segments with introns color coded in yellow (scale bar, 40 nm). Exon segments are frequently in the outer zone or ideal configurations. (I) Configuration from (H) with quantified CN of intron segments with exons color coded in green (scale bar, 40 nm). Inverse to exons, intronic elements are frequently found in domain interior configurations. (J) Average CN as a function of CVC with lower densities shifting toward outer zone configurations. (K) Average CN of Myh1 exons per nucleosome as a function of the exon segment at a CVC of 0.16 consistent with localization of coding elements into ideal transcriptional densities depending highly on CVC. RNA-seq, RNA sequencing; MB, myoblasts; MT, myotubes.

Similar articles

Cited by

References

    1. Shin Y., Brangwynne C. P., Liquid phase condensation in cell physiology and disease. Science 357, eaaf4382 (2017). - PubMed
    1. Husmann D., Gozani O., Histone lysine methyltransferases in biology and disease. Nat. Struct. Mol. Biol. 26, 880–889 (2019). - PMC - PubMed
    1. Nakayama J. I., Hayakawa T., Physiological roles of class I HDAC complex and histone demethylase. J. Biomed. Biotechnol. 2011, 129383 (2011). - PMC - PubMed
    1. Arnould C., Rocher V., Saur F., Bader A. S., Muzzopappa F., Collins S., Lesage E., Le Bozec B., Puget N., Clouaire T., Mangeat T., Mourad R., Ahituv N., Noordermeer D., Erdel F., Bushell M., Marnef A., Legube G., Chromatin compartmentalization regulates the response to DNA damage. Nature 623, 183–192 (2023). - PMC - PubMed
    1. Finn E. H., Misteli T., Molecular basis and biological function of variability in spatial genome organization. Science 365, eaaw9498 (2019). - PMC - PubMed

LinkOut - more resources