. 2025 Jan 10;11(2):eadh1167.
doi: 10.1126/sciadv.adh1167. Epub 2025 Jan 10.

Ultrasensitive detection of intact SARS-CoV-2 particles in complex biofluids using microfluidic affinity capture

Affiliations

Ultrasensitive detection of intact SARS-CoV-2 particles in complex biofluids using microfluidic affinity capture

Daniel C Rabe et al. Sci Adv. .

Abstract

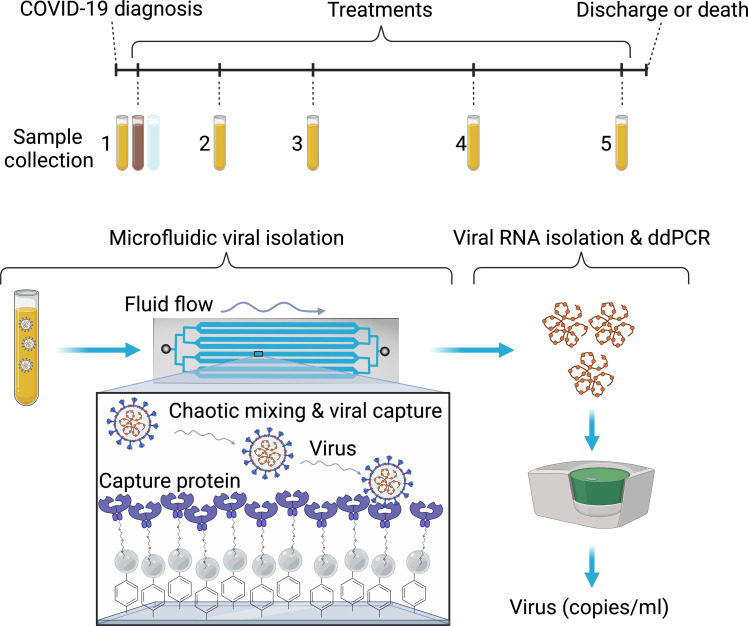
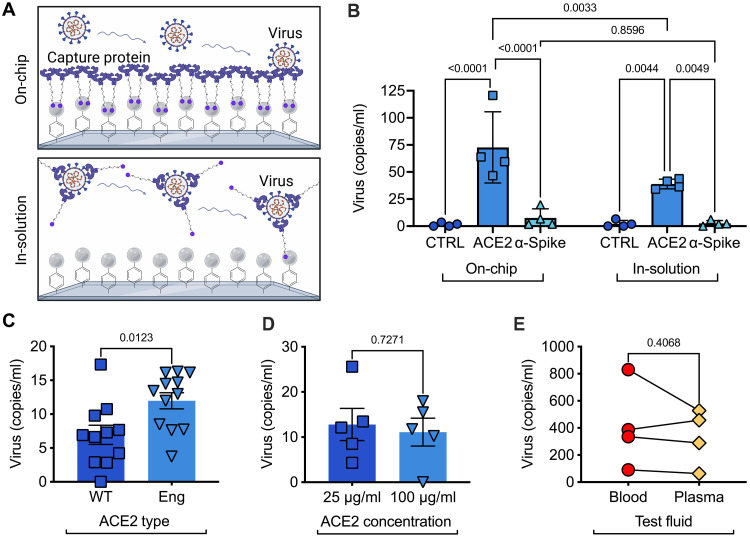
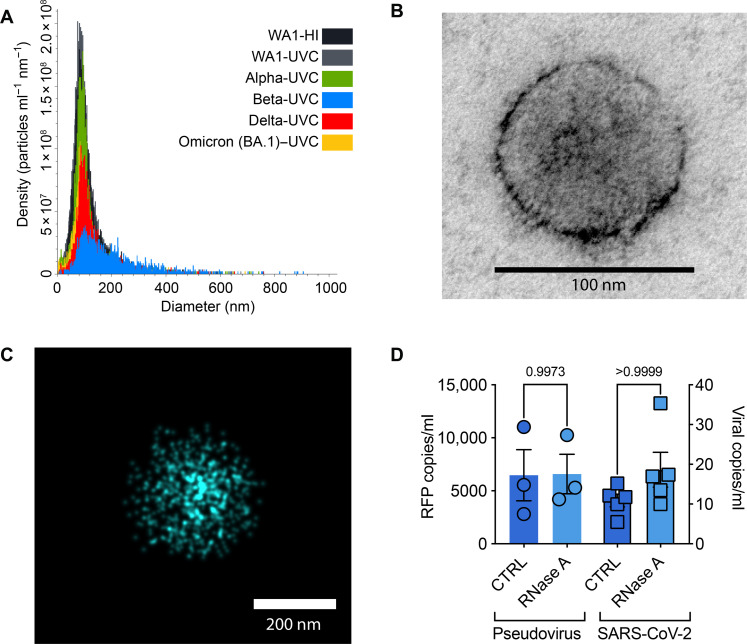
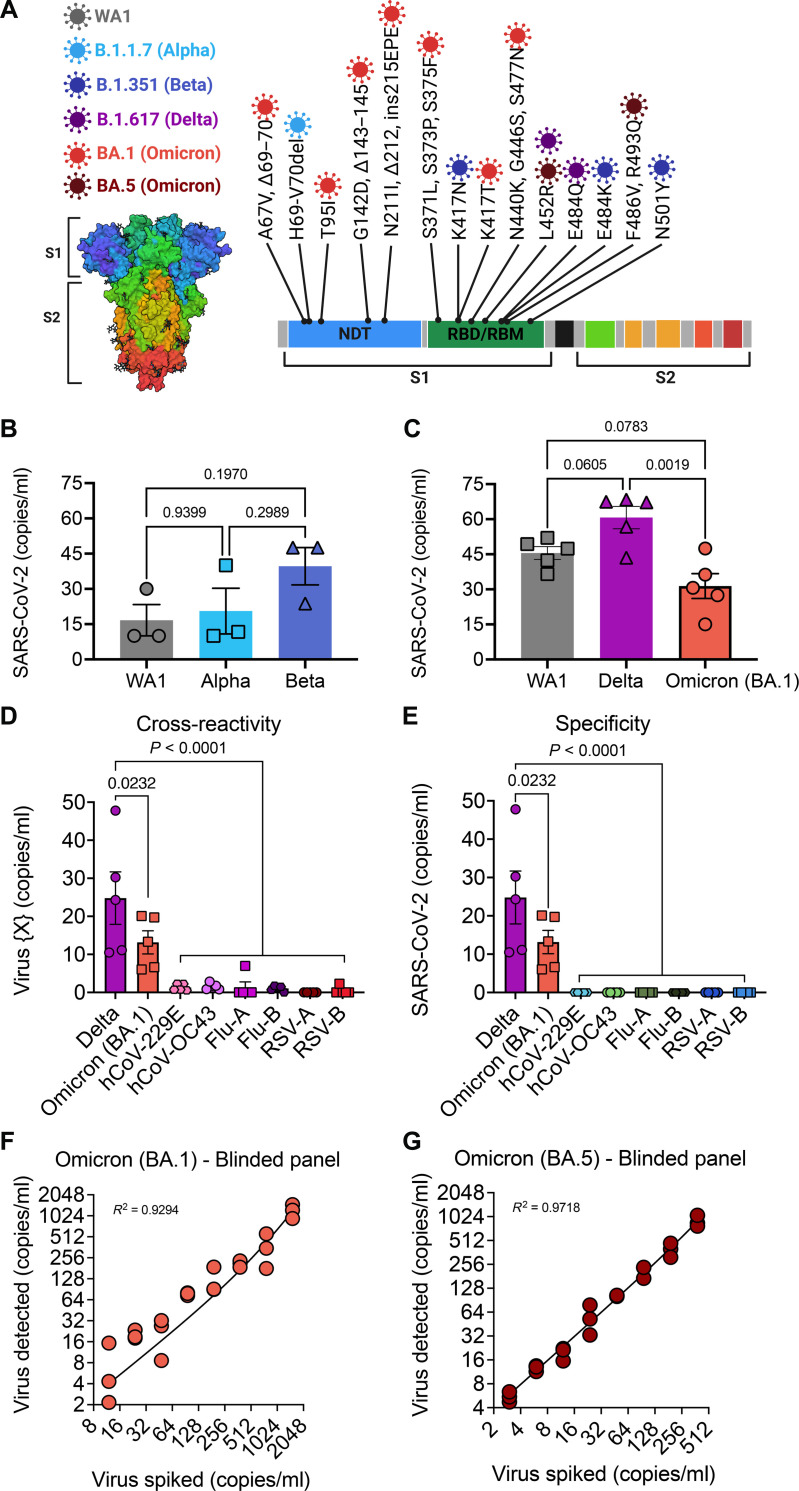
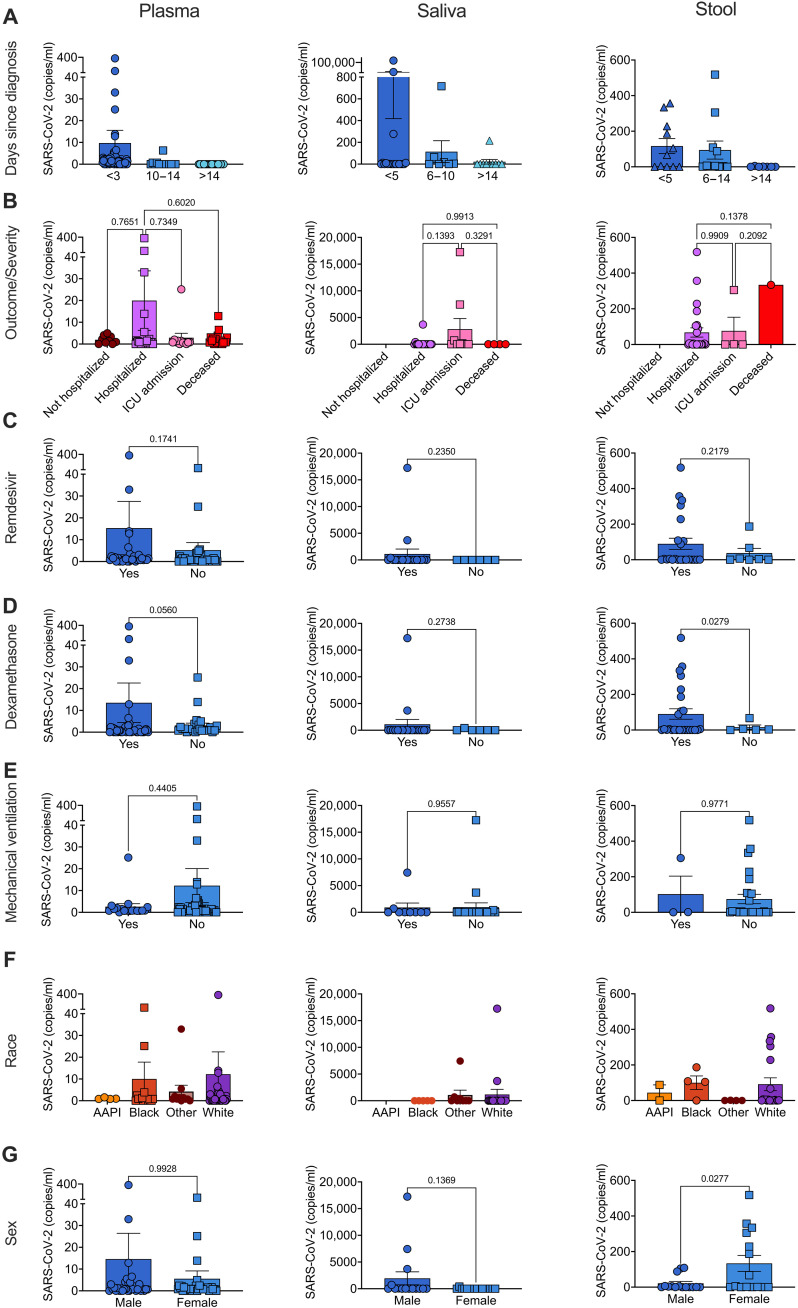
Measuring virus in biofluids is complicated by confounding biomolecules coisolated with viral nucleic acids. To address this, we developed an affinity-based microfluidic device for specific capture of intact severe acute respiratory syndrome coronavirus 2 (SARS-CoV-2). Our approach used an engineered angiotensin-converting enzyme 2 to capture intact virus from plasma and other complex biofluids. Our device leverages a staggered herringbone pattern, nanoparticle surface coating, and processing conditions to achieve detection of as few as 3 viral copies per milliliter. We further validated our microfluidic assay on 103 plasma, 36 saliva, and 29 stool samples collected from unique patients with COVID-19, showing SARS-CoV-2 detection in 72% of plasma samples. Longitudinal monitoring in the plasma revealed our device's capacity for ultrasensitive detection of active viral infections over time. Our technology can be adapted to target other viruses using relevant cell entry molecules for affinity capture. This versatility underscores the potential for widespread application in viral load monitoring and disease management.


Figures

Fig. 1.
Fig. 1.. Clinical workflow and viral detection using the virusHB-Chip.
(Top) Schematic describing clinical specimen collection and timing from patients with COVID-19 after diagnosis and during treatments. We obtained individual plasma samples from 103 patients, stool from 29, and saliva from 36. We obtained serial plasma samples from 10 patients during treatment. (Bottom) Schematic describing microfluidic isolation of virus from patient plasma using the virusHB-Chip, followed by viral RNA isolation from the chip, and subsequent viral copies per milliliter calculated using droplet digital (ddPCR). Created using BioRender.com.
Fig. 2.
Fig. 2.. Microfluidic capture of virus using the virusHB-Chip.
(A) Schematic describing chaotic mixing of fluid as it flows across the staggered herringbone pattern of the HB-Chip. ACE2 functionalized to the surface captures SARS-CoV-2 spike protein as the fluid flows across the surface. Created using BioRender.com. (B to E) SARS-CoV-2 was diluted and spiked into healthy donor plasma or blood (E). Viral RNA was detected using ddPCR. (B) SARS-CoV-2 was captured on the virusHB-Chip using either a nonspecific IgG (CTRL, dark blue circles), ACE2WT (light blue squares), or an anti-spike protein antibody (aqua triangles). Capture molecules are added to the device before use (left) or incubated with the sample before being added to the device (right). (C) Capture of SARS-CoV-2 using recombinant ACE2WT (dark blue squares) or ACE2ENG (Eng ACE2, light blue triangles). (D) Capture of SARS-CoV-2 using a solution of 25 μg/ml (dark blue squares) or 100 μg/ml of ACE2ENG (light blue triangles) added to the chip before capture. (E) Capture of virus from blood (red circles) or from a volume corrected amount of plasma (plasma-colored diamonds) using the virusHB-Chip with ACE2ENG.
Fig. 3.
Fig. 3.. Capture of intact virus by the virusHB-Chip.
(A to C) Inactivated SARS-CoV-2 in solution was subjected to NTA (A), TEM (B), and dSTORM (C) to determine its biophysical characteristics before further analysis. (A) Density of viral particles and diameter of different strains of heat-inactivated (HI) or UV-C–inactivated (UVC) SARS-CoV-2 determined by NTA. (B) Representative TEM image captured of inactivated SARS-CoV-2 (Delta variant, UV-C inactivated). (C) Representative image captured of inactivated SARS-CoV-2 (Delta variant, UVC inactivated) captured on the ONI EV-profiler chip using ACE2ENG, stained with anti-spike antibody, and imaged using dSTORM with a TIRF illumination angle using the Nanoimager from Oxford Nanoimaging (ONI). (D) Either SARS-CoV-2 spike protein pseudotyped virus (Pseudovirus) or SARS-CoV-2 (Delta variant, UV-C inactivated) was captured on the virusHB-Chip and detected by ddPCR. Before RNA extraction, captured virus [Pseudovirus, circles (left); SARS-CoV-2, squares (right)] were subjected to either PBS (CTRL, dark blue) or RNase A (light blue) for 30 min at 37°C. P values were calculated using a t test.
Fig. 4.
Fig. 4.. Specificity and sensitivity of the virusHB-Chip.
(A) Left: A diagram of SARS-CoV-2 spike protein is shown for PDB file (6VXX). Different domains of the protein are color coded corresponding to the domains shown in a linear sequence to the right. Right: Diagram of mutations of interest in the spike protein of different variants of SARS-CoV-2. Mutations are color coded for each of the major variants of interest. Created using BioRender.com. (B and C) Similar amounts of virus were spiked into healthy donor plasma separately for each variant. WA1 (gray circles), Alpha variant (aqua squares), Beta variant (light blue triangles), Delta variant (fuchsia triangles), or Omicron BA.1 variant (orange circles) were detected by ddPCR after being captured on the virusHB chip. (D and E) Delta or Omicron (BA.1) variants of SARS-CoV-2 or hCoV-229E, hCoV-OC43, Flu-A, Flu-B, RSV-A, or RSV-B were separately spiked into healthy donor plasma. Detected viral copies were normalized for amount loaded. (D) SARS-CoV-2 detection was measured by ddPCR for all samples. (E) Detection of other respiratory viruses bound to the virusHB-Chip was measured using viral specific primers and probes for each different virus. P values were calculated using a one-way analysis of variance (ANOVA) with correction for multiple testing. (F) Copies of Omicron (BA.1) detected are graphed on the y axis versus spiked copies calculated from a blinded dilution series created by the RADx-rad Discoveries and Data Coordinating Center (DCC) on the x axis (N = 3 per dilution). (G) Copies of Omicron (BA.5) detected are graphed on the y axis versus spiked copies calculated from a blinded dilution series created by the DCC on the x axis (N = 3 per dilution).
Fig. 5.
Fig. 5.. Detection of SARS-CoV-2 in patients with COVID-19 using the virusHB-Chip.
Absolute copies per milliliter of SARS-CoV-2 detected in plasma of patients with COVID-19 (left column, N = 103), saliva (middle column, N = 36), and stool (right column, N = 29) showing differences in levels based on (A) days since diagnosis, (B) outcome/severity, (C) remdesivir treatment, (D) dexamethasone treatment, (E) mechanical ventilation, (F) race, or (G) sex. AAPI, Asian American Pacific Islander.
Fig. 6.
Fig. 6.. Serial monitoring of SARS-CoV-2 in plasma.
(A to F) SARS-CoV-2 copies per milliliter were detected using the virusHB-Chip in plasma samples collected over the course of treatment. Patients that survived are designated by black circles (A to C, left) and patients that are deceased by red boxes (D to F, right). Conditions and treatments are designated by date using colored lines or by arrows for treatments or conditions lasting only 1 day. ECMO, extracorporeal membrane oxygenation; copies/ml, copies per milliliter.

Similar articles

Cited by

References

    1. Yuan B., Liu H.-Q., Yang Z.-R., Chen Y.-X., Liu Z.-Y., Zhang K., Wang C., Li W.-X., An Y.-W., Wang J.-C., Song S., Recurrence of positive SARS-CoV-2 viral RNA in recovered COVID-19 patients during medical isolation observation. Sci. Rep. 10, 11887 (2020). - PMC - PubMed
    1. Landi F., Carfì A., Benvenuto F., Brandi V., Ciciarello F., Lo Monaco M. R., Martone A. M., Napolitano C., Pagano F., Paglionico A., Petricca L., Rocchi S., Rota E., Salerno A., Tritto M., Gremese E., Bernabei R., Gemelli Against COVID-19 Post-Acute Care Team , Gemelli Against COVID-19 Post-Acute Care Team. Predictive factors for a new positive nasopharyngeal swab among patients recovered from COVID-19. Am. J. Prev. Med. 60, 13–19 (2021). - PMC - PubMed
    1. Piralla A., Ricchi M., Cusi M. G., Prati P., Vicari N., Scarsi G., Gandolfo C., Anichini G., Terrosi C., Percivalle E., Vecchio Nepita E., Bergami F., Tallarita M., Di Martino R., Ferrari A., Rovida F., Lunghi G., Schiavo R., Baldanti F., Residual SARS-CoV-2 RNA in nasal swabs of convalescent COVID-19 patients: Is prolonged quarantine always justified? Int. J. Infect. Dis. 102, 299–302 (2021). - PMC - PubMed
    1. Koskinen A., Tolvi M., Jauhiainen M., Kekäläinen E., Laulajainen-Hongisto A., Lamminmäki S., Complications of COVID-19 nasopharyngeal swab test. JAMA Otolaryngol. Head Neck Surg. 147, 672 (2021). - PMC - PubMed
    1. Landi F., Gremese E., Rota E., Carfi’ A., Benvenuto F., Ciciarello F., Monaco M. R. L., Martone A. M., Pagano F., Paglionico A., Petricca L., Rocchi S., Tritto M., Sanguinetti M., Bernabei R., Gemelli Against COVID-19 Post-Acute Care Team , Positive RT-PCR nasopharyngeal swab in patients recovered from COVID-19 disease: When does quarantine really end? J. Infect. 81, e1–e3 (2020). - PMC - PubMed

Substances