. 2025 Mar;12(9):e2409729.
doi: 10.1002/advs.202409729. Epub 2025 Jan 10.

Exceptional Uptake, Limited Protein Expression: Liver Macrophages Lost in Translation of Synthetic mRNA

Affiliations

Exceptional Uptake, Limited Protein Expression: Liver Macrophages Lost in Translation of Synthetic mRNA

Cheng Lin et al. Adv Sci (Weinh). 2025 Mar.

Abstract

Most gene therapies exert their actions via manipulation of hepatocytes (parenchymal cells) and the reasons behind the suboptimal performance of synthetic mRNA in non-parenchymal cells (NPC) such as Kupffer cells (KC), and liver macrophages, remain unclear. Here, the spatio-temporal distribution of mRNA encoding enhanced green fluorescent protein (Egfp), siRNA, or both co-encapsulated into lipid nanoparticles (LNP) in the liver in vivo using real-time intravital imaging is investigated. Although both KC and hepatocytes demonstrate comparable high and rapid uptake of mRNA-LNP and siRNA-LNP in vivo, the translation of Egfp mRNA occurs exclusively in hepatocytes during intravital imaging. Despite attempts such as inhibiting intracellular ribonuclease, substituting uridine bases in mRNA with pseudouridine, and using a different ionizable lipid in the LNP mixture, no substantial increase in Egfp translation by NPC is possible. The investigation reveals that hepatocytes, which are distinct from other liver cells due to their polyploidy, exhibit significantly elevated levels of total RNA and protein, along with a higher proportion of ribosomal protein per individual cell. Consequently, fundamental cellular differences account for the low mRNA translation observed in NPC. The findings therefore suggest that cellular biology imposes a natural limitation on synthetic mRNA translation that is strongly influenced by cellular ploidy.

Keywords: hepatocytes; lipid nanoparticles; non‐parenchymal cells; ploidy; synthetic mRNA.


Conflict of interest statement

The authors declare no conflict of interest.

Figures

Figure 1
Figure 1
Translation of Egfp mRNA by liver cells in vivo. A) Experimental setup of the in vivo experiment. B) Intravital microscopy of liver 16 h after the injection of DMSO control and 16 h after the injection of DMSO and 2 mg k−1g Egfp mRNA‐LNP (LNP1) into C57BL6J wild type mice. C) Intravital microscopy done as in panel B, but with additional in vivo staining of F4/80.
Figure 2
Figure 2
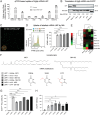
Uptake and translation of Egfp mRNA‐LNP by different cell types. A) Various different cell types were left untreated or were incubated with LNP1 and the uptake was assessed using quantitative Realtime‐PCR (expressed as parts per million, ppm of total RNA). B) EGFP protein translation by different cell types determined via immunoblot. C) Confocal micrograph of LNP2 (AF488‐labelled mRNA). D) Uptake of AF488‐labelled Egfp mRNA by macrophages assessed by flow cytometry after different time‐points. E) qPCR‐based analysis of the gene expression of selected ribonucleases on different cell types. F) Ionizable lipids and key types of modified Egfp mRNA in which the uridine base of unmodified mRNA was replaced with 5moU or m1Ψ used to generate LNP formulations. G) Hela cells were transfected with 1 µg mL−1 Egfp mRNA‐LNP for 24 h and then subjected to flow cytometry and compared to H) human primary macrophage with 1 µg mL−1 Egfp mRNA‐LNP. Data represent mean of n = 3 ± SD; *p < 0.05, **p < 0.01, ***p < 0.001, **** p < 0.0001 (One‐way ANOVA).
Figure 3
Figure 3
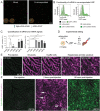
Uptake and excretion of LNP containing labeled RNA by liver cells. A) Visualization of LNP by confocal microscopy. B) Uptake of LNP containing labeled siRNA (LNP8:AF647; LNP9: AF594; LNP10: 2×594; LNP11: unlabelled; see Tables 2 and 3 for details) by human primary macrophages in vitro determined by flow cytometry (details on LNP are shown in Tables 2 and 3). C) Setup of the in vivo IVM experiment which covers 120 min after LNP injection. D) Rhodamine‐staining of HC followed by injection of LNP8 imaged by IVM at the indicated time points. E) Enlarged view of panel D and a zoom‐in on the KC with yellow arrows pointing at KC. F) Staining of hepatocytes using Rhodamin 123 as in panel D and anti‐F4/80 antibody staining of KC.
Figure 4
Figure 4
In vivo validation of mRNA‐siRNA LNP co‐encapsulation. LNP with siRNA or mRNA were either generated separately and mixed at equal volumes or co‐encapsulated at a ratio of 1:1 (mRNA:siRNA). A) Confocal imaging of mRNA‐siRNA co‐encapsulation into LNP: left side: AF488‐labelled Egfp mRNA‐LNP mixed with AF647‐siRNA‐LNP, right side co‐encapsulated. B) Flow cytometric analysis of the EGFP signals observed from human macrophages transfected with co‐encapsulated Egfp mRNA‐LNP on day 6 for 24 h and C) quantifications thereof. D) Intravital microscopy (IVM) setup, p.i.: post‐injection E). Selected time‐points of IVM with Egfp mRNA co‐encapsulated with AF647‐siRNA into LNP for the first 2 h and F) 16 h post intravenous injection. White arrows point at KC that internalized LNP and appear purple. Data represent mean of n = 3 ± SD; *p < 0.05, **p < 0.01, ***p < 0.001 (One‐way ANOVA).
Figure 5
Figure 5
Translation of synthetic mRNA by non‐parenchymal liver cells in vivo. A) Experimental scheme of murine liver cell isolation after LNP‐treatment with co‐encapsulated mRNA (2 mg k−1g) and control siRNA (1 mg k−1g), in total 3 mg k−1g body weight. B) After initial isolation of HC by centrifugation, hepatic LSEC, MOMF, and KC were isolated by a Nycodenz gradient and flow cytometric cell sorting. C) Representative flow cytometric plots from isolation of LSECs and hepatic macrophages, modal Y‐axis settings. D) Cell type‐specific quantification of EGFP signal by mean fluorescence intensity (MFI). Data represent the mean of n = 6 ± SD; ***p < 0.001 (One‐way ANOVA).
Figure 6
Figure 6
LNP‐induced transcriptomic changes in hepatocytes and Kupffer cells in vivo. Total RNA was purified from HC and Kupffer cells treated as described in Figure 5 followed by RNA sequencing. A) VENN diagram for up‐ and B) downregulated genes of HC and KC. C) Mean counts of the 200 most up and downregulated genes of KC and HC as a measure of LNP effect. D) Hepatocyte‐specific genes unaffected by LNP, E) genes induced, and F) down‐regulated by LNP in HC. G) KC‐specific genes, H) genes up‐regulated and (I) down‐regulated in KC by LNP. Data represent mean of n = 6–12 ± SD; *p < 0.05, **p < 0.01, ***p < 0.001, ****p < 0.0001 (One‐way ANOVA).
Figure 7
Figure 7
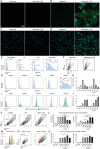
Protein translation and ploidy analysis of primary hepatocytes and Kupffer cells. Primary murine HC and KC were incubated with 1 µg mL−1 Egfp mRNA‐LNP for 24 h and analyzed by confocal microscopy or flow cytometry. A) Cultures of untreated KC (left) and treated with LNP1 (bar accounts for items A‐D), B) HC treated and recorded as in A, using identical image processing. C) KC as treated in A with additional staining of nuclei, D) nuclei staining of HC treated as in B, recorded as in C. E) Analysis of ploidy of selected cell types by nuclei staining. F) Hepatocyte subsets assigned based on granularity and size from untreated controls or after 24 h of treatment with Egfp‐mRNA‐LNP. G) Measurement of DNA content by DAPI staining in the subsets defined in F (left panel), and H) quantifications of the cell numbers in the respective subsets. I) Comparison of the EGFP signals in untreated and transfected HC in the subsets defined in F (left panel), and J) quantifications of the mean fluorescence intensity (MFI). K) Representative flow cytometric plots depicting cellular morphology of Hepa 1–6 cells either kept untreated or treated for 20 h with LNP1 or combination treatment with LNP1 and 100 ng mL−1 nocodazole (100 ND). L) In addition to the treatment in K, pre‐treatment was done with 40 ng mL−1 nocodazole (40 ND), 200 ng mL−1 colchicine (200 CC) compared to Hepa 1–6 cells without treatment (blank), stained with DAPI alone, untreated, or with only LNP1 (UT). Ploidy (2n, 4n) was assessed by flow cytometric analysis of nuclei staining. M) Influence of 100 ND on EGFP‐derived signals in 2n Hepa 1–6 cells. N) Backgating on the morphology of the EGFP+ cells in selected groups. Untreated cells are shown as a reference. O) Impact of PP induction on the EGFP expression in Hepa 1–6 cells. Data represent mean of n = 2–3 ± SD; *p < 0.05, **p < 0.01, ***p < 0.001, ****p < 0.0001 (One‐way ANOVA).
Figure 8
Figure 8
Quantification of total RNA and protein of Kupffer cell and hepatocytes. Primary murine KC and HC were cultured for one day after isolation. Cells were counted and RNA or protein were isolated. A) Quantifications of total RNA and total protein from KC and HC. B) Immunoblot‐based analysis of selected proteins including a quantification of the immunoblot signals. Data represent mean of n = 3 ± SD; **p < 0.01, ****p < 0.0001 (t‐test).

References

    1. Schulze R. J., Schott M. B., Casey C. A., Tuma P. L., McNiven M. A., J. Cell Biol. 2019, 218, 2096. - PMC - PubMed
    1. a) Woitok M. M., Zoubek M. E., Doleschel D., Bartneck M., Mohamed M. R., Kiessling F., Lederle W., Trautwein C., Cubero F. J., Cell Death Dis. 2020, 11, 343; - PMC - PubMed
    2. b) Lin C., Jans A., Wolters J. C., Mohamed M. R., Van der Vorst E. P. C., Trautwein C., Bartneck M., Adv. Healthcare Mater. 2024, 13, e2202670; - PubMed
    3. c) Mohamed M. R., Haybaeck J., Wu H., Su H., Bartneck M., Lin C., Boekschoten M. V., Boor P., Goeppert B., Rupp C., Strnad P., Davis R. J., Cubero F. J., Trautwein C., JHEP Rep. 2023, 5, 100854. - PMC - PubMed
    1. Kulkarni J. A., Witzigmann D., Thomson S. B., Chen S., Leavitt B. R., Cullis P. R., van der Meel R., Nat. Nanotechnol. 2021, 16, 630. - PubMed
    1. Heymann F., Peusquens J., Ludwig‐Portugall I., Kohlhepp M., Ergen C., Niemietz P., Martin C., van Rooijen N., Ochando J. C., Randolph G. J., Luedde T., Ginhoux F., Kurts C., Trautwein C., Tacke F., Hepatology 2015, 62, 279. - PubMed
    1. Pattipeiluhu R., Arias‐Alpizar G., Basha G., Chan K. Y. T., Bussmann J., Sharp T. H., Moradi M. A., Sommerdijk N., Harris E. N., Cullis P. R., Kros A., Witzigmann D., Campbell F., Adv. Mater. 2022, 34, 2201095. - PMC - PubMed

Substances

LinkOut - more resources