. 2025 Jan 7;122(1):e2415713122.
doi: 10.1073/pnas.2415713122. Epub 2024 Dec 30.

Structural insight into sodium ion pathway in the bacterial flagellar stator from marine Vibrio

Affiliations

Structural insight into sodium ion pathway in the bacterial flagellar stator from marine Vibrio

Tatsuro Nishikino et al. Proc Natl Acad Sci U S A. .

Abstract

Many bacteria swim in liquid or swarm on surface using the flagellum rotated by a motor driven by specific ion flow. The motor consists of the rotor and stator, and the stator converts the energy of ion flow to mechanical rotation. However, the ion pathway and the mechanism of stator rotation coupled with specific ion flow are still obscure. Here, we determined the structures of the sodium-driven stator of Vibrio, namely PomAB, in the presence and absence of sodium ions and the structure with its specific inhibitor, phenamil, by cryo-electron microscopy. The structures and following functional analysis revealed the sodium ion pathway, the mechanism of ion selectivity, and the inhibition mechanism by phenamil. We propose a model of sodium ion flow coupled with the stator rotation based on the structures. This work provides insights into the molecular mechanisms of ion specificity and conversion of the electrochemical potential into mechanical functions.

Keywords: CryoEM; bacterial flagellum; ion-driven motor; motility; stator.


Conflict of interest statement

Competing interests statement:The authors declare no competing interest.

Figures
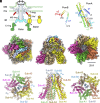
Fig. 1.
Fig. 1.
Structure of the stator complex of Vibrio alginolyticus. (A) Schematic drawing of the polar flagellar motor of V. alginolyticus. The MS-, C-, and T-ring are colored in cyan, green, and red, respectively. Sodium ion changes the conformation of the periplasmic region of PomB (orange) to bind to the T-ring as well as to open the ion channel of the stator complex (yellow and orange). (B) Ribbon representation of PomA and PomB protomers. (C) CryoEM map of Va-PomAB viewed from periplasm (Left), side (Middle), and cytoplasm (Right). PomA Sub-A1, A2, A3, A4, and A5, and PomB Sub-B1 and B2 are colored in green, magenta, brown, yellow, orange, pale blue, and cyan, respectively. (D) Ribbon representation of Va-PomAB. The views and the subunit colors are the same as in (C). The plug helices are labeled as PB1 and PB2.
Fig. 2.
Fig. 2.
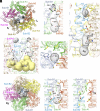
The long and short tunnels in Va-PomAB. The subunits are colored as in Fig. 1D. (A) Position of the long (Lt) and short (St) tunnels in Va-PomAB viewed from the periplasmic side. The residues from 40 to 60 including the plug helices are removed for easy viewing. The tunnels are shown as gray blobs. (B) The long (Lt) and short (St) tunnels viewed from the bottom of (A). Sub-A4 is removed for easy viewing. D24 residues of PomB are shown by the stick model. Cavity-I (CI) and Cavity-I′ (CI′) are labeled and highlighted by dark gray. Cavity-II (CII) is labeled. The pentagonal groove (Pg) is shown by yellow blobs. Cavity-II (CII) is indicated by green blobs. The short tunnel (St) is drawn by yellow blobs. (C) Cytoplasmic view of Va-PomAB. The pentagonal groove (Pg) is shown by gray blobs. (D) Close-up side view of the long tunnel (Lt). The thin bottleneck region is indicated by a two-headed arrow. The residues involved in the bottleneck region are shown in the stick model. Sodium ions (Na1 and Na2) and solvent molecules (Wt1, Wt2, and Wt3) in the long tunnel are indicated by balls. (E) Close-up view of Cavity-I (CI) viewed from the periplasmic side. The residues that form the inner wall of Cavity-I are shown by the stick model. (F) Close-up side view of Cavity-II (CII). The residues that form the inner wall of Cavity-II are shown by the stick model. (G) Close-up side view of the short tunnel (St) and Cavity-I′ (CI′). The residues that form the inner wall of the short tunnel and Cavity-I′ are shown by stick model. (H) Close-up side view of the sodium binding site of PomAB at 300 mM NaCl (PDB ID 8BRD).
Fig. 3.
Fig. 3.
Ion and solvent molecules found in the tunnels. The cryoEM map (orange) and the difference map (cryo-EM map minus protein model map) (blue) are shown with the atomic model. Close-up view of (A) the long tunnel viewed from the periplasmic side, (B) Cavity-II, and (C) the short tunnel of Va-PomAB at 100 mM NaCl. (D) Close-up view around the long tunnel viewed from the periplasmic side and (E) of Cavity-II of Va-PomAB at 100 mM KCl. (F) Close-up view of Cavity-II of Va-PomAB(D24N) at 100 mM NaCl. Sodium ions (Na1 and Na2) and solvent molecules (Wt1 and Wt2) are indicated by balls.
Fig. 4.
Fig. 4.
Structure of Va-PomAB with Phenamil. (A) CryoEM map of Va-PomAB with phenamil viewed from periplasm. (B) Ribbon representation of Va-PomAB with phenamil viewed from the periplasmic side. The bound phenamil is shown by the stick model. The residues from 40 to 60 including the plug helices are removed for easy viewing. The long (Lt) and short narrow (St) tunnels are shown as gray blobs. (C) Phenamil binds near the short narrow tunnel. Phenamil and the residues that form the inner wall of the short tunnel are shown by the stick model. (D) The CryoEM map (orange) and the difference map (cryo-EM map minus protein model map) (blue) are shown with the atomic model. (E and F) Close-up view of the phenamil binding site from periplasmic view (E) and the side view (F). Phenamil and the residues that interact with phenamil are shown by the stick model. The carbon atoms of phenamil are colored gray. Oxygen, nitrogen, and chloride atoms are colored red, blue, and green, respectively. The subunits are colored as in Fig. 1D.
Fig. 5.
Fig. 5.
The Na+ conductivity of the stators with mutation at PomA L166 or M179. (A) Close-up view of Cavity I in Va-PomAB. The residues on the surface of Cavity I are labeled. The subunits are colored as in Fig. 1D. (B) Effects of PomA mutations on cell growth by plug deletion stators. Escherichia coli cells harboring the plasmids pBAD33 (vector) or pTSK37 (PomABΔL or with various mutations) were cultured in LB medium with the final Na concentration of 102 mM (left panel) or LB-Na0 medium with the final Na concentration of 17 mM (right panel) at 37 ºC for 7 h. (C) Comparison of amino acids on the surface of Cavity-I. The sequences are V. alginolyticus, VaPomA and B; Vibrio mimicus, VmPomA and B; Vibrio. cholerae, VcPomA and B; Vibrio parahaemolyticus, VpPomA and B; Shewanella oneidensis, SoPomA and B; Bacillus subtilis, BsMotP and S, or MotA and B; R. sphaeroides, RsMotA and B; Campylobacter jejuni, CjMotA and B; E. coli, EcMotA and B; and Salmonella enterica, SeMotA and B.
Fig. 6.
Fig. 6.
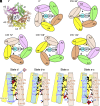
A model of sodium ion flux coupled with PomA rotation. (AF) Schematic diagram of the sodium ion flux coupled with PomA rotation viewed from the periplasm. The subunits are painted in the same colors as in Fig. 1D and labeled with capital letters. The structural states of the clefts between two PomA subunits are labeled with small letters. The clefts transition their structural states d, a, c, e, and b with every 36° CW rotation in this order. A sodium ion is imported into Cavity-I′ of the cleft at state d, moves to Cavity-II at state a, and is released to the cytoplasm at state c. The clefts at state b and e do not contain sodium ions. (A) Ribbon representation of Va-PomAB. (BF) Schematic diagram focused on the cleft between Sub-A3 and A4 (the A3A4-cleft) highlighted by a light-orange triangle. (B) Schematic representation of Va-PomAB shown in (A). This subunit arrangement is defined as 0°. A hydrated sodium ion is imported into Cavity-I′ of the A3A4-cleft. (C) After 36° CW rotation of the PomA ring, the state of the A3A4-cleft transitions to state a, and the hydrated sodium ion moves to Cavity-II. The sodium ion is dehydrated by S27 and C31 of PomB and bound to T158 and T186 of PomA. (D) After 72° CW rotation of the PomA ring, the state of the A3A4-cleft transitions to state c. The sodium ion is picked by D24 of PomB and is released to the cytoplasm via N194. (E) The state of the clefts after 108° CW rotation of the PomA ring. (F) The state of the clefts after 144° CW rotation of the PomA ring. (G) Side view of the schematic diagram of the sodium ion flux through the A3A4-cleft. Sodium ion and hydrated waters are shown by purple and red balls, respectively.

Similar articles

Cited by

References

    1. Berg H., The rotary motor of bacterial flagella. Annu. Rev. Biochem. 72, 19–54 (2003). - PubMed
    1. Minamino T., Imada K., The bacterial flagellar motor and its structural diversity. Trends Microbiol. 23, 267–274 (2015). - PubMed
    1. Terashima H., Kawamoto A., Morimoto Y. V., Imada K., Minamino T., Structural differences in the bacterial flagellar motor among bacterial species. Biophys. Physicobiol. 14, 191–198 (2017). - PMC - PubMed
    1. Blair D. F., Flagellar movement driven by proton translocation. FEBS Lett. 545, 86–95 (2003). - PubMed
    1. Asai Y., et al. , Putative channel components for the fast-rotating sodium-driven flagellar motor of a marine bacterium. J. Bacteriol. 179, 5104–5110 (1997). - PMC - PubMed

LinkOut - more resources