. 2025 Jan 7;122(1):e2407745121.
doi: 10.1073/pnas.2407745121. Epub 2024 Dec 30.

Hydroxychloroquine prevents resistance and potentiates the antitumor effect of SHP2 inhibition in NF1-associated malignant peripheral nerve sheath tumors

Affiliations

Hydroxychloroquine prevents resistance and potentiates the antitumor effect of SHP2 inhibition in NF1-associated malignant peripheral nerve sheath tumors

Sameer Farouk Sait et al. Proc Natl Acad Sci U S A. .

Abstract

Malignant peripheral nerve sheath tumors (MPNSTs) are aggressive sarcomas and the primary cause of mortality in patients with neurofibromatosis type 1 (NF1). These malignancies develop within preexisting benign lesions called plexiform neurofibromas (PNs). PNs are solely driven by biallelic NF1 loss eliciting RAS pathway activation, and they respond favorably to MEK inhibitor therapy. MPNSTs harbor additional mutations and respond poorly to MEK inhibition. Our analysis of genetically engineered and orthotopic patient-derived xenograft MPNST models indicates that MEK inhibition has poor antitumor efficacy. By contrast, upstream inhibition of RAS through the protein-tyrosine phosphatase SHP2 reduced downstream signaling and suppressed NF1 MPNST growth, although resistance eventually emerged. To investigate possible mechanisms of acquired resistance, kinomic analyses of resistant tumors were performed, and data analysis identified enrichment of activated autophagy pathway protein kinases. Combining SHP2 inhibition with hydroxychloroquine (HQ) resulted in durable responses in NF1 MPNSTs in both genetic and orthotopic xenograft mouse models. Our studies could be rapidly translated into a clinical trial to evaluate SHP2 inhibition in conjunction with HQ as a unique treatment approach for NF1 MPNSTs.

Keywords: MPNST; NF1; SHP2 inhibition; autophagy; hydroxychloroquine.


Conflict of interest statement

Competing interests statement:B.G.N. reports personal fees and other support from Northern Biologics, Ltd, Navire Pharma, Lighthorse Therapeutics, Aethon Therapeutics and other support from Recursion Pharma, Arvinas, Regeneron, Moderna, Revolution Medicines, Mirati, and Amgen, Inc. outside the submitted work. Clinical trials of the Novartis MEK inhibitor Trametinib in conjunction with HQ and Verastem Oncology MEK inhibitor Avutometinib are underway at MSKCC. Clinical trials of the Novartis SHP2 inhibitor TNO155 and the Amgen (Sotorasib), Mirati (Adagrasib), and Revolution Medicines (RMC-6236) KRAS inhibitors have been performed or are under way at PCC. No disclosures were reported by the other authors. The authors declare that they have no affiliations with or involvement in any organization or entity with any financial interest in the subject matter or materials discussed in this manuscript.

Figures

Fig. 1.
Fig. 1.
In vitro testing of mouse allograft models. (A) CellTiter-Glo viability assays of primary cultures of NP mutant and (B) NI mutant MPNSTs (n = 2 each) treated for 96 h with vehicle (DMSO), Trametinib (25 nM), SHP099 (10 mM), or SHP099 and Trametinib. (C) RAF-RBD pulldown assays performed after the indicated times of drug treatment in NP mutant and (D) NI mutant primary tumor cultures. (E) Immunoblots for the indicated analytes in lysates from NP mutant; and (F) NI mutant primary cultures treated as indicated. Numbers under each lane represent quantification of pMEK or pERK signals normalized to that of total MEK or ERK and compared to DMSO. Representative results from a minimum of three biological replicates are shown per condition.
Fig. 2.
Fig. 2.
Effects of SHP2 or MEK inhibition alone or in combination in mouse MPNST orthotopic allografts and patient-derived xenograft (PDXs) models. (A) Waterfall plots demonstrating relative change in tumor volume from baseline following 10 d of drug treatment in NP mutant and (B) NI mutant MPNST models (n = 6 mice per condition for each model). (C) Kaplan–Meier curves showing survival of drug-treated mice versus controls (vehicle) in NP mutant and (D) NI mutant allograft models (n = 6 mice per condition). (E) Immunoblots of tumor lysates obtained 6 h after a single dose or 6 h after three daily doses of drug from mice bearing NP mutant or (F) NI mutant MPNSTs (n = 3 mice per condition). Numbers under each lane represent quantification of pMEK, pERK, and SHP2 signals normalized to that of total MEK or ERK and compared to DMSO. (G) Kaplan–Meier curve demonstrating survival of drug-treated mice versus controls (vehicle) in independent NF1 MPNST PDX models (PDX#2; n = 3 to 5 mice per condition) and (H) (PDX#1; n = 5 mice per condition).
Fig. 3.
Fig. 3.
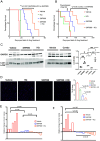
Resistance to SHP099 is associated with activation of autophagy genes and proteins. (A) NP mutant cells (NP-parental) were injected into the SN of nude mice (n = 5). When tumors reached 200 to 500 mm3, mice were treated daily with SHP099 (50 mg/kg) until resistance occurred, corresponding to approximately days 21 to 28 following start of therapy (NP-Res tumors). (B) CellTiter-Glo assays of NP mutant MPNST cells derived (ex vivo) from vehicle-treated (NP-V1 and NP-V2) or resistant (NP-SHP099Res1 and NP-SHP099Res2) tumors, exposed for 96 h in vitro to DMSO or SHP099 (10 M). (C) MPNST cells derived from a representative vehicle-treated (NP-V) or resistant tumor (NP-Res) were reinjected into the SN of nude mice. SHP099 (indicated by arrow) or vehicle treatment was started 7 d following cell injection as depicted by the arrow (n = 3 to 5 mice per condition). Kaplan–Meier curves are shown. (D) Snap-frozen tumors from mice treated with vehicle, SHP099 (5 d = sensitive tumors), SHP099 (20 to 28 d = resistant tumors) were lysed and subjected to kinome profiling by multiplexed inhibitor bead/mass spectrometry (MIB/MS). Log2 fold-change in PIK3C3 binding to multiplex inhibitor beads in lysates from tumors treated with vehicle, SHP099 (5 d and 20 to 28 d) (n = 3 replicates per condition). (E) Immunofluorescence (IF) demonstrating p62 staining in sections from tumors treated with drugs as indicated. The panel on the right shows quantification. (F) Gene Set Enrichment Analysis plots of selected autophagy gene sets (core autophagy genes) that are differentially expressed in Resistant (SHP099 28 d) vs Sensitive (SHP099 5 d) NP mutant MPNST allografts (n = 3 replicates per condition, *P <0.01, FDR q = 0.06, NES = 1.33) and (G) Resistant (SHP099 28 d) versus Sensitive (SHP099 5 d) NF1-MPNST PDX#2 samples (n = 3 replicates per condition, *P <0.01, FDR q = 0.03, NES = 1.4). Up/downregulation enrichment scores were labeled in each figure. Detailed autophagy-related gene sets (core autophagy genes) are provided in SI Appendix, Table S2.
Fig. 4.
Fig. 4.
Combined SHP2 and autophagy inhibition prolongs survival in NF1 MPNST models. (A) Kaplan–Meier curves showing survival of drug-treated mice versus controls (vehicle) in NP mutant MPNST (n = 5 to 8 mice per group) and (B) an NF1 MPNST PDX model (PDX#2, n = 4 to 6 mice group). (C) Immunoblots of NP mutant MPNST lysates obtained 6 h after administration of a single dose of drug to tumor-bearing mice (n = 3 mice per group). The panel on the right shows quantification of LC3II/I ratios. (D) IF demonstrating Ki67 staining in tumor sections from mice bearing NP mutant MPNST and treated with vehicle, SHP099, HQ, or SHP099 and HQ (n = 3 biological replicates). The panel on the right shows quantification. (E) Waterfall plot demonstrating relative change in tumor volume from baseline following 42 d of vehicle or drug treatment (SHP099 50 mg/kg daily or combination of SHP099 50 mg/kg daily and HQ 50 mg/kg daily) in mice implanted with NF1 MPNST PDX#2 (NF1, CDKN2A, TP53 mutant) (passage 1 xenografts; n = 5 to 6 mice per group) and (F) following 21 d of treatment in mice implanted with NF1 MPNST PDX#4 (NF1, CDKN2A, EED mutant) (passage 1 xenografts; n = 5 mice per group).

References

    1. Gutmann D. H., et al. , Neurofibromatosis type 1. Nat. Rev. Dis. Primers 3, 17004 (2017). - PubMed
    1. Tucker T., Wolkenstein P., Revuz J., Zeller J., Friedman J. M., Association between benign and malignant peripheral nerve sheath tumors in NF1. Neurology 65, 205–211 (2005). - PubMed
    1. Kolberg M., et al. , Survival meta-analyses for >1800 malignant peripheral nerve sheath tumor patients with and without neurofibromatosis type 1. Neuro Oncol. 15, 135–147 (2013). - PMC - PubMed
    1. Gross A. M., et al. , Selumetinib in children with inoperable plexiform neurofibromas. N. Engl. J. Med. 382, 1430–1442 (2020). - PMC - PubMed
    1. Jessen W. J., et al. , MEK inhibition exhibits efficacy in human and mouse neurofibromatosis tumors. J. Clin. Invest. 123, 340–347 (2013). - PMC - PubMed

MeSH terms

Substances

LinkOut - more resources