. 2025 Jan 7;122(1):e2413191121.
doi: 10.1073/pnas.2413191121. Epub 2024 Dec 30.

Gonadal sex and temperature independently influence germ cell differentiation and meiotic progression in Trachemys scripta

Affiliations

Gonadal sex and temperature independently influence germ cell differentiation and meiotic progression in Trachemys scripta

Talia Hatkevich et al. Proc Natl Acad Sci U S A. .

Abstract

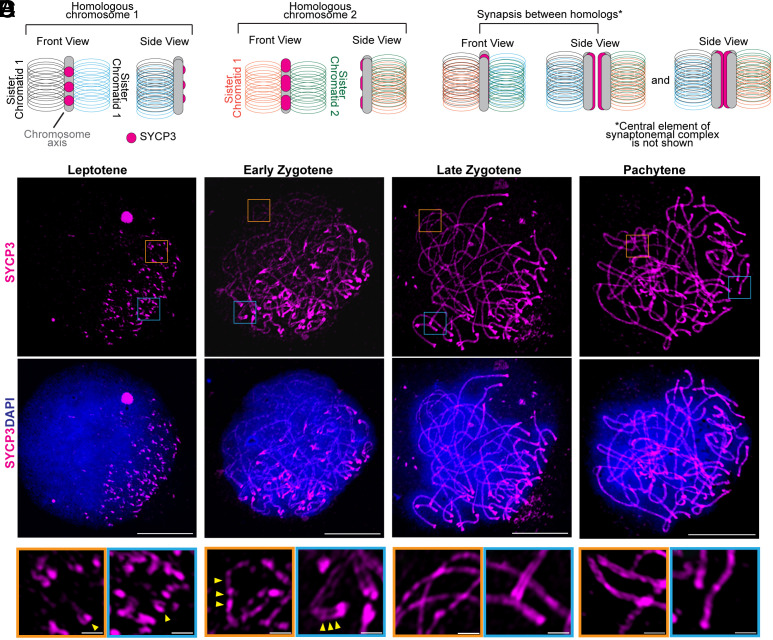
In species with genetic sex determination (GSD), the sex identity of the soma determines germ cell fate. For example, in mice, XY germ cells that enter an ovary differentiate as oogonia, whereas XX germ cells that enter a testis initiate differentiation as spermatogonia. However, numerous species lack a GSD system and instead display temperature-dependent sex determination (TSD). In the red-eared slider turtle, Trachemys scripta, a TSD model species with a warm female promoting temperature (FPT) and cool male promoting temperature (MPT) system, temperature directly affects germ cell number. In this study, we examined whether temperature directly affects other aspects of germ cell differentiation/sex identity. We uncoupled temperature and the sexual fate of the gonad by incubating eggs at MPT and treating with 17β-estradiol, a scheme that invariably produces ovaries. Through analysis of meiotic spreads, we showed that germ cells in FPT ovaries follow the typical pattern of initiating meiosis and progress through prophase I. However, in E2-induced ovaries that incubated at MPT, germ cells entered prophase I yet fail to exhibit synapsis. These results, combined with our single-cell transcriptome analysis, reveal a direct effect of temperature on germ cell sexual differentiation independent of its effect on the gonadal soma. These results imply that not all events of meiosis are under somatic control, at least not in this TSD species.

Keywords: germ cell; meiosis; sex determination.


Conflict of interest statement

Competing interests statement:The authors declare no competing interest.

Figures

Fig. 1.
Fig. 1.
Single-cell transcriptomics reveal heterogeneous meiotic gene expression throughout the TSP. (A) Events of gonadal development in T. scripta. Asterisks indicate stages analyzed for single-cell transcriptomics. (B) Left: SCVI-integrated UMAP of T. scripta gonads during somatic sex determination with colors representing the sample of origin (FPT = Female producing temperature, MPT = Male producing temperature). Right: Same UMAP as in A but colored according to cell types. (C) Left: SCVI-integrated UMAP of germ cells. Right: UPMAP colored according to the subclustering. (D) UMAP colored with the AUCell score of genes belonging to the GO term meiotic cell cycle (Left). Right: Violin plot of the same AUCell scores split by subclusters. (E) Dot plot of differentially expressed genes in the different clusters. Colors represent the mean expression in the clusters and the size of the dots the proportion of cells in the cluster where the transcript is detected. Additional genes related to meiosis but not found to be differentially expressed among clusters were also added (written in gray). (F) MA plots showing differentially expressed genes within subcluster 0 between FPT and MPT cells. Meiotic cell cycle process genes are indicated. (G) Violin plot with the expression of two representative meiotic cell cycle process genes. (H) MA plots showing differentially expressed genes within subcluster 0 between FPT and MPT cells for the WNT signaling pathway. (I) Violin plot with the expression of Wnt5b and Fzd9.
Fig. 2.
Fig. 2.
Cellular meiotic onset occurs at St. 24 in gonads incubated at FPT. (A) Generalized early prophase I events. See text for more details. Blue chromosome: replicated sister chromatids; pink chromosome: replicated sister chromatids; blue and pink chromosomes: homologous chromosome pair (2n, 4c). Stars: Meiotic double-strand breaks (DSBs). Thick pink and blue lines represent the synaptonemal complex lateral element protein (SYCP3) on respective homologs. (B) Representative image of FPT St. 24 ovary stained with γH2AX (meiotic DSBs, magenta), HuC/D (germ cells, green), and DAPI (DNA, blue). (C) Representative images of the three developmental stages of germ cells identified in FPT St. 24 gonads. Stages include “Not Meiotic,” “Early Leptotene,” and “Late Leptotene.” (D) Quantification of the number of meiotic germ cells per section, as determined by γH2AX. ***P < 0.001, unpaired t test. FPT 23 n = 3 gonads; FPT 24 n = 6 gonads; FPT 26 n = 5 gonads; MPT 26 n = 3 gonads. (E) Representative image of FPT St. 26 gonad, stained with γH2AX (magenta), HuC/D (green), and DAPI (blue). (F) Representative images of the developmental stages of germ cells identified in FPT St. 26 gonads. Stages shown are “Not Meiotic,” “Early Leptotene,” and “Late Leptotene,” “Zygotene,” and “Pachytene.” (G) St. 26 gonad incubated at MPT. Biological replicates = n > 3 embryos for each experiment. Scale bars A, C, E, 10 μm width, 2 pixels thick. Scale bars B, D, 5 μm width, 2 pixels thick. Dashed lines in (B) and (E) outline the ovarian cortex. Dashed lines in (G) represent the outline of the testis. All images are of transverse cross sections.
Fig. 3.
Fig. 3.
SYCP3 localization throughout prophase I demonstrates that distal ends of the chromosomes synapse prior to chromosome arm synapsis. (A) Schematic of the medial portion (arm) of an unpaired homologous chromosome. The chromosome has two sister chromatids flanking a chromosome axis. Loops represent chromatin. SYCP3 initiates as patches on the axis between the sister chromatids. The front view and side view are shown. SYCP3 is shown as a pink structure. (B) Schematic of the chromosome that is homologous to (A). (C) Front and side view of homologous chromosomes when they are synapsed. SYCP3 is a linear structure and is visualized as two parallel tracks in proximity to each other. (D) At this resolution, synapsis of SYCP3 tracts may not be distinguishable. (E) Representative image of SYCP3 localization in a leptotene meiotic spread. (E’) SYCP3 (magenta) and DAPI (blue). (E’’) Magnification of orange box in (E). The yellow arrow indicates telomere morphology. (E’’’) Magnification of the blue box in (E). The yellow arrow indicates telomere morphology. (FF’’’) Representative image of SYCP3 localization in an early zygotene meiotic spread and its respective break-out boxes. F’’ yellow arrows indicate pairing of distal ends of chromosome axes. F’’’ yellow arrows show SYCP3 localization as patches along the chromosome arm. (GG’’’) Representative image of SYCP3 localization in a late zygotene meiotic spread and its respective break-out boxes. G’’ and G’’’ show distal and medial areas of chromosomes, respectively. (HH’’’) Representative image of SYCP3 localization in a late zygotene meiotic spread and respective break-out boxes. H’’ and H’’’ highlight distal and medial areas of chromosomes, respectively. Scale bars E’, F’, G’, and H’, 10 μm. Break-out boxes: 1 μm. Biological replicates = n > 10 embryos for each experiment. Contrast and intensity of images in break-out boxes were adjusted uniformly for clarity.
Fig. 4.
Fig. 4.
Germ cells continue to proliferate throughout development at MPT. (A and B) Representative whole mount image of St. 24 testis. Samples were stained with pH3 (magenta) to label mitotic cells (yellow arrows), HuC/D (green) to label germ cells, and DAPI to label the nuclei. The orange box is magnified in C. (Scale bar, 20 μm.) (C) Break-out image of a mitotic germ cell from the testis in A and B. (Scale bar, 5 μm.) (D) Representative images of MPT gonads quantified in (E). Samples were stained with HuC/D to identify germ cells. (Scale bar, 100 μm.) (E) Quantification of germ cell number per MPT gonads throughout late embryonic development (St. 22 n = 5 gonads, St. 23 n = 4 gonads, St. 24 n = 4 gonads, St. 26 n = 4 gonads). Lowercase letters represent statistically significant groups (a: not significant; b: P = 0.0002; One-way ANOVA). All images are of whole mount testes.
Fig. 5.
Fig. 5.
Meiotic germ cells in MPT+E2 St. 26 spreads build SYCP3 but do not exhibit synapsis at pachytene. (A) Representative image of SYCP3 localization in an early zygotene meiotic spread from a sex-reserved ovary. (A’) SYCP3 (magenta) and DAPI (blue). (A’’) Magnification of the orange box in (A). (A’’’) Magnification of blue box in (A). (BB’’’) Representative image of SYCP3 localization in a late zygotene meiotic spread in MPT + E2 ovary and its respective break-out boxes. B’’ shows SYCP3 localization as patches along the chromosome arm. B’’’ shows lack of synapsis at distal ends of chromosome axes. (CC’’’) Representative image of SYCP3 localization in a pachytene meiotic spread in MPT+E2 ovary and its respective break-out boxes. C’’ and C’’’ show medial and distal areas of chromosomes, respectively. (DD’’’) Representative image of SYCP3 localization in a germ cell from a St. 26 FPT ovary control at pachytene. D’’ and D’’’ show two tracks of SYCP3, indicating synapsis, which is absent in C’’ and C’’’. Scale bars A’, B’, C’, and D’: 10 μm. Break-out boxes: 1 μm. Biological replicates = n > 10 embryos for each experiment. Contrast and intensity of images in break-out boxes were adjusted for clarity. (E) Model of SYCP3 localization but in germ cells from an MPT + E2 sex-reversed ovary.

Similar articles

Cited by

References

    1. Zickler D., Kleckner N., Recombination, pairing, and synapsis of homologs during meiosis. Cold Spring Harb. Perspect Biol. 7, a016626 (2015). - PMC - PubMed
    1. Berta P., et al. , Genetic evidence equating SRY and the testis-determining factor. Nature 348, 448–450 (1990). - PubMed
    1. Koopman P., Münsterberg A., Capel B., Vivian N., Lovell-Badge R., Expression of a candidate sex-determining gene during mouse testis differentiation. Nature 348, 450–452 (1990). - PubMed
    1. Capel B., Vertebrate sex determination: Evolutionary plasticity of a fundamental switch. Nat. Rev. Genet. 18, 675–689 (2017). - PubMed
    1. McLaren A., Germ cells and germ cell sex. Philos Trans. R Soc. Lond. B Biol. Sci. 350, 229–233 (1995). - PubMed

LinkOut - more resources