. 2025 Jan 7;122(1):e2414632122.
doi: 10.1073/pnas.2414632122. Epub 2024 Dec 30.

The return of stagnant slab recorded by intraplate volcanism

Affiliations

The return of stagnant slab recorded by intraplate volcanism

Zhong-Biao Zhou et al. Proc Natl Acad Sci U S A. .

Abstract

Subducted plates often stagnate in the mantle transition zone (MTZ), and the fate of the stagnant slabs is still debatable. They may sink into the lower mantle, or remain partially trapped in the MTZ, but it is uncertain whether they can return to the upper mantle. We report geochemical evidence of late-Miocene (~6 Ma) basalts from, and upper mantle seismic evidence beneath Shuangyashan, an area above the slab tear of the stagnant Pacific plate in eastern Asia, to show how the slab returns to the upper mantle from the MTZ. Remarkably high δ57Fe, Gd/Yb and low δ26Mg, Ti/Eu, CaO/Al2O3 values of Shuangyashan basalts suggest that the subducted Pacific oceanic crust had been entrained to their upper mantle source. Therefore, the return of oceanic crust from the MTZ to the upper mantle appears to have been driven by upwelling triggered by tearing of the stagnant slab right beneath this area. Meanwhile, local shear splitting measurements reveal a circular pattern of anisotropy in the upper mantle with delay times diminishing toward the slab tear, suggesting that the slab-fragment-bearing upwelling subsequently turned into lateral flows in the upper mantle, and contributed to a wider intraplate magmatism above the stagnant slab. This finding, together with other widespread intraplate volcanism from eastern Asia, extending for approximately 6,000 km, demonstrates that a subduction-induced tear can lead to the destruction and partial return of stagnant slab material, and thus lead to the cycling of subducted crustal materials and the generation of subduction-induced intraplate magmatism.

Keywords: intraplate basalts; mantle transition zone; mantle upwelling; slab tear; stagnant slab.


Conflict of interest statement

Competing interests statement:The authors declare no competing interest.

Figures
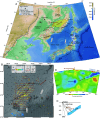
Fig. 1.
Fig. 1.
Geophysical maps and distributions of Cenozoic volcanism in northeast Asia. (A) The black contour lines denote the depths of Pacific slab in the mantle (25). The triangles denote the distributions of Cenozoic intraplate and arc volcanism. The dashed area denotes the scope of (B). The black straight line denotes the location of cross-section in (C). The present-day slab front lies to the east of, and roughly parallel to the Daxing’anling-Taihangshan gravity lineament (DTGL). The map is created with software Global Mapper v20. TLFZ-Tanlu fault zone. (B) SKS (black bars) and local S (yellow and red bars) splitting measurements. Both SKS and local S measurements are projected to 240 km depths along their ray piercing points in Shuangyashan area (dashed area in A). Gray squares denote the distribution of seismic stations. Black bars show the published SKS splitting measurements (26, 27) while the gray circles around denote the first Fresnel zone for SKS wave of 5 s. The yellow and red bars show individual local S splitting measurements and their spatial averages at grid nodes of 0.4° * 0.4°, respectively. The orientations and lengths of the short bars represent the fast polarization directions (FPDs) and delay times, respectively. Distributions of Cenozoic intraplate volcanism are shown in dark gray backgrounds. The black contour lines denote the depths of Pacific slab. The circles above the black contour lines show the distributions of deep earthquakes (M ≥ 4.0), while the colored circles denote the earthquakes used for local S splitting measurements in this study (the magnitudes and focal depths are shown in the Top-Left inset). The two blue arrows denote the absolute plate motion of the Eurasian Plate (APM) and the Pacific Plate (PPM). The thick black arrow denotes lateral mantle flow from the tear to surrounding upper mantle. (C) Cross-section (black straight line in A) of seismic P-wave velocity perturbation with seismic gap and low velocity anomaly shown beneath the Shuangyashan area (28). White dots denote deep earthquakes with depths more than 100 km. (D) Abbreviated cartoon showing the intrinsic differences between SKS splitting and Local S splitting results, where the former record the superimposed anisotropy in the whole mantle depth, while the latter record the anisotropy of the upper mantle along the ray paths between the hypocenters of the local events (colored dots in the slab) and the station.
Fig. 2.
Fig. 2.
Variations in Sr-Nd-Pb-Fe-Mg isotopes for Shuangyashan basalts from northeast Asia. Data for Indian and Pacific mid-ocean ridge basalt glasses (MORBs; ref. 31) are shown for comparison in (A and B). In (B), mixing line 1) ambient mantle peridotite (32) modified by melts of subducted sediments; mixing line 2) upwelling mantle containing recycled oceanic crust (31) (eclogite) and the metasomatized peridotite; mixing array 3) lateral flowing mantle consisting of slab-fragment-bearing upwelling mantle (represented by Shuangyashan basalts) and EM1 component (represented by potassic basalts from northeast China). The thick black arrow in (B) denotes mixing process controlled by lateral asthenospheric flow. More details of calculation can be seen in Dataset S8. In (C and D), δ57Fe values of Shuangyashan basalts and MORBs (33), have been corrected to eliminate the effect of olivine fractionation (SI Appendix, Part 1). δ57Fe data (calculated mean values with ± 95% confidence interval) of peridotitic mantle (34), δ26Mg data of peridotitic mantle (35), calculated δ57Fe variations of low degree (2.5 to 10%) partial melts of eclogite (36) are shown for comparison. Error bars on δ57Fe and δ26Mg represent 2SD (SD) uncertainties. Detailed reference data sources for Cenozoic basalts and subducting Pacific sediments are listed in Dataset S7. EM1-enriched mantle 1, GLOSS-Global Subducting Sediments (37).
Fig. 3.
Fig. 3.
Variations in 206Pb/204Pb, Ti/Eu, CaO/Al2O3, Gd/Yb values, and Yb content for Shuangyashan basalts from northeast Asia. Average Ti/Eu, CaO/Al2O3, and Gd/Yb ratios of MORBs (31) are shown for comparison. Calculations on the composition of eclogitic melts with various melting degrees in (D) are listed in Dataset S8. Arc basalts (with MgO > 5%) data are shown for comparison. Reference data sources are listed in Dataset S7.
Fig. 4.
Fig. 4.
Cartoon showing the genetic links between the slab tear and the Cenozoic intraplate volcanism in northeast Asia. The slab fragments are incorporated into upwelling triggered by tearing of the stagnant slab. The 3-D arrows show the toroidal convective pattern related to the slab tear. Vertical upwelling turns into lateral flows in the surrounding upper mantle and contributes to the surface intraplate volcanism. The right column shows the details of the through-tear upwelling upper mantle. Upwelling slab sediments melt and modify the ambient upper mantle to form metasomatized peridotite. During subsequent further upwelling the metasomatized peridotite and the slab crust melt to form mixed basaltic melts.
Fig. 5.
Fig. 5.
Comparison between Pb-Nd isotopic compositions of late Cenozoic intraplate basalts and high-velocity structure in the MTZ beneath eastern Asia. The insets are plotted with the same range of Pb-Nd isotopes. Black dots in inset 1 show the whole isotopic variations of late Cenozoic intraplate basalts from eastern Asia. Insets 2~11 show the isotopic compositions of basalts from different locations. The yellow shadowed areas defined by Shuangyashan basalts are shown in all the insets for comparison. Black and blue arrows in the insets denote two distinct trends of Pb-Nd isotopic variations of Cenozoic intraplate basalts. Source data are from GEOROC (http://georoc.mpch-mainz.gwdg.de/georoc/). Distributions of MTZ-depth (560 km) high-seismic anomalies (60) are also shown. DTGL-Daxing’anling-Taihangshan gravity lineament, EM1-enriched mantle 1.

References

    1. Richards M. A., Engebretson D. C., Large-scale mantle convection and the history of subduction. Nature 355, 437–440 (1992).
    1. Hofmann A. W., Mantle geochemistry: the message from oceanic volcanism. Nature 385, 219–229 (1997).
    1. Faccenna C., et al. , Subduction-triggered magmatic pulses: A new class of plumes?. Earth Planet. Sci. Lett. 299, 54–68 (2010).
    1. Marquardt H., Miyagi L., Slab stagnation in the shallow lower mantle linked to an increase in mantle viscosity. Nat. Geosci. 8, 311–314 (2015).
    1. Ishii T., et al. , Buoyancy of slabs and plumes enhanced by curved post-garnet phase boundary. Nat. Geosci. 16, 828–832 (2023).

LinkOut - more resources