. 2025 Jan 7;122(1):e2400273121.
doi: 10.1073/pnas.2400273121. Epub 2024 Dec 30.

The origin of color categories

Affiliations

The origin of color categories

Daniel J Garside et al. Proc Natl Acad Sci U S A. .

Abstract

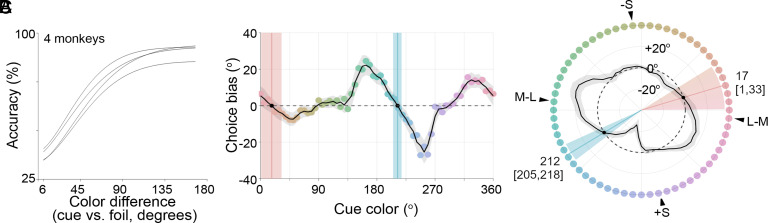
To what extent does concept formation require language? Here, we exploit color to address this question and ask whether macaque monkeys have color concepts evident as categories. Macaques have similar cone photoreceptors and central visual circuits to humans, yet they lack language. Whether Old World monkeys such as macaques have consensus color categories is unresolved, but if they do, then language cannot be required. If macaques do not have color categories, then color categories in humans are unlikely to derive from innate properties of visual encoding and likely to depend on cognitive abilities such as language that differ between monkeys and humans. We tested macaques by adapting a match-to-sample paradigm used in humans to uncover color categories from errors in matches, and we analyzed the data using computational simulations that assess the possibility of unrecognized distortions in the perceptual uniformity of color space. The results provide evidence that humans have consensus cognitive color categories and macaques do not. One animal showed evidence for a private color category, demonstrating that monkeys have the capacity to form color categories even if they do not form consensus color categories. Taken together, the results imply that consensus color categories in humans, for which there is ample evidence, must depend upon language or other cognitive abilities.

Keywords: categorization; color; language.


Conflict of interest statement

Competing interests statement:The authors declare no competing interest.

Figures

Fig. 1.
Fig. 1.
Nonverbal paradigm to recover color categories in nonhuman primates. (A) Predicted distribution of choices for two cues if a color category exists at the specified location in the color space (dashed arrow). The average of the distribution of choices will be biased counterclockwise from the cue if the cue is displaced clockwise to the category center (Top) and biased clockwise from the cue if the cue is displaced counterclockwise to the category center (Bottom). This pattern of results would be captured as the zero-crossing of the negative slope in a plot of the choice bias versus cue color (Right). (B) Predicted pattern of results for three hypotheses: no categories (Top); categories defined by attractors to the four common basic color categories (Middle); and categories defined by repellers to the cone-opponent retinal encoding mechanisms (Bottom). (C) Data obtained in prior work on a related task in human subjects showing evidence of four color categories. Though there are only three zero-crossings in the dataset presented here [that of Bae et al. (43)] the data shows a periodic structure with four cycles, with a fourth attractor point suggested at roughly 180° (green). See SI Appendix, Fig. S2 for two additional datasets in human subjects including the prior work of Panichello et al. (38) and data using the present task; all infer the existence of four consensus color categories. The negative slopes demarking category centers are recovered by tracing the line in a counterclockwise direction, at points where the trace crosses the dashed circle marking zero choice bias. For reference, arrowheads show the colors that would isolate the retinal cone-opponent encoding mechanisms (L − M, M − L, +S, −S; where L, M, S are the three cone types). (D) Sixty-four colors defined in CIELUV color space. (E) Animals were trained to initiate a trial by fixating a small cross on a computer monitor and to maintain fixation throughout the trial until the fixation cross disappeared, which was their instruction to make a choice; trials in which the animals broke fixation were aborted. A 3° diameter cue was presented within the central 2.5 to 6°, followed by a variable memory delay (600 to 900 ms) and the presentation of four choice options. To mitigate impulsive choices, the choice options were shown for a variable amount of time (500 to 1,000 ms) during which the animals needed to maintain fixation to avoid aborting the trial. After the fixation cross disappeared, the animals were free to make their selection.
Fig. 2.
Fig. 2.
Macaque monkeys appear to show two consensus color categories when the data are analyzed with a mixture model that computes the average distribution of the choices for each cue. (A) Psychometric functions for the four animals showing the accuracy of the matches as a function of the difference in hue angle between the cue and the foil that is closest in color to the cue. The easiest trials were defined as those where the foil color nearest to the cue color was almost on the opposite side of the color circle. See SI Appendix, Fig. S1 for 95% CI. (B) Mixture model results averaged across the four animals. The data were subsampled so that the same number of completed trials for each animal (24,526) were included in the analysis, corresponding to [9,475, 9,694, 10,665, 9,783] incorrect trials respectively for PO, CA, BU, MO. Error shading shows 95 %CI. The data recover two significant negative-slope zero-crossings (black dots), corresponding to two color categories. (C) Polar plot of the results in (B) with the zero-crossings of the negative slope (following the trace counterclockwise) again indicated by black dots. The angles of the two inferred color categories [95 % C.I.] are 17 [1, 33] (a peach color) and 212 [205, 218] (a teal color).
Fig. 3.
Fig. 3.
Computational simulations showing that color choice biases recovered by mixture model (43, 45) could be explained by a nonuniformity in the stimulus space, without invoking cognitive mechanisms. (A) Color matches made by an agent with a cognitive color category, using a paradigm with stimuli that uniformly sample a truly uniform perceptual color space (gray circle). The distribution of matches has a peak biased toward the category center. (B) Color matches made by an agent lacking a cognitive color category, with stimuli that nonuniformly sample an underlying uniform color space (gray circle). The distribution of matches is biased toward the densely sampled region of the space because there are more choice options. The average of the distribution of matches is similarly biased counterclockwise to the cue in both a and b, although the similarity functions differ in shape. (C) Mixture-model analysis of a simulated dataset with a cognitive bias; Code for F3c (D) Mixture-model analysis of a simulated dataset with a stimulus space nonuniformity. Code for F3d (E) Similarity matrix for the simulated data analyzed in C; axes are CIELUV color space. Each column shows the similarity function for the corresponding cue on the x axis. The trace shows the similarity function for the cue in A. Note that the shape of the similarity function is symmetric like the distribution of matches. Code for F3e (F) Similarity matrix for the simulated data analyzed in panel D; other details as in E. Code for F3f. The shape of the similarity function is different in E and F, yet both have the same mean bias relative to the cue. The similarity function in F and the distribution of matches in B are both asymmetric but differ in shape because the color spaces are different in B and F.
Fig. 4.
Fig. 4.
Similarity matrices for behavioral data averaged across four monkeys. (A) Data centered on the teal-colored category recovered in the mixture model. (B) Data centered on the peach-colored category recovered in the mixture model. The pattern of results in A and B is better predicted by stimulus space nonuniformity (Fig. 3F) than cognitive bias (Fig. 3E). (C) Negative Log Likelihood (Left) and Bayesian Inference Criterion (BIC, Right) of the fit of the null model and the stimulus-space nonuniformity model. (D) BIC values of the fit provided by the stimulus-space nonuniformity model were always lower than BIC values of the fit for the cognitive bias model for 100 bootstrap repeats of the analysis. For each bootstrap repeat, the number of trials for each animal were the same, set by the animal that completed the smallest total number of completed trials, and that number of trials was drawn with replacement from the total number of completed trials for each animal. The stimulus space nonuniformity model and the cognitive bias model have the same number of parameters. (E) Gaussian fits (extracted from a mixture model) showing broader gaussians at the two attractor points (solid lines) than at cues 90° offset (dashed lines).
Fig. 5.
Fig. 5.
Color-matching data for one monkey (CA) showing evidence for a cognitive color category bias. (A) Mixture-model analysis (same format as Fig. 2C). (B) Free-similarity matrix (same format as Fig. 4 A and B) with an asymmetry in the green region indicated by the cross. (C) Gaussians extracted from the mixture model on either side of the identified attractor point (101°) showing offsets. Plotted curves are for hue angles 90° (Right, offset to positive values) and 112.5° (Left, offset to negative values).
Fig. 6.
Fig. 6.
Reanalysis of the data of Bae et al. (43)—what mechanisms underlie the observed biases? (A) Mixture model analysis of the data of Bae et al. (43) (as in Fig. 1C, reproduced for easy reference). (B) Choice probability matrix (SI Appendix, Fig. S9 of the same data, with the attractor points recovered by the mixture modeling analysis highlighted. (C) Gaussian fits extracted from the mixture model. Above: Gaussians at the attractor points, showing a range of widths. Below: Gaussians at either side (Right, 38° and Left, 70°) of the orange attractor (54°), showing offsets toward the attractor.
Fig. 7.
Fig. 7.
Perceptually uniform color space derived from the color-matching data in macaque monkeys. (A) CIELUV color space with 64 color samples at even intervals in hue angle. (B) The same color samples plotted in the uniform color space derived from macaque monkeys; note that the axes are not CIELUV but MUCS (macaque uniform color space). (C) Colors sampled evenly from the uniform color space derived from macaque monkeys, projected into CIELUV.

References

    1. Berlin B., Kay P., Basic Color Terms: Their Universality and Evolution (University of California Press, Berkeley, CA, 1969).
    1. Heider E. R., Universals in color naming and memory. J. Exp. Psychol. 93, 10–20 (1972). - PubMed
    1. Regier T., Kay P., Cook R. S., Focal colors are universal after all. Proc. Natl. Acad. Sci. U.S.A. 102, 8386–8391 (2005). - PMC - PubMed
    1. Bornstein M. H., Kessen W., Weiskopf S., The Categories of Hue in Infancy. Science 191, 201–202 (1976). - PubMed
    1. Kay P., McDaniel C. K., The linguistic significance of the meanings of basic color terms. Language 54, 610–646 (1978).

LinkOut - more resources