. 2025 Jan 7;122(1):e2420496121.
doi: 10.1073/pnas.2420496121. Epub 2024 Dec 30.

Synapse-specific catecholaminergic modulation of neuronal glutamate release

Affiliations

Synapse-specific catecholaminergic modulation of neuronal glutamate release

Dariya Bakshinska et al. Proc Natl Acad Sci U S A. .

Abstract

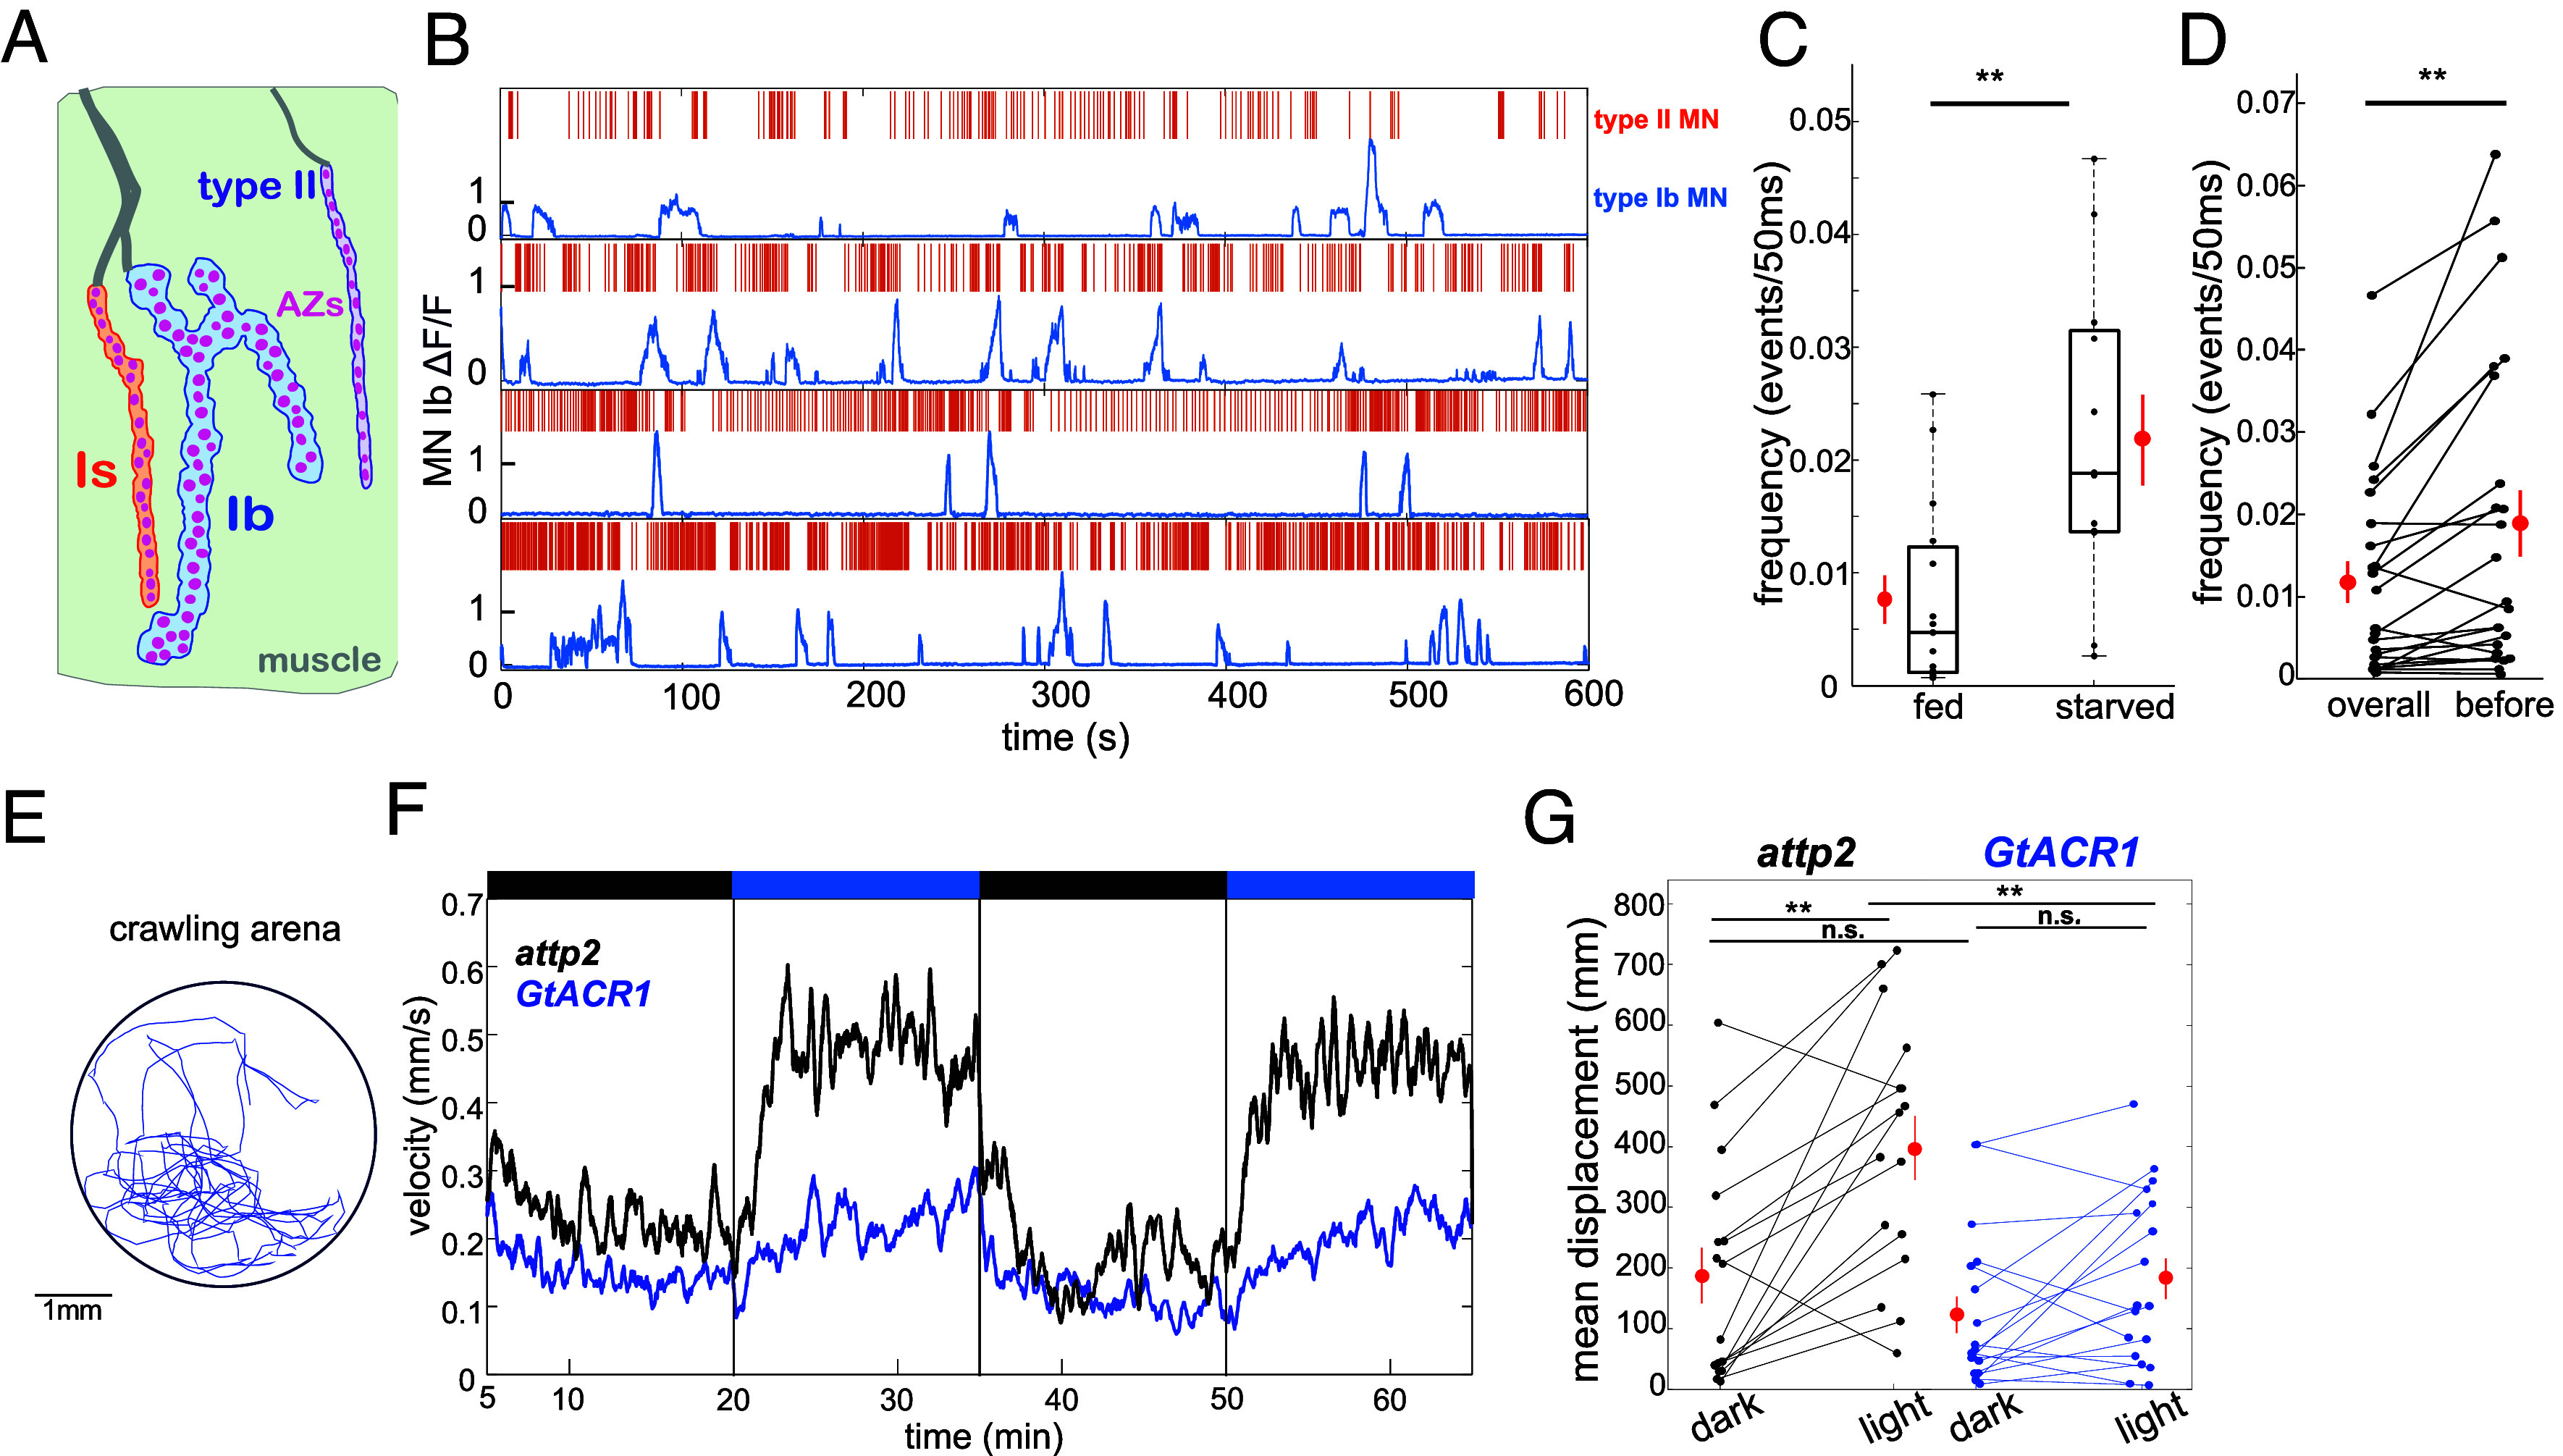
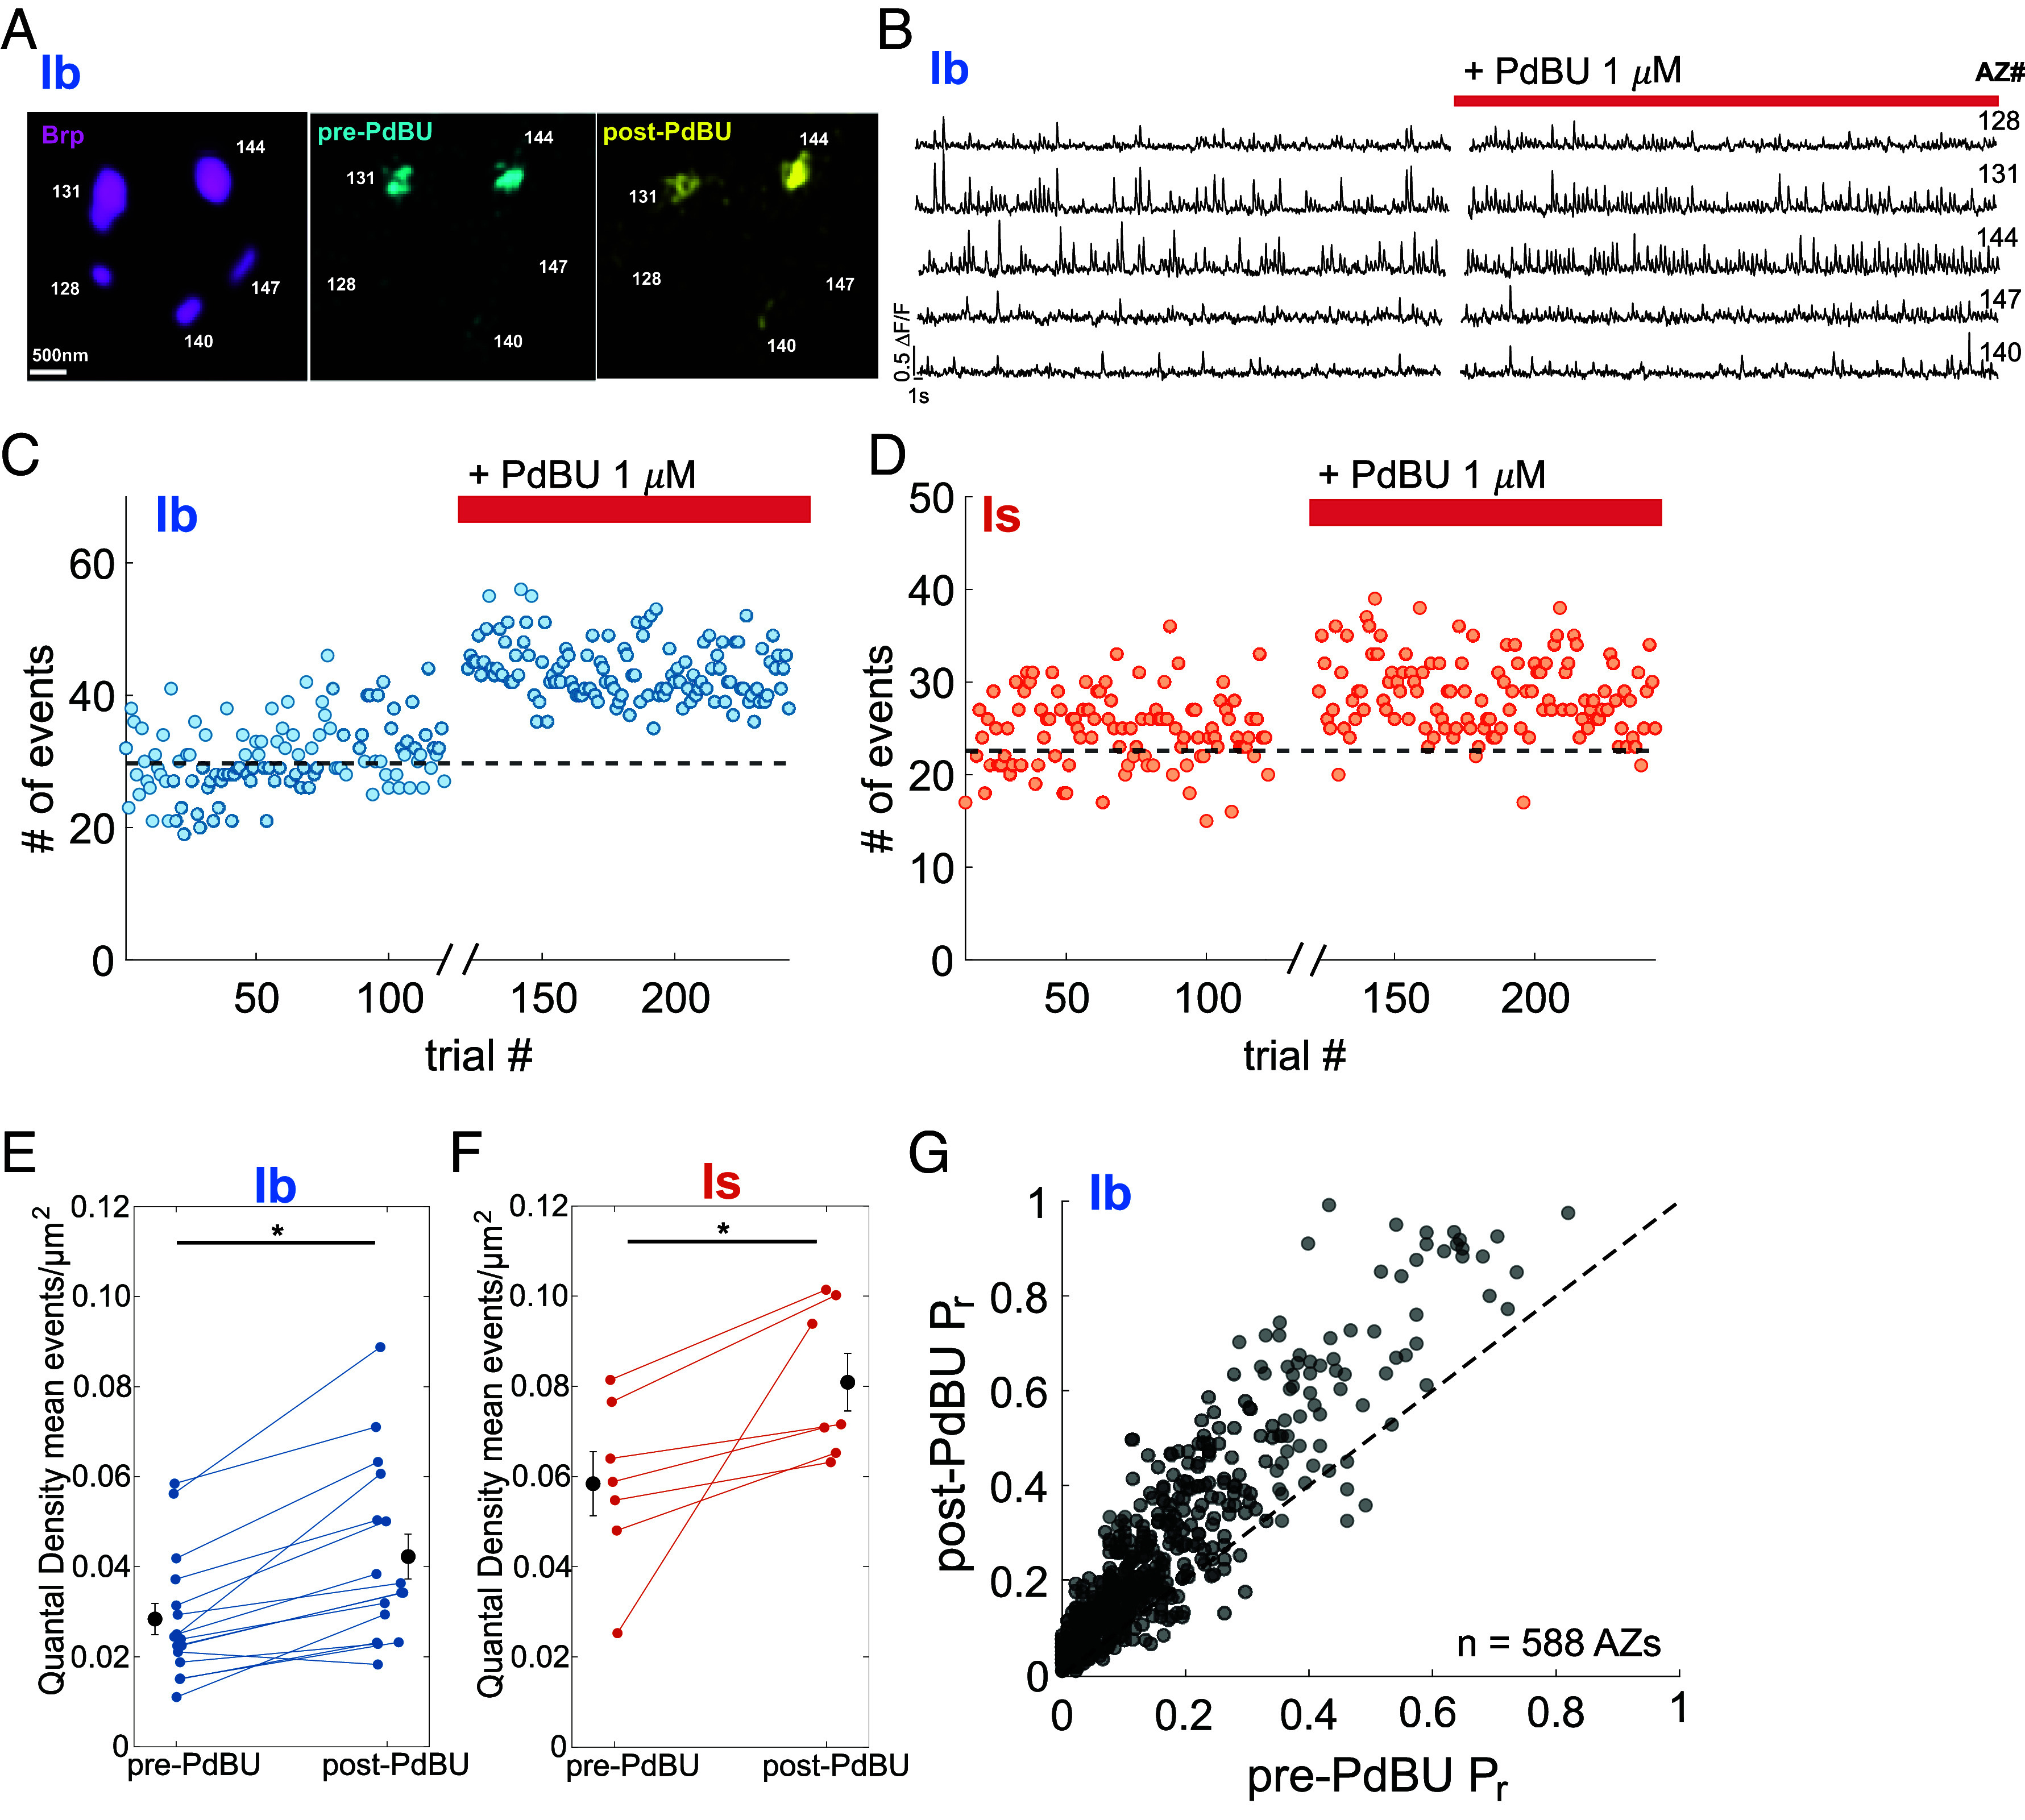
Norepinephrine in vertebrates and its invertebrate analog, octopamine, regulate the activity of neural circuits. We find that, when hungry, Drosophila larvae switch activity in type II octopaminergic motor neurons (MNs) to high-frequency bursts, which coincide with locomotion-driving bursts in type I glutamatergic MNs that converge on the same muscles. Optical quantal analysis across hundreds of synapses simultaneously reveals that octopamine potentiates glutamate release by tonic type Ib MNs, but not phasic type Is MNs, and occurs via the Gq-coupled octopamine receptor (OAMB). OAMB is more abundant in type Ib terminals and acts through diacylglycerol and its target Unc13A, a key component of the glutamate release machinery. Potentiation varies significantly-by up to 1,000%-across synapses of a single Ib axon, with synaptic Unc13A levels determining both release probability and potentiation. We propose that a dual molecular mechanism-an upstream neuromodulator receptor and a downstream transmitter release controller-fine-tunes catecholaminergic modulation so that strong tonic synapses exhibit large potentiation, while weaker tonic and all phasic synapses maintain consistency, yielding a sophisticated regulation of locomotor behavior.

Keywords: QuaSOR; Unc13; glutamate; octopamine; synapse.


Conflict of interest statement

Competing interests statement:The authors declare no competing interest.

Figures

Fig. 1.
Fig. 1.
Type II MN firing frequency increases before Ib bursts and inhibition of type II MNs reduces locomotion. (A) Schematic depicting the Drosophila NMJ illustrating type II MN (purple), type I MNs: Ib (blue), and Is (orange) synapsing onto the same muscle. Individual active zones (AZs) are shown in magenta. (B) Examples from 4 starved animals showing type II MN activity, measured by cytosolic GCaMP6f (Upper orange ticks; each tick represents the first frame of a type II MN firing bout) and corresponding Ib MN synaptic transmission bout, measured by SynapGCaMP6f concentrated in the muscle postsynaptic density (lower blue trace). (C) Box plot showing frequency (# of events/50 ms) of type II firing in fed (n = 15) vs. starved animals (n = 12). Red points are mean ± S.E.M. (**P <0.01 by the Wilcoxon signed-rank test.) (D) Frequency of type II MN firing in 8 s prior to a Ib MN bout (before) compared to firing over the entire 600 s recording (overall) (n = 23). Red points are mean ± S.E.M. (**P <0.01 by the Wilcoxon signed-rank test.) (E) Example a larval track registered in the locomotion assay. (F) Mean crawling velocity of control attp2 larvae (black trace, n = 16) and larvae expressing the inhibitory GtACR1 in type II MNs (blue trace, n = 18). Recording starts at 5 min. to account for an adjustment period. Black bars above represent dark; blue bars represent illumination with 505 nm light. (G) Mean displacement for each animal in (F), across the two dark and two light (505 nm) periods for attp2 (n = 16) and GtACR1 (n = 18) animals. Red points are mean ± S.E.M. (**P <0.01; n.s., not significant by Student’s paired t-test).
Fig. 2.
Fig. 2.
OA potentiates release from type Ib MN but not type Is MN. (A) Left: Example Ib bouton stained post hoc for the AZ scaffolding protein Bruchpilot (Brp, magenta). Each magenta punctum is an AZ. Middle and Right: Transmission event maps evoked by 0.2 Hz stimulation before addition of OA (Middle) and in presence of OA (Right). (Scale bar, 0.5 μm.) (B) SynapGCaMP6f ∆F/F recording of Ib MN glutamate transmission events from the three identified AZs in (A) before OA and 10 min after the addition of 10 μM OA (red bar). Quantal events were identified by fits to a single ΔF response template, with highly correlated pixels and frames flagged as active if they had ΔF/F amplitudes that were above a minimum threshold (typically between 0.04 and 0.05 ΔF/F) and at least 1.5 to 2 times larger than the SD of the values at that pixel. (See Materials and Methods). (C) Relationship between Pr before and after OA for individual wildtype Ib MN AZs (n = 519 AZs from 4 animals, 1 NMJ each). The dashed black line is y = x. AZ#s 148, 150, and 153 from (A) and (B) shown as red dots. (D and E) Raw ∆F/F glutamate transmission events in response to MN nerve stimulation at 0.2 Hz during 10 min basal (pre-OA) period and in OA (OA: 10 μM) (post-OA; red bar), following a 10 min incubation period without stimulation (break in the x-axis). Ib MN (D) and Is MN (E), which innervate the same muscle, are imaged simultaneously. The dashed black line indicates mean number of events per trial before OA. (F and G) OA-induced change in quantal density (QD) (mean # of events per stimulus/μm2) for Ib MNs (n = 8 NMJs) (F) and Is MNs (n = 7 NMJs) (G) from the same muscle, except in one case where only Ib MN was imaged. Error bars are mean ± S.E.M. (* P < 0.05; n.s., not significant by the paired t-test). (H) Change in Pr (post-OA Pr – pre-OA Pr) binned by normalized Brp amount. Vertical error bars are mean change in Pr ± S.E.M. Horizontal error bars are mean normalized Brp ± S.E.M. The red dashed curve is sigmoidal fit to Change in Pr: y=0.04/(1+e-x-0.433.4). Sum of squared estimate of errors (S.S.E.) = 5.4 × 10⁻⁴.
Fig. 3.
Fig. 3.
Type I MNs OA receptors include OAMB, which is enriched in the Ib MN and needed to boost locomotion. (A) RNAseq shows expression of five OA receptors in type I MNs. The dashed line shows the maximum normalized counts of any gene observed in attp2 controls. Error bars are ± S.E.M (B) Example image of an NMJ showing a maximum projection confocal image of OAMB receptor staining (green) in a Ib and Is MN pair. Animals had the OAMB receptor CRISPR tagged with 10 copies of the V5 epitope. Staining was against the V5 epitope. (Scale bar, 5 μm.) (C) Bar graph shows the mean ± 95% CI of the mean OAMB staining levels (A.U. arbitrary units) per Ib and Is MNs. Each Ib and Is were paired on the same muscle (10 NMJs, 1 per animal). (**** P <0.0001 by the paired t-test). (D) Mean velocity (mm/s) of control larvae (attp2) (black, n = 15) and animals with OAMB knocked down in type I MNs (oambRNAi; blue, n = 14) crawling in the dark (black bar) followed by under 505 nm light (blue bar). Recording starts at 5 min., following an adjustment period. (E) Mean total displacement for each animal in (D). Attp2 (black, n = 15 animals), oambRNAi (blue, n =14 animals). Red points are mean ± S.E.M. (*** P <0.001; ** P <0.01; n.s., not significant by Student’s paired t-test).
Fig. 4.
Fig. 4.
OA potentiation of release is mediated by the Gq-coupled OAMB receptor and PLC. (AD) Knockdown of OAMB in type I MNs (OK6>Gal4; UAS>oambRNAi) eliminates potentiation of release by 10 μM OA from type Ib MN synapses with no effect on Is MN synapses, which normally lack OA potentiation. (A and B) SynapGCaMP6f ∆F/F type I MN glutamate transmission events in response to nerve stimulation at 0.2 Hz during 10 min basal period, followed by a 10 min interval in presence of OA (no imaging, no stimulation, break in the x-axis), followed by 10 min of measurement of glutamate transmission in continued presence of OA. Raw glutamate transmission event counts per trial in response to stimulation at 0.2 Hz for an example Ib MN (A) and the Is MN (B) innervating the same muscle. Dashed black lines indicate mean number of events per trial before OA. (C and D) QD (mean # of events per trial/μm2) for Ib MN (C) and Is MN (D) pairs (n = 6 NMJs, 1 from each animal). Error bars are mean ± S.E.M. (n.s., not significant by the paired t-test). (E and F) Block of PLC eliminates OA potentiation. (E) Example wt Ib MN glutamate transmission events counts per trial, starting with 0.2 Hz stimulation during baseline period, switching to incubation with PLC blocker U73122 (no imaging, no stimulation, 10 min break in the x-axis), followed by 0.2 Hz stimulation in continued presence of U73122, followed by addition of OA (no imaging, no stimulation, 10 min break in the x-axis), followed by 0.2 Hz stimulation in the continued presence of U73122 + OA. (F) Summary of four wt NMJs, including that shown in (E), shows no significant change in QD in response to OA when preincubated with U73122. Points in black with error bars show mean QD ± S.E.M. (n.s., not significant by Student’s paired t-test).
Fig. 5.
Fig. 5.
Membrane-permeable DAG mimic PdBU potentiates release from both type Ib and Is synapses. (AD) 10 min baseline period followed 6 min interval (no imaging, no stimulation, addition of PdBU, x-axis break), followed by stimulation at 0.2 Hz stimulation in continued presence of PdBU. (A) Images of single Ib MN bouton showing AZ location (Left, Brp in magenta) in relation to glutamate transmission events evoked by 0.2 Hz stimulation in baseline period (Middle, cyan) and after addition of 1 μM PdBU (Right, yellow). (Scale bar, 500 nm.) (B) SynapGCaMP6f ∆F/F glutamate transmission events in response to MN nerve stimulation at 0.2 Hz for AZs shown in (A). Vertical (Scale bar, 0.5) ∆F/F. Horizontal (Scale bar, 1 s.) (C and D) Number of glutamate transmission events per stimulus over entire NMJ during stimulation at 0.2 Hz for an example muscle showing the Ib MN (C) and the Is MN (D). The dashed black line is the mean number of events per trial before PdBU. (E and F) Quantal densities (mean # of transmission events in entire NMJ per stimulus/μm2) for Ib MNs (n = 15 NMJs) (E) and Is MNs (n = 7 NMJs) (F), where each of the Is MNs was recorded simultaneously from muscle with shown Ib. Error bars are mean ± S.E.M. (* P < 0.05 by the paired t-test.) (G) Relationship between Pr during baseline period (pre-PdBU) and following addition of PdBU (post-PdBU) for individual wt Ib MN AZs (n = 588, from 5 NMJs, 1 per animal, with AZ-matched QuaSOR analysis). The dashed black line is y = x.
Fig. 6.
Fig. 6.
Unc13A is the PdBU target that boosts glutamate release in Ib synapses. (A and B) Raw event counts per trial to examine PdBU effect on example unc13ARNAi Ib MN (A) and unc13BRNAi Ib MN (B). Break in the x-axis marks addition of PdBU (1 μM) followed by a 10 min period of transmission imaging in continued presence of PdBU. The dashed black line is mean number of events per trial before PdBU. (C) Cumulative probability of basal Pr distributions for individual Ib AZs. Basal Pr distributions are significantly different by a two-sample Kolmogorov–Smirnov test: p = 3.78 × 10⁻¹⁶ for wt (gray, same AZs as in Fig. 5 G) vs unc13BRNAi (green), P = 9.31 × 10−53 for wt (gray) vs unc13ARNAi (yellow) and P = 4.19 × 10−83 for unc13BRNAi (green) vs unc13ARNAi (yellow). (D and E) Relation of basal Pr (pre-PdBU) to PdBU-potentiated Pr (post-PdBU) for individual Ib MN AZs in unc13ARNAi (n = 344, from 3 NMJs) (D) and unc13BRNAi Ib MN AZs (n = 393, from 3 NMJs) (E). The dashed black line is y = x. (F) Change in Prpost-PdBU distributions for individual Ib AZs. Change in Pr distributions are significantly different by a two-sample Kolmogorov–Smirnov test: P = 2.5 × 10⁻⁴ for wt vs unc13BRNAi, P = 4.97 × 10−54 for wt (gray) vs unc13ARNA i(yellow) and P = 5.54 × 10−49 for unc13BRNAi (green) vs unc13ARNAi (yellow). (G and H) QD for Ib MNs in unc13ARNAi animals (G; n = 8 NMJs) and unc13BRNAi animals (H; n = 6 NMJs) before and after addition of PdBU (1 μM). Black symbols with error bars are mean QD ± S.E.M. (n.s. is not significant; * P < 0.05 by Student’s paired t-test). (I) Scatter showing the relationship between change in Pr (post-PdBU Pr – pre-PdBU Pr) and Unc13A amount in arbitrary units (A.U.) for individual AZs pooled from Ib MNs in three genotypes: unc13ARNAi (yellow) unc13BRNAi (green) and wt (black). The dashed line is y = 0, representing no change. (J) Unc13A-dependent change in Pr induced by PdBU in potentiated synapses pooled from the three different genotypes (n = 1137 AZs from 11 NMJs: 5 wt, 3 unc13BRNAi, 3 unc13ARNAi). Left axis: number of AZs per bin. Right axis: change in Pr (filled circles). Vertical error bars are mean Pr ± SEM. Horizontal error bars are mean normalized Unc13A ± S.E.M. The red line is an exponential fit: y=(0.21(1+e-x-2.210-7) + 0.01). S.S.E. = 0.032. (K) Raw event counts per trial for example unc13ARNAi + unc13AH1723K Ib MN, where native Unc13A is knocked down by RNAi and an RNAi-proof Unc13A with a mutation at the DAG binding site is expressed in type I MNs. Note restoration of baseline event counts to normal levels. The dashed black line is the mean number of events per trial before PdBU. (L) QD for Ib MNs in unc13ARNAi + unc13AH1723K animals before and after PdBU (1 μM) (n = 7 NMJs). Black symbols with error bars are mean QD ± S.E.M. (n.s. is not significant by Student’s paired t- test).
Fig. 7.
Fig. 7.
Potentiation by OA depends on presynaptic DAG modulation of Unc13A. (A and B) Raw event counts per trial for example unc13ARNAi Ib MN (A) and unc13BRNAi Ib MN (B). (C) QD for Ib MNs in unc13ARNAi animals before and after addition of OA (10 μM) (n = 7 NMJs). Error bars on the sides are mean QDs ± SEM. (n.s. is not significant by Student’s paired t- test). (D) Unc13A-dependent change in Pr induced by OA. Left axis: number of AZs per bin. Right axis: change in Pr (post-OA Pr - pre-OA Pr) filled circles. Vertical error bars are mean Pr ± SEM. Horizontal error bars are mean normalized Unc13A ± SEM. (n = 588 AZs from 5 NMJs). The red line is sigmoidal fit: y=0.05/(1+e-x-0.377.2). S.S.E. = 1.7 × 10⁻³. (E) Raw event counts per trial for an example unc13ARNAi + unc13AH1723K Ib MN. The dashed black line is the mean number of events per trial before OA. (F) QD for Ib MNs in unc13ARNAi + unc13AH1723K animals before and after OA (10 μM) (n = 6 NMJs). Black symbols with error bars on the sides are QDs ± S.E.M. (n.s. is not significant by Student’s paired t-test).
Fig. 8.
Fig. 8.
Model of peripheral catecholaminergic locomotion boost. (A) Hunger or blue light (and, likely, other signals) activate type II MN and boost locomotion (e.g. for foraging or escape) by switching the firing of octopaminergic type II MNs from low frequency tonic activity to high frequency bursts timed to precede and overlap with the locomotory bouts of glutamatergic transmission from type I MNs. (B) At the NMJ level, the boost in type II MN activity, described in (A), increases the release of OA from type II MNs. (C) At the individual AZ (synaptic) level, OA released from type II MN binds to the Gq-coupled OAMB (octopamine receptor) in type Ib MN presynaptic nerve terminals, activating phospholipase (PLC), which breaks down PI4,5P2 (PIP2) to generate IP3 and DAG. DAG binds to Unc13A and promotes its synaptic vesicle superpriming activity leading to increased release of glutamate and increased locomotion. OAMB expression is too low in type Is MN axons to support OA potentiation, resulting in potentiation of type Ib transmission and constancy of type Is transmission.

References

    1. Ranjbar-Slamloo Y., Fazlali Z., Dopamine and noradrenaline in the brain; Overlapping or dissociate functions? Front. Mol. Neurosci. 12, 334 (2020). - PMC - PubMed
    1. O’Donnell J., Zeppenfeld D., McConnell E., Pena S., Nedergaard M., Norepinephrine: A neuromodulator that boosts the function of multiple cell types to optimize CNS performance. Neurochem. Res. 37, 2496–2512 (2012). - PMC - PubMed
    1. Hartenstein V., Cruz L., Lovick J. K., Guo M., Developmental analysis of the dopamine-containing neurons of the Drosophila brain. J. Comp. Neurol. 525, 363–379 (2017). - PMC - PubMed
    1. Selcho M., Pauls D., Huser A., Stocker R. F., Thum A. S., Characterization of the octopaminergic and tyraminergic neurons in the central brain of Drosophila larvae. J. Comp. Neurol. 522, 3485–3500 (2014). - PubMed
    1. Koon A. C., Budnik V., Inhibitory control of synaptic and behavioral plasticity by octopaminergic signaling. J. Neurosci. 32, 6312–6322 (2012). - PMC - PubMed

MeSH terms

LinkOut - more resources