. 2025 Jan 14;122(2):e2411816122.
doi: 10.1073/pnas.2411816122. Epub 2024 Dec 30.

A conifer metabolite corrects episodic ataxia type 1 by voltage sensor-mediated ligand activation of Kv1.1

Affiliations

A conifer metabolite corrects episodic ataxia type 1 by voltage sensor-mediated ligand activation of Kv1.1

Rían W Manville et al. Proc Natl Acad Sci U S A. .

Abstract

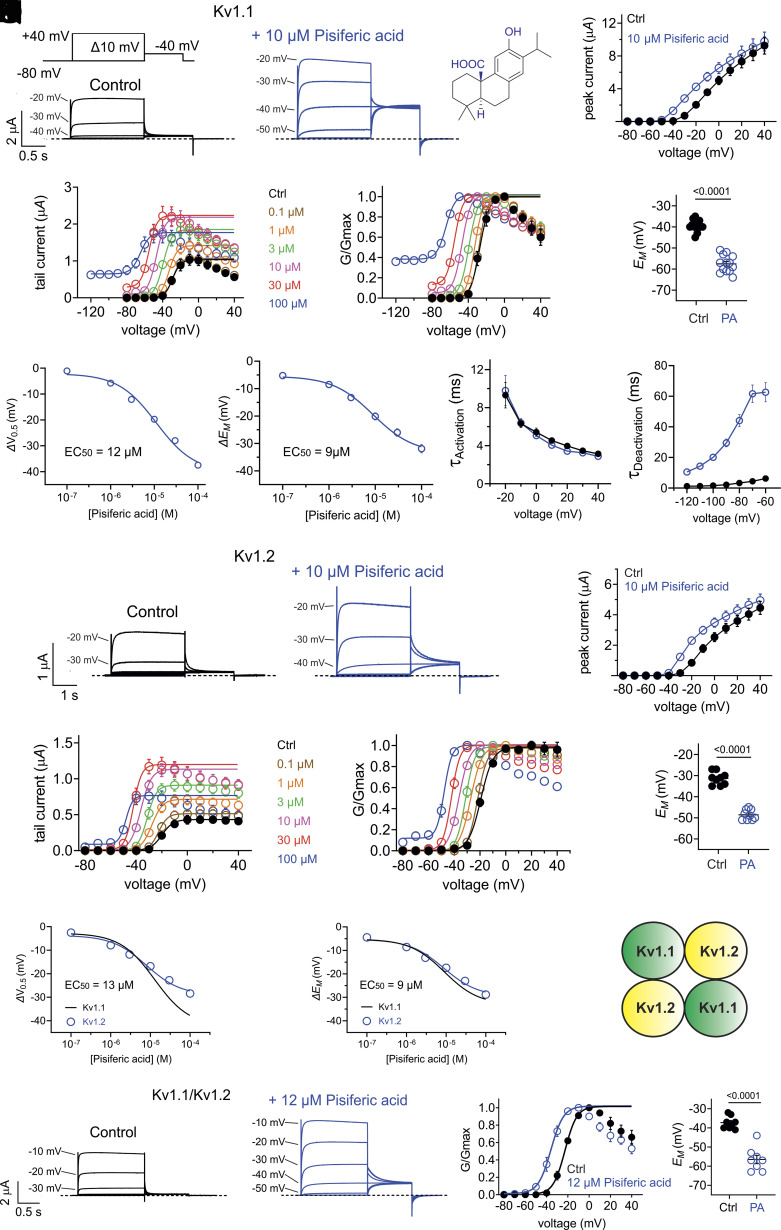
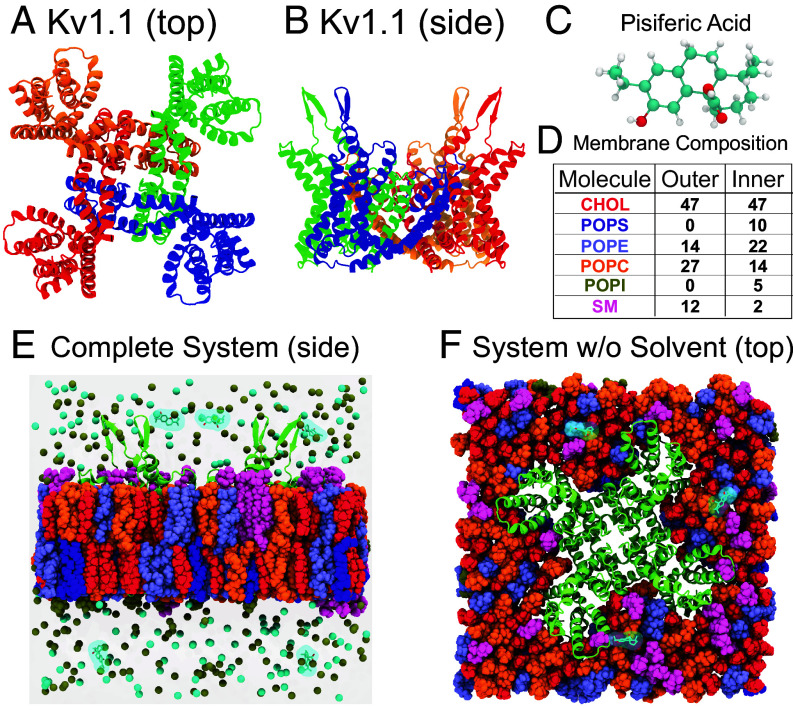
Loss-of-function sequence variants in KCNA1, which encodes the voltage-gated potassium channel Kv1.1, cause Episodic Ataxia Type 1 (EA1) and epilepsy. Due to a paucity of drugs that directly rescue mutant Kv1.1 channel function, current therapeutic strategies for KCNA1-linked disorders involve indirect modulation of neuronal excitability. Native Americans have traditionally used conifer extracts to treat paralysis, weakness, and pain, all of which may involve altered electrical activity and/or Kv1.1 dysfunction specifically. Here, screening conifer extracts, we found that Chamaecyparis pisifera increases wild-type (WT) Kv1.1 activity, as does its prominent metabolite, the abietane diterpenoid pisiferic acid. Uniquely, pisiferic acid also restored function in 12/12 EA1-linked mutant Kv1.1 channels tested in vitro. Crucially, pisiferic acid (1 mg/kg) restored WT function in Kv1.1E283K/+ mice, a model of human EA1. Experimentally validated all-atom molecular dynamics simulations in a neuron-like membrane revealed that the Kv1.1 voltage-sensing domain (VSD) also acts as a ligand-binding domain akin to those of classic ligand-gated channels; binding of pisiferic acid induces a conformational shift in the VSD that ligand-dependently opens the pore. Conifer metabolite pisiferic acid is a promising and versatile therapeutic lead for EA1 and other Kv1.1-linked disorders.

Keywords: KCNA1; Kv1.1; episodic ataxia; potassium channel; voltage gating.


Conflict of interest statement

Competing interests statement:The authors declare no competing interest.

Figures

Fig. 1.
Fig. 1.
Conifer extract screening for Kv1.1 opening activity. Error bars indicate SEM. n indicates number of biologically independent oocytes. At least 2 batches of oocytes were used per experiment. Statistical comparisons by the two-tailed paired t test. Dashed lines indicate zero current line here and throughout. (A) Geographical location of wild sources of Californian conifer samples (Left) and native range of commercially sourced C. pisifera (Right). Maps created with BioRender.com. (B) Conifers from which samples were taken for analysis. Photos taken by senior author (GWA). (C) Mean traces for Kv1.1 expressed in oocytes in the absence (Control) or presence of 1:50 dilution conifer extracts as indicated. Scale bars Upper Right for each pair of traces; voltage protocol Upper Left Inset; n = 5-8 per group. Arrows indicate where tail current measurements are made for G/Gmax plots. (D) Mean normalized tail current (G/Gmax) for traces as in (C); n = 5-8 per group. (E) Mean unclamped oocyte membrane potential for oocytes as in (C); n = 5-8 per group.
Fig. 2.
Fig. 2.
Selection of optimal conifer extract for Kv1.1 activation. Error bars indicate SEM. n indicates number of biologically independent oocytes. At least 2 batches of oocytes were used per experiment. Statistical comparisons by the two-tailed paired t test. (A) Shift in midpoint voltage dependence of activation (V0.5act) induced by 1/50 conifer extracts from Fig. 1, analyzed from recordings as in Fig. 1. (B) Shifts in activation rates induced by 1/50 conifer extracts from Fig. 1, analyzed from recordings as in Fig. 1. (C) Mean traces for Kv1.2 expressed in oocytes in the absence (Control) or presence of conifer extracts indicated (1/50 dilution). Scale bars Upper Right for each trace; voltage protocol Upper Inset; n = 5-8 per group. (D) Mean normalized tail current (G/Gmax) for traces as in (C); n = 5-8 per group. (E) Mean unclamped oocyte membrane potential for oocytes as in (C); n = 5-8 per group. (F) Mean traces for Kv1.1/Kv1.2 heteromers expressed in oocytes in the absence (Control) or presence of C. pisifera extract (1/50 dilution). Scale bars Upper Right for each trace; n = 8 per group. (G) Mean normalized tail current (G/Gmax) for traces as in (F); n = 8 per group. (H) Mean unclamped oocyte membrane potential for oocytes as in (F); n = 8 per group. (I) Mean traces for homomeric, heterozygous Kv1.1/Kv1.1-V408A channels expressed in oocytes in the absence (Control) or presence of C. pisifera extract (1/50 dilution). Scale bars Upper Right for each trace; n = 6 per group. (J) Mean normalized tail current (G/Gmax) for traces as in (I); n = 6 per group. (K) Mean unclamped oocyte membrane potential for oocytes as in (I); n = 6 per group.
Fig. 3.
Fig. 3.
C. pisifera metabolite pisiferic acid activates homomeric and heteromeric WT Kv1.1 and Kv1.2 channels. Error bars indicate SEM. n indicates number of biologically independent oocytes. At least 2 batches of oocytes were used per experiment. Statistical comparisons by the two-tailed paired t test. (A) Mean traces for Kv1.1 expressed in oocytes in the absence (Control) or presence of pisiferic acid (10 µM; structure shown in Upper Right Inset). Scale bars Lower Left; voltage protocol Upper Left Inset applies to all recordings in this figure; n = 13 per group. (B) Mean peak prepulse current for traces as in panel (A); n = 13 per group. (C) Mean tail current versus prepulse voltage using voltage protocol as in (A), for Kv1.1 in the absence or presence of pisiferic acid at concentrations indicated; n = 8 per group. (D) Mean normalized tail current (G/Gmax) versus prepulse voltage using voltage protocol as in (A), for Kv1.1 in the absence or presence of pisiferic acid at concentrations indicated; n = 8 per group. (E) Mean unclamped oocyte membrane potential for oocytes as in (A); n = 13 per group. (F) Shift in V0.5act versus [pisiferic acid] for Kv1.1 channels, recorded as in (C); n = 8 per group. (G) Shift in EM versus [pisiferic acid] for Kv1.1 channels, recorded as in (C); n = 8 per group. (H) Activation rate (Τactivation) versus voltage for Kv1.1 in the absence (black) or presence (blue) of pisiferic acid (12 µM), recorded from traces as in (A); n = 8 per group. (I) Deactivation rate (Τdeactivation) versus voltage for Kv1.1 in the absence (black) or presence (blue) of pisiferic acid (12 µM); n = 6 per group. (J) Mean traces for Kv1.2 expressed in oocytes in the absence (Control) or presence of pisiferic acid (10 µM). Scale bars Lower Left; n = 9 per group. (K) Mean peak prepulse Kv1.2 current for traces as in panel (J); n = 9 per group. (L) Mean Kv1.2 tail current versus prepulse voltage, in the absence or presence of pisiferic acid at concentrations indicated; n = 6-7 per group. (M) Mean Kv1.2 normalized tail current (G/Gmax) versus prepulse voltage, in the absence or presence of pisiferic acid at concentrations indicated; n = 6 per group. (N) Mean unclamped oocyte membrane potential for oocytes as in (J); n = 9 per group. (O) Shift in V0.5act versus [pisiferic acid] for Kv1.2 channels; n = 6-7 per group. (P) Shift in EM versus [pisiferic acid] for Kv1.2 channels; n = 6-7 per group. (Q) Cartoon representation of one possible subunit composition of heteromeric Kv1.1/Kv1.2 channels studied in panels (RT). (R) Mean traces for Kv1.1/Kv1.2 heteromers expressed in oocytes in the absence (Control) or presence of pisiferic acid (12 µM). Scale bars Lower Left; n = 8 per group. (S) Mean Kv1.1/Kv1.2 normalized tail current (G/Gmax) versus prepulse voltage for traces as in (R); n = 8 per group. (T) Mean unclamped oocyte membrane potential for oocytes as in (R); n = 8 per group.
Fig. 4.
Fig. 4.
Pisiferic acid improves function in 12/12 EA1 mutant heteromeric, heterozygous Kv1.1/Kv1.2 channels tested. Error bars indicate SEM. n indicates number of biologically independent oocytes. At least 2 batches of oocytes were used per experiment. Statistical comparisons by the two-tailed paired t test. (A) Mean traces for heteromeric, heterozygous EA1 mutant Kv1.1/Kv1.2 channels (schematic of one possible subunit composition, Upper Left Inset) expressed in oocytes in the absence (Control) or presence of pisiferic acid (12 µM). Scale bars Upper Right; voltage protocol Left Inset; n = 9-10 per group. (B) Mean normalized tail current (G/Gmax) versus prepulse voltage for traces as in (A), in the absence or presence of pisiferic acid (12 µM); n = 9-10 per group. (C) Mean unclamped oocyte membrane potential for oocytes as in a versus untreated WT; n = 9-10 per group. Magenta bars indicate where WT mean data were taken from panels above in cases where recordings were conducted in the same date ranges; n = 18. (D) EA1 mutant heteromeric, heterozygous Kv1.1/Kv1.2 channel peak current at −20 or −30 mV normalized to WT Kv1.1/Kv1.2 current for mutants indicated, recorded using voltage protocol shown in panel (A); n = 6-13 per group. (E) Current fold-increase at −20 or −30 mV induced by 12 µM pisiferic acid for EA1 mutant heteromeric, heterozygous Kv1.1/Kv1.2 channels indicated, recorded using voltage protocol shown in panel (A); n = 6-13 per group. Dashed line, 12 µM pisiferic acid-induced fold-increase in WT Kv1.1/Kv1.2 current. (F) Shift in V0.5act compared to WT Kv1.1/Kv1.2 for EA1 mutant heteromeric, heterozygous Kv1.1 channels, recorded using voltage protocol shown in panel (A); n = 6-13 per group. (G) Shift in V0.5act induced by 12 µM pisiferic acid for EA1 mutant heteromeric, heterozygous Kv1.1/Kv1.2 channels indicated, recorded using voltage protocol shown in panel (A); n = 6-13 per group. (H) Topology schematic of Kv1.1 showing locations of EA1 mutations studied in this project. Green, mutations for which pisiferic acid (12 µM) partially or fully corrected function in heteromeric, heterozygous Kv1.1/Kv1.2 channels.
Fig. 5.
Fig. 5.
Pisiferic acid restores normal function in vivo in a mouse model of human Episodic Ataxia 1. (A and B) Kcna1-E283K mouse performance in an accelerating rotarod paradigm. (A) Kcna1E283K/+ mice fell from the rotarod (cartoon, Right Inset) significantly earlier than their WT Kcna1+/+ counterparts (t = 2.223, df = 17, P = 0.0401; n = 8-11 per group). (B) When treated with 1 mg/kg pisiferic acid, there was no longer a statistically significant difference between Kcna1E283K/+ and Kcna1+/+ mice (t = 0.7009, df = 28, P = 0.4891; n = 10-20 per group). (C and D) Kcna1-E283K mouse performance in a balance beam paradigm. (C) Prior to isoproterenol challenge, there was no difference in the number of hindfoot missteps while crossing the balance beam (cartoon, Upper Right Inset) between Kcna1E283K/+ mice and their WT Kcna1+/+ counterparts (t = 0.9453, df = 35, P = 0.3510; n = 15-22 per group). (D) Following isoproterenol challenge, there was a significant interaction between the effects of genotype and treatment (F1,33 = 4.207, P = 0.0483; n = 7-11 per group). When treated with 1 mg/kg pisiferic acid, the number of hindfoot missteps in Kcna1E283K/+ mice is significantly reduced compared to vehicle treatment (P = 0.025). Cartoon images created using Biorender.com.
Fig. 6.
Fig. 6.
Pisiferic acid does not require the gallic acid binding site for its effects on Kv1.1. Error bars indicate SEM. n indicates number of biologically independent oocytes. At least 2 batches of oocytes were used per experiment. Statistical comparisons by the two-tailed paired t test. (A) Sequence alignment of human Kv1.1 and Kv1.2 partial S1 and S1-S2 linker with notable Kv1.2-specific sequence differences colored (cyan versus red). (B) SwissDock results for unbiased docking of gallic acid (GA; blue) to the AlphaFold-predicted structure of Kv1.1. VSD helices are individually labeled and colored. Previously reported in ref. . (C) Mean traces for Kv1.1-I182S,E192I,K195N (Kv1.1-3M) channels expressed in oocytes in the absence (Control) or presence of pisiferic acid (12 µM). Scale bars Lower Left; voltage protocol Upper Inset; n = 11 per group. (D) Mean peak current (measured during prepulse) from traces as in (C); n = 11 per group. (E) Mean normalized tail current (G/Gmax) versus prepulse voltage for traces as in (C), in the absence or presence of pisiferic acid (12 µM); n = 11 per group. (F) Mean unclamped oocyte membrane potential for oocytes as in (C); n = 11 per group. PA, pisiferic acid (12 µM).
Fig. 7.
Fig. 7.
All-atom molecular dynamics of the Kv1.1 ion channel. (A) Top view of a model of the Kv1.1 tetramer constructed using AlphaFold and alignment to the X-ray crystallographic structure of Kv1.2 (PDB ID: 2A79). (B) Side view of the same complex. (C) A ball-and-stick representation of a single pisiferic acid molecule. (D) The lipid composition of an asymmetric lipid bilayer found in neurons. Values in the table express the concentration of each component in terms of percentage of the total number of molecules in each layer, which corresponds to a mixture of 94 CHOL, 28 POPE, 54 POPC, and 24 SM molecules in the upper leaflet and 94 CHOL, 20 POPS, 44 POPE, 28 POPC, 10 POPI, and 4 SM molecules in the lower leaflet. (E) Side view of Kv1.1 channel embedded in the lipid membrane with 5 molecules of pisiferic acid and 150 mM KCl. Lipids are colored as in (D). (F) Top view of Kv1.1 embedded in an asymmetric lipid bilayer found in neurons with lipid species colored as in (D).
Fig. 8.
Fig. 8.
MD simulations reveal the mechanism of pisiferic acid binding to the VSD of Kv1.1. (A) Expanded view of the S1–S4 helices and pisiferic acid in bulk solvent. Dashed lines correspond to the area in (B). (B) Close-up view of pisiferic acid. The ligand contacts and interacts with E283 and Q284 at the S4 helix. (C) Pisiferic acid shifts and enters a solvent-exposed cavity in the VSD. (DF) L288, L291, and R292 coordinate the ligand as it reaches the binding pocket and (G) adopts a metastable configuration coordinated by K193, R295, and E187. (H and I) The ligand flips prior to settling in the stably bound pose (J), and remains in this conformation for the remainder of the simulation (K). (L) Expanded view of the ligand bound to the VSD.
Fig. 9.
Fig. 9.
Comparison of the conformational changes in Kv1.1 upon ligand binding. (A) Top view of the VSD prior (green) and after pisiferic acid stably binds (orange). The bound conformation was measured after 184 ns of MD simulations. (B) Side view of the apo Kv1.1 VSD and bound Kv1.1 VSD. Pisiferic acid binding to the VSD of Kv1.1 induces a conformational change in the S3 and S4 helices. Rotation of the S3 and S4 helices applies a torque to the S4-S5 linker, creating tension on the pore-forming helices.
Fig. 10.
Fig. 10.
Ligand density maps, residence time calculations, and experimental validation of MD simulations of pisiferic acid binding to Kv1.1. (A) The ligand density map highlights positions occupied by pisiferic acid during dynamical simulation. Three distinct isocontours are shown corresponding to 26, 6.5, and 0.2% occupancy in dark blue, blue, and light blue, respectively. Binding pocket residues, R295, K193, and E187 that stably interact with the ligand in the VSD are also highlighted. (B) Residue-specific contacts between Kv1.1 and pisiferic acid measured throughout the simulation as a percentage of time show the highest peaks in residues proximal to the VSD binding pocket (R295, E187, and K193). (C) Mean traces for the Kv1.1 mutants indicated expressed in oocytes in the absence (Control) or presence of pisiferic acid (12 µM). Scale bars Lower Left; voltage protocol as in Fig. 1C; n = 5-11 per group. For all electrophysiology in this figure: error bars indicate SEM. n indicates number of biologically independent oocytes. At least 2 batches of oocytes were used per experiment. Statistical comparisons by the two-tailed paired t test. (D) Mean normalized tail current (G/Gmax) versus prepulse voltage for traces as in (C), in the absence or presence of pisiferic acid (12 µM); n = 5-11 per group. (E) Summary of V0.5act shifts in response to pisiferic acid (12 µM), quantified from data in (C and D), n = 5-11. ***P < 0.001; ****P < 0.0001.

References

    1. Browne D. L., et al. , Episodic ataxia/myokymia syndrome is associated with point mutations in the human potassium channel gene, KCNA1. Nat. Genet. 8, 136–140 (1994), 10.1038/ng1094-136. - DOI - PubMed
    1. Steckley J. L., Ebers G. C., Cader M. Z., McLachlan R. S., An autosomal dominant disorder with episodic ataxia, vertigo, and tinnitus. Neurology 57, 1499–1502 (2001), 10.1212/wnl.57.8.1499. - DOI - PubMed
    1. Hasan S. M., D’Adamo M. C., “Episodic Ataxia Type 1” in GeneReviews((R)), Adam M. P., et al., Eds. (University of Washington, Seattle, WA, 1993).
    1. Zerr P., Adelman J. P., Maylie J., Characterization of three episodic ataxia mutations in the human Kv1.1 potassium channel. FEBS Lett. 431, 461–464 (1998), 10.1016/s0014-5793(98)00814-x. - DOI - PubMed
    1. Zerr P., Adelman J. P., Maylie J., Episodic ataxia mutations in Kv1.1 alter potassium channel function by dominant negative effects or haploinsufficiency. J. Neurosci. 18, 2842–2848 (1998), 10.1523/JNEUROSCI.18-08-02842.1998. - DOI - PMC - PubMed

Supplementary concepts