. 2025 Apr 14;35(4):942-955.
doi: 10.1101/gr.279322.124.

Single-cell Rapid Capture Hybridization sequencing reliably detects isoform usage and coding mutations in targeted genes

Affiliations

Single-cell Rapid Capture Hybridization sequencing reliably detects isoform usage and coding mutations in targeted genes

Hongke Peng et al. Genome Res. .

Abstract

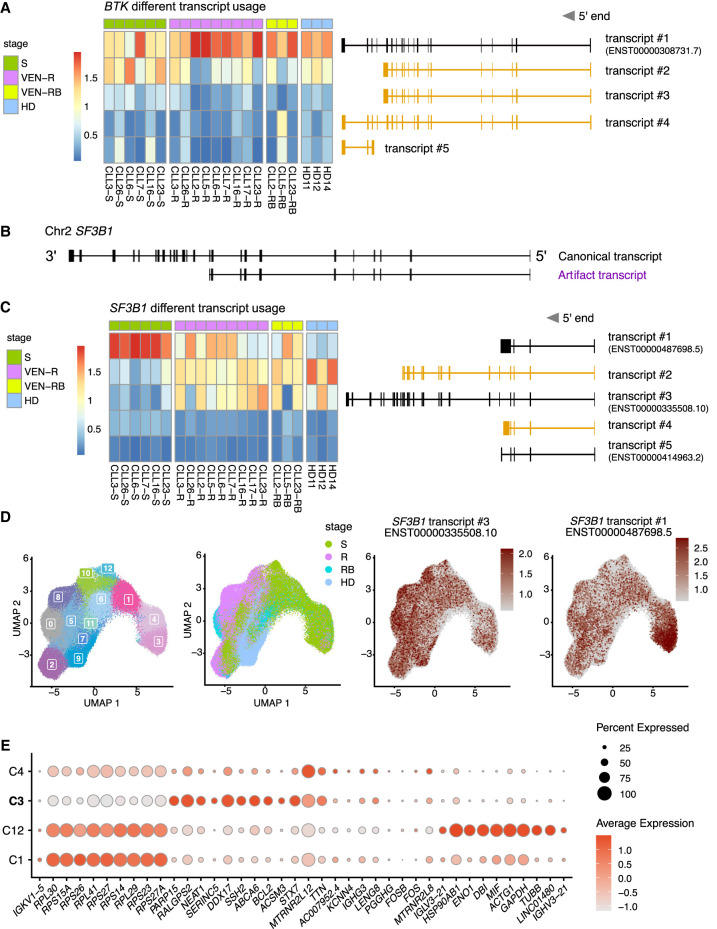
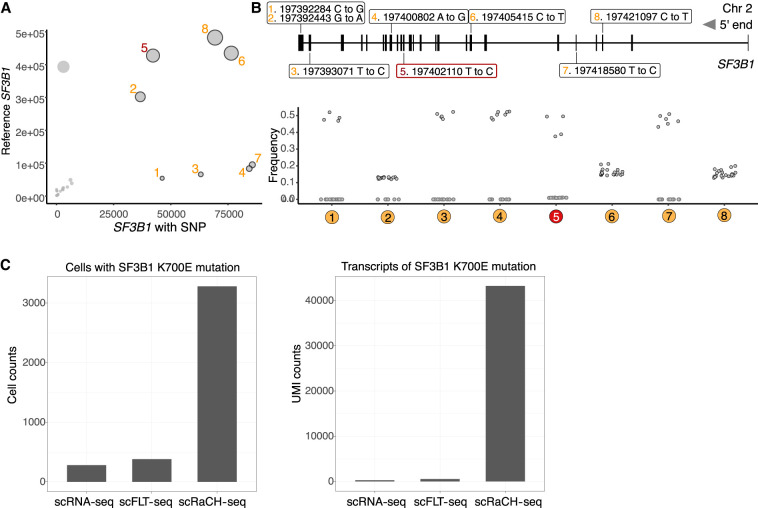
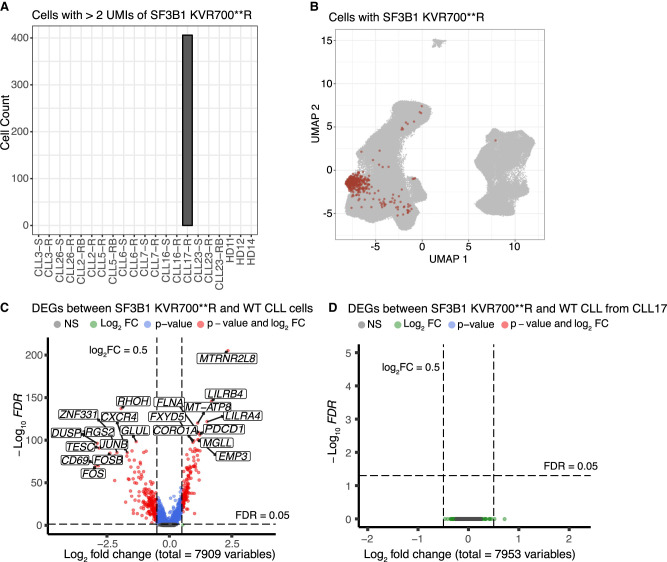
Single-cell long-read sequencing has transformed our understanding of isoform usage and the mutation heterogeneity between cells. Despite unbiased in-depth analysis, the low sequencing throughput often results in insufficient read coverage, thereby limiting our ability to perform mutation calling for specific genes. Here, we developed a single-cell Rapid Capture Hybridization sequencing (scRaCH-seq) method that demonstrates high specificity and efficiency in capturing targeted transcripts using long-read sequencing, allowing an in-depth analysis of mutation status and transcript usage for genes of interest. The method includes creating a probe panel for transcript capture, using barcoded primers for pooling and efficient sequencing via Oxford Nanopore Technologies platforms. scRaCH-seq is applicable to stored and indexed single-cell cDNA, which allows analysis to be combined with existing short-read RNA-seq data sets. In our investigation of BTK and SF3B1 genes in samples from patients with chronic lymphocytic leukemia (CLL), we detect SF3B1 isoforms and mutations with high sensitivity. Integration with short-read single-cell RNA sequencing (scRNA-seq) data reveals significant gene expression differences in SF3B1-mutated CLL cells, although it does not impact the sensitivity of the anticancer drug venetoclax. scRaCH-seq's capability to study long-read transcripts of multiple genes makes it a powerful tool for single-cell genomics.


Figures

Figure 1.
Figure 1.
Schematic of scRaCH-seq approach and FLAMES pipeline for single-cell long-read data analysis. scRaCH-seq can be incorporated in the standard high-throughput single-cell RNA-seq experiments (left side). After single-cell isolation, mRNA is converted into cDNA and barcoded. Only some of this amplified indexed cDNA is used for short-read library preparation and Illumina sequencing. The surplus cDNA is stored and can be used for scRaCH-seq. For scRaCH-seq, a probe panel is designed for genes of interest. The biotinylated probes are hybridized with amplified cDNA overnight. The probes and target genes are captured with Streptavidin beads, washed, and amplified. The enriched target long-read transcripts are sequenced on the Nanopore platform. With the FLAMES pipeline, FASTQ files are demultiplexed by cross-referencing the cell barcodes identified in scRNA-seq data (STEP 01). Next, the demultiplexed reads undergo an integrity check and the reads that possess a UMI, a TSO sequence, and poly(A) tails are retained (STEP 02). Reads are aligned to the GRCh38 reference genome to construct a transcript assembly. Concurrently, the piled-up reads are compared against GRCh38 to identify base alterations and deletions, generating a comprehensive mutation/deletion matrix (STEP 03). The reads are realigned to the transcript assembly for quantification (STEP 04). Single-cell short-read gene expression data is used to cluster the cells, based on the conventional analysis pipeline for scRNA-seq. The transcript usage and mutation/deletion information are then aligned with the single-cell gene expression data. The bridge connecting these data sets is the shared cell barcodes, ensuring the gene expression profile at a transcript level (STEP 05).
Figure 2.
Figure 2.
scRaCH-seq is efficient in capturing enriched genes of interest. (A) A graph showing the losses in read counts due to demultiplexing and integrity checks, depicting the distribution of read lengths ranging from 0 to 5000 bp. The canonical isoform of BTK (2027 bp) and SF3B1 (2225 bp) are marked on the plot. The four shades of gray, ranging from light to dark, correspond to raw reads, demultiplexed reads, reads with TSO, and reads with also a poly(A) end. (B) Bar plots showing the loss of reads after demultiplexing (top panel), barcodes detected in long-read sequencing data (middle panel), and counts of off-target and on-target reads for each sample (bottom panel). (C) Violin plot showing the log10 UMI counts of collapsed BTK (red), SF3B1 (orange), and off-target transcripts (purple) based on isoform detected by scRaCH-seq (left panel). Violin plot showing the log10 counts of cells possessing collapsed transcripts of BTK (red), SF3B1 (orange), and off-target genes (purple) (right panel). (D) Dot plot showing the log10 counts of off-target genes with the top 10 off-target transcripts specifically marked. (E) Dot plot showing the per-cell UMIs of SF3B1 (red) and BTK (orange), detected by scRNA-seq (x-axis) and scRaCH-seq (y-axis) for all samples. (F) Uniform Manifold Approximation and Projection (UMAP) projection of peripheral blood mononuclear cells from CLL patients or healthy donors and clustering based on short-read gene expression. (G) Violin plot showing the expression of CD14 (monocyte marker), CD19 (B/CLL cell marker), and CD3 (T cell marker) per cell cluster (F). (H) UMAP projection of SF3B1 (left) and BTK (right) gene-level expression detected by scRNA-seq (purple) or scRaCH-seq (green).
Figure 3.
Figure 3.
scRaCH-seq reveals different SF3B1 isoform usage by CLL cells from patients undergoing different treatments. (A) Heatmap showing BTK isoform usage (rows) per sample (columns) in the B/CLL cells. The top 5 BTK transcripts are illustrated on the right with novel transcripts highlighted in yellow. Samples are grouped in screening (S; green), venetoclax-relapsed (VEN-R/R; pink), venetoclax-relapsed and subsequently on BTKi (VEN-RB/RB; bright yellow), and HD (turquoise). (B) Illustration of the dominant SF3B1 transcript identified and characterized by the absence of the last 14 exons in the 3′ end (highlighted in purple). (C) Heatmap showing SF3B1 isoform usage (rows) per sample (columns) in the B/CLL cells. The top 5 SF3B1 transcripts are illustrated on the right with novel transcripts highlighted in yellow. (D) UMAP projection of CLL/B cells from CLL patients or HDs and clustering based on short-read gene expression. The samples from CLL patients at screening (S; green), venetoclax-relapsed (R; pink), venetoclax-relapsed and subsequently on BTKi (RB; bright yellow) and HDs (turquoise) are highlighted in the UMAP. The expression of the SF3B1 transcripts #1 and #3 is overlaid as red dots in the UMAP (B). (E) Dot plot showing marker genes that distinguish the CLL cells present in the four clusters shared by the screening samples (C1, C3, C4, and C12 in C). Cluster 3 with SF3B1 transcript #1 usage is indicated in bold.
Figure 4.
Figure 4.
Mutation calling with scRaCH-seq and FLAMES. (A) Dot plot showing the SF3B1 point mutations identified using FLAMES (left panel). After consolidating reads with UMIs, the reads from all the samples were aligned to the GRCh38 reference genome. The size of each dot in the plot corresponds to the proportion of altered transcripts. (B) A graphical representation highlights the precise locations of these high-frequency (>10%) alterations within the SF3B1 gene. The bottom graph shows the frequency of altered SF3B1 transcripts in each sample. (C) Bar plots showing the cells with a SF3B1 K700E mutation (left panel) or transcripts (UMIs) with SF3B1 K700E mutation (right panel) detected by short-read scRNA-seq, long-read scFLT-seq, or long-read scRaCH-seq.
Figure 5.
Figure 5.
The SF3B1 K700E mutation is detected by scRaCH-seq. (A) UMAP projection of cells carrying the SF3B1 K700E mutation (red). (B) Violin plot showing the UMI counts, gene counts (Features), expression of mitochondria genes (MT%), expression of CD3 (T cell marker), CD14 (monocyte marker), and CD19 (B cell marker) per cell type cluster. (C) Bar plot showing the abundance of mutant transcripts. Left plot showing cells per sample with >0 transcripts (UMI) of mutant SF3B1 K700E. Middle plot showing cells per sample with >1 transcripts (UMIs) of SF3B1 mutation. Right plot showing cells per sample with >2 transcripts (UMIs) of SF3B1 mutation. Samples with confirmed SF3B1 K700E mutation by WES are highlighted in dark gray. (D) Bar plot showing the distribution of the abundance of SF3B1 K700E mutation detected in CLL (pink) and non-CLL (blue) cells. The vertical dashed line indicates the criterion of >2 SF3B1 mutation transcripts. (E) UMAP projection of cells carrying >2 SF3B1 K700E mutation transcripts (red).
Figure 6.
Figure 6.
The SF3B1 KVR700**R alteration is detected by scRaCH-seq. (A) Bar plot showing the cells with SF3B1 6 bp deletion (Chr 2:197,402,104:197,402,109) across all samples. A criterion of >2 of SF3B1 with 6 bp del transcripts (UMIs) per cell was employed. (B) UMAP projection of cells carrying >2 SF3B1 KVR700**R altered transcripts (red). (C) Volcano plot showing the DEGs (FDR < 0.05) between SF3B1 KVR700**R mutant and wild-type CLL cells from all venetoclax-relapsed CLL samples. (D) Volcano plot showing the DEGs (FDR < 0.05) between SF3B1 KVR700**R mutant and wild-type CLL cells from CLL17.

References

    1. Cheng O, Ling MH, Wang C, Wu S, Ritchie ME, Göke J, Amin N, Davidson NM. 2024. Flexiplex: a versatile demultiplexer and search tool for omics data. Bioinformatics 40: btae102. 10.1093/bioinformatics/btae102 - DOI - PMC - PubMed
    1. Cortés-López M, Chamely P, Hawkins AG, Stanley RF, Swett AD, Ganesan S, Mouhieddine TH, Dai X, Kluegel L, Chen C, et al. 2023. Single-cell multi-omics defines the cell-type-specific impact of splicing aberrations in human hematopoietic clonal outgrowths. Cell Stem Cell 30: 1262–1281.e8. 10.1016/j.stem.2023.07.012 - DOI - PMC - PubMed
    1. Griffin GK, Booth CAG, Togami K, Chung SS, Ssozi D, Verga JA, Bouyssou JM, Lee YS, Shanmugam V, Hornick JL, et al. 2023. Ultraviolet radiation shapes dendritic cell leukaemia transformation in the skin. Nature 618: 834–841. 10.1038/s41586-023-06156-8 - DOI - PMC - PubMed
    1. Joglekar A, Foord C, Jarroux J, Pollard S, Tilgner HU. 2023. From words to complete phrases: insight into single-cell isoforms using short and long reads. Transcription 14: 92–104. 10.1080/21541264.2023.2213514 - DOI - PMC - PubMed
    1. Korsunsky I, Millard N, Fan J, Slowikowski K, Zhang F, Wei K, Baglaenko Y, Brenner M, Loh PR, Raychaudhuri S. 2019. Fast, sensitive and accurate integration of single-cell data with Harmony. Nat Methods 16: 1289–1296. 10.1038/s41592-019-0619-0 - DOI - PMC - PubMed

MeSH terms

LinkOut - more resources