. 2025 Jan 10;16(1):584.
doi: 10.1038/s41467-025-55936-5.

Tracheal tuft cells release ATP and link innate to adaptive immunity in pneumonia

Affiliations

Tracheal tuft cells release ATP and link innate to adaptive immunity in pneumonia

Noran Abdel Wadood et al. Nat Commun. .

Abstract

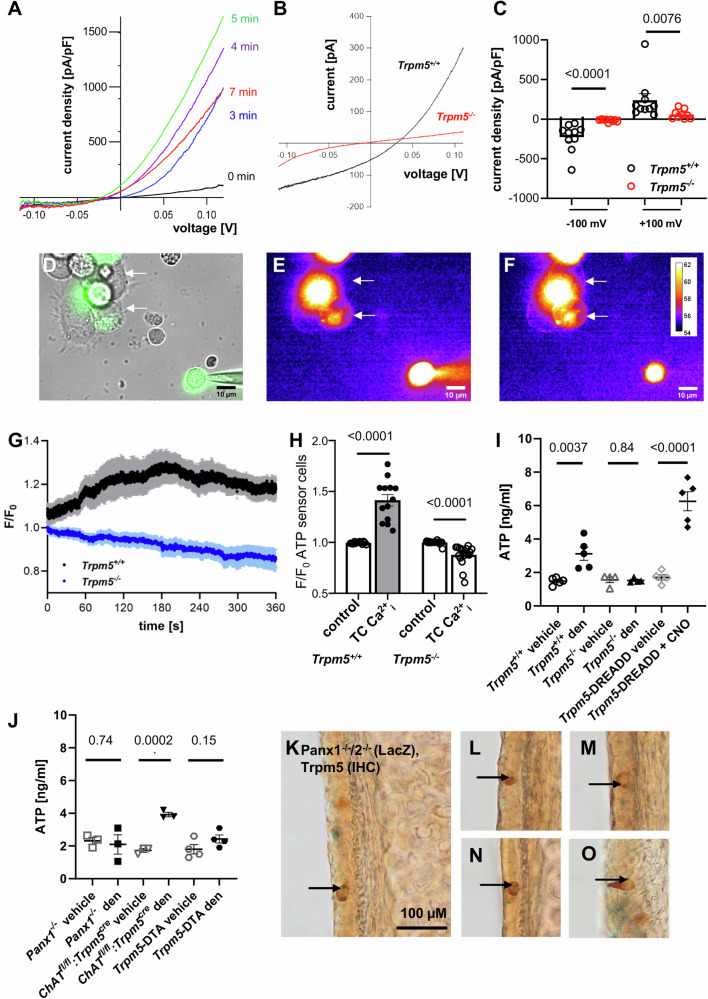
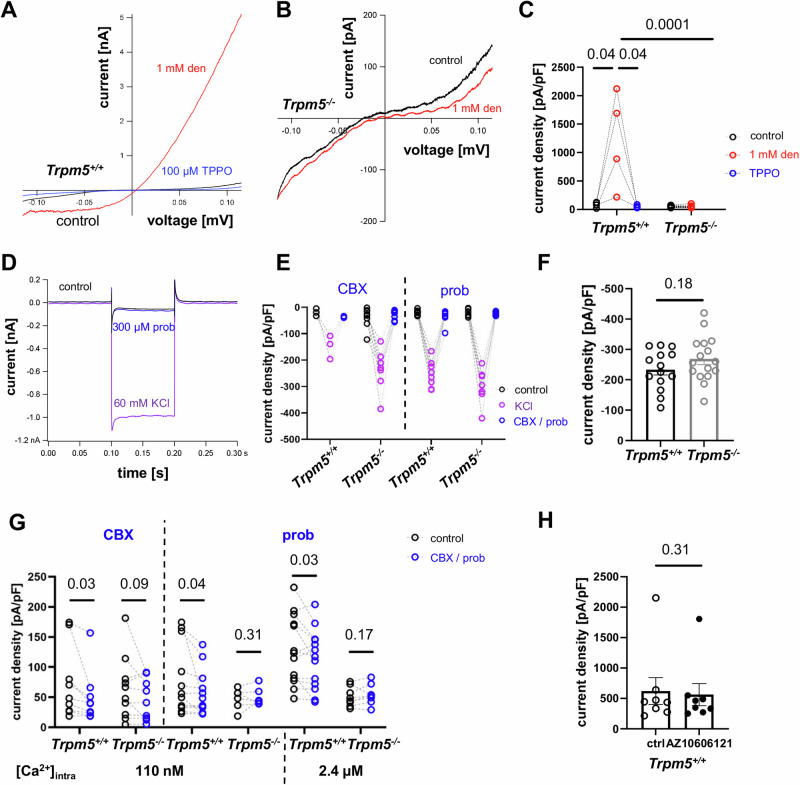
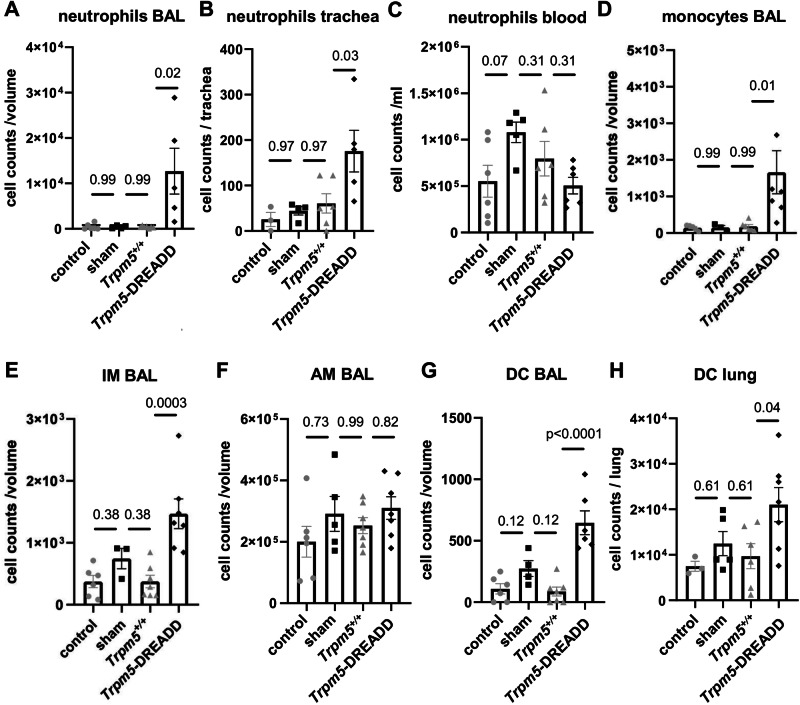
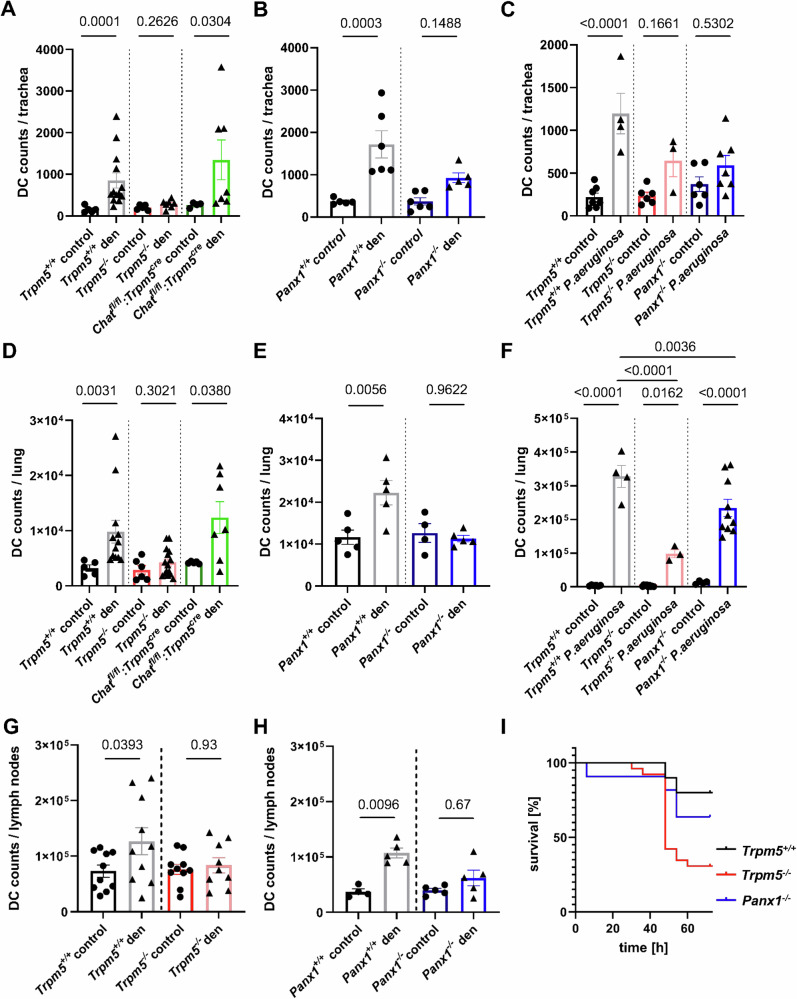
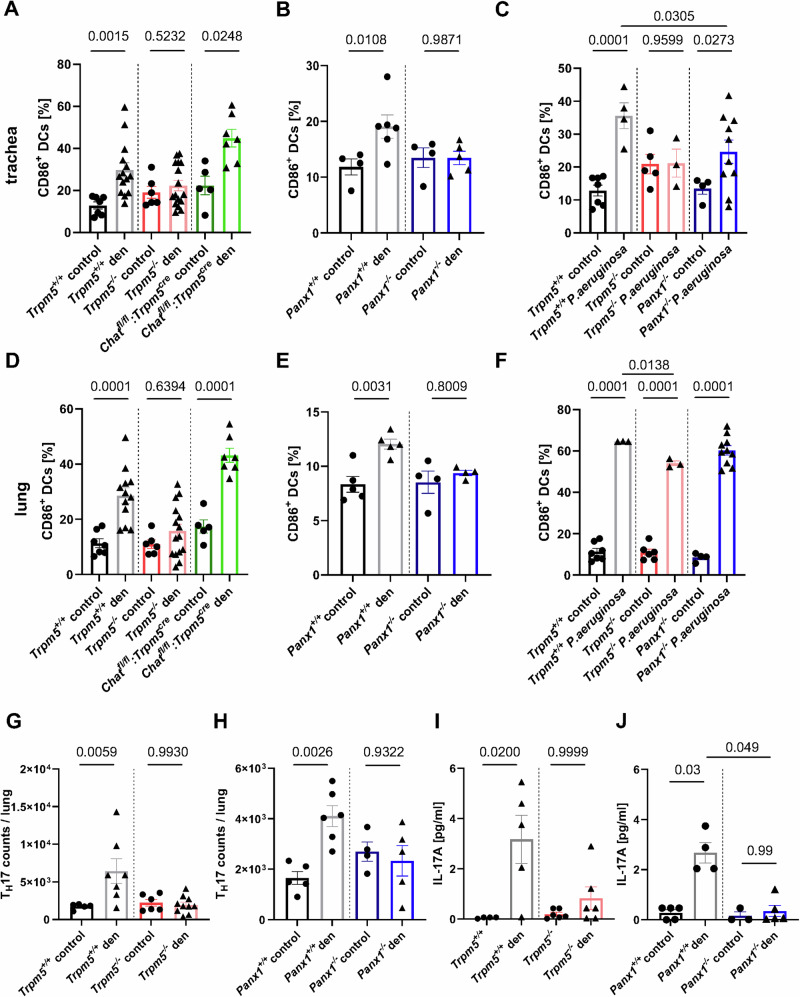
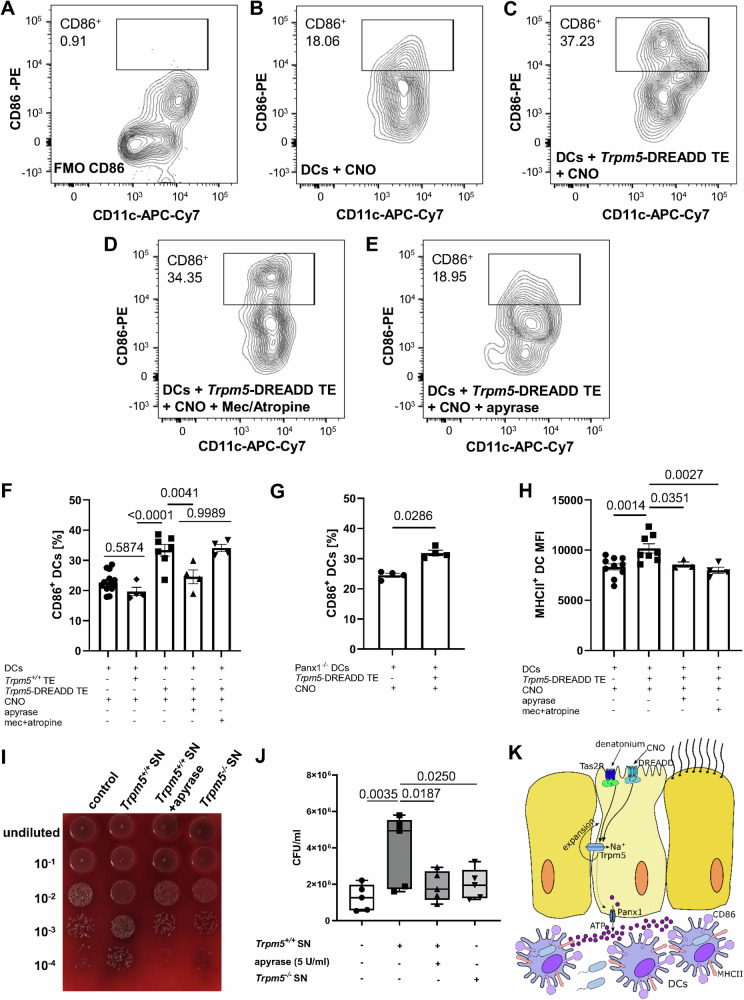
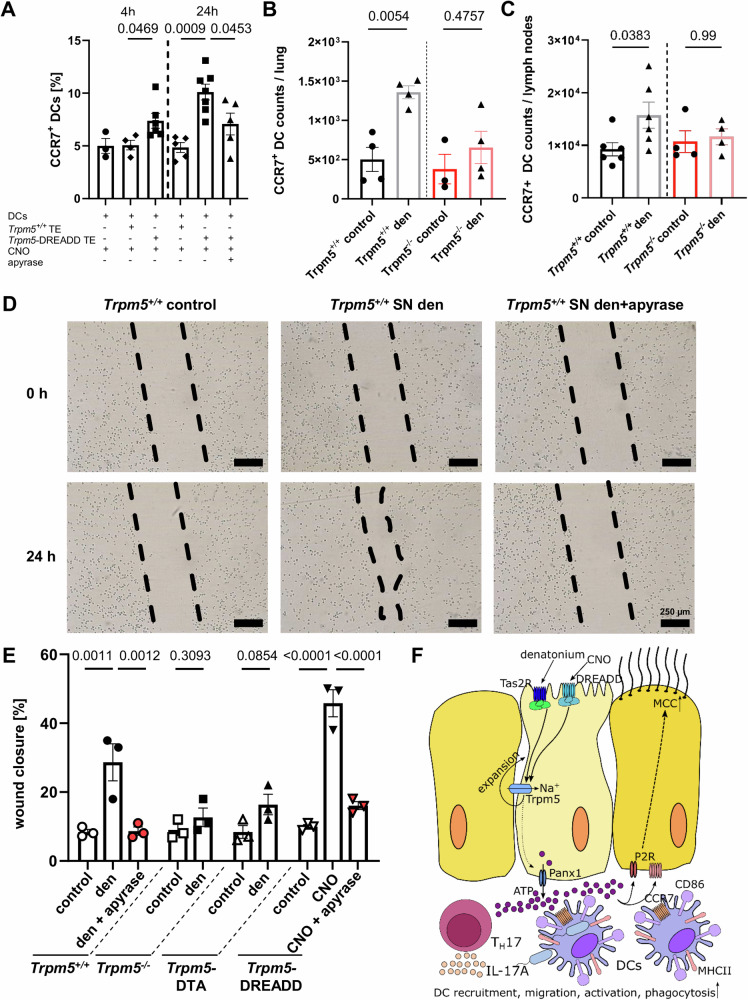
Tracheal tuft cells shape immune responses in the airways. While some of these effects have been attributed to differential release of either acetylcholine, leukotriene C4 and/or interleukin-25 depending on the activating stimuli, tuft cell-dependent mechanisms underlying the recruitment and activation of immune cells are incompletely understood. Here we show that Pseudomonas aeruginosa infection activates mouse tuft cells, which release ATP via pannexin 1 channels. Taste signaling through the Trpm5 channel is essential for bacterial tuft cell activation and ATP release. We demonstrate that activated tuft cells recruit dendritic cells to the trachea and lung. ATP released by tuft cells initiates dendritic cell activation, phagocytosis and migration. Tuft cell stimulation also involves an adaptive immune response through recruitment of IL-17A secreting T helper cells. Collectively, the results provide a molecular framework defining tuft cell dependent regulation of both innate and adaptive immune responses in the airways to combat bacterial infection.


Conflict of interest statement

Competing interests: The authors declare no competing interests.

Figures

Fig. 1
Fig. 1. Tuft cells release ATP and express pannexin 1.
A Representative I-V relationships of TRPM5 current amplitudes normalized to cell size (pA/pF) measured in a tuft cell at indicated time points after breaking the cell. B Representative current-voltage (I-V) relationships of whole-cell currents measured in a tracheal tuft cell from a Trpm5+/+ or a Trpm5−/− mouse in the presence of 1 µM intracellular Ca2+. C Statistical analysis (two-tailed Mann-Whitney test) of currents illustrated in (B). Current amplitude densities measured at −100 mV and +100 mV in Trpm5−/− tuft cells (n = 9 cells) and Trpm5+/+ tuft cells (n = 10 cells) are shown. D The bright field of a patched tuft cell (green, GFP + ) and ATP sensor cells (arrow) shown in E-F. EF Representative images from a recording of the membrane fluorescence of two ATP sensor cells (arrow) before (E) and after (F) application of Ca2+ containing intracellular solution into a tuft cell through the patch pipette (for n = 5 mice/5 experiments). G The fluorescence intensity of all ATP sensor cells over the whole-cell recording of Trpm5+/+ (black, n = 11 cells/5 mice/5 experiments) or Trpm5−/− tuft cells (blue, n = 9 cells/4 mice/4 experiments). H Statistical analyses of maximal fluorescence intensity of all ATP sensor cells responding to tuft cell stimulation in Trpm5+/+ mice (n = 13 cells/5 mice/5 experiments) and Trpm5−/− mice (n = 19 cells/4 mice/4 experiments). Control = baseline fluorescence, tuft cell Ca2+i = fluorescence after tuft cell stimulation with intracellular Ca2+; two-tailed paired Student’s t-test. I ATP levels in supernatants from denatonium- and vehicle-treated tracheae of Trpm5+/+ mice (n = 5) and Trpm5−/− mice (n = 4), as well as in supernatants from clozapine-N-oxide (CNO, 100 µM, n = 5)- and vehicle-treated (n = 5) Trpm5-DREADD mice. Two-tailed unpaired Student’s t-test. J ATP levels in supernatants from denatonium- and vehicle-treated tracheae from Panx1−/− (n = 3), ChATfl/fl:Trpm5cre (n = 3), and Trpm5- DTA mice (n = 4). Two-tailed unpaired Student’s t-test. KO Immunohistochemistry for Trpm5 combined with LacZ-staining in the tracheal epithelium of Panx1−/−/2−/− mice (n = 3). Arrows indicate LacZ-staining (blue) in the nuclei of Trpm5+ cells (brown). Source data are provided in the Source Data file. Data in panels (C, G, H, I and J) are presented as mean ± SEM.
Fig. 2
Fig. 2. Whole-cell patch-clamp recordings of mouse tracheal tuft cells.
A Application of denatonium (1 mM) in Trpm5+/+ tuft cells led to an outwardly rectifying current that was abolished by TPPO (100 µM). B Denatonium (1 mM) had no effect on the I/V curve recorded in Trpm5−/− tuft cells. Red = denatonium, black = baseline. C Current densities recorded at 100 mV were increased by denatonium in tuft cells of Trpm5+/+ mice compared to before treatment and to currents in the presence of 100 µM TPPO (n = 4 cells/3 mice, paired Student’s t-test). Currents at 100 mV of Trpm5−/− tuft cells (n = 11 cells/5 mice) perfused with 1 mM denatonium were reduced compared to tuft cells from Trpm5+/+ mice (two-tailed unpaired Student’s t-test). D Representative current traces at a holding potential of +30 mV hyper-polarized to −60 mV upon application of 60 mM KCl and addition of 300 µM probenecid (prob). E KCl-induced current densities were inhibited by carbenoxolone (CBX, 10 µM) or probenecid (prob, 300 µM) in tuft cells from Trpm5+/+ and Trpm5−/− mice. Trpm5+/+ CBX: n = 3 cells/3mice, prob: n = 9 cells/5mice, Trpm5−/− CBX: n = 8 cells/3mice, prob: n = 8 cells/3mice, two-tailed paired Student’s t-test. F The KCl-induced current densities in Trpm5+/+ (n = 13 cells/7mice) and Trpm5−/− (n = 16 cells/5mice) mice were identical (two-tailed unpaired Student’s t-test). G Analyzed current densities at 100 mV upon a ramp depolarization. Carbenoxolone (CBX, 10 µM)-sensitive currents upon the activation of Trpm5 channels with 110 nM [Ca2+]i were reduced in Trpm5+/+ but not in Trpm5−/− mice. Trpm5 currents at 110 nM [Ca2+]i and 2.4 µM [Ca2+]i were sensitive to probenecid (prob, 300 µM) in Trpm5+/+ but not in Trpm5−/− mice. CBX: Trpm5+/+: n = 9 cells/6mice, Trpm5−/−: n = 10 cells/5mice, prob, 110 nM Ca2+: Trpm5+/+: n = 12 cells/4mice, Trpm5−/−: n = 7 cells/3mice, prob, 2.4 µM Ca2+: Trpm5+/+: n = 13 cells/4mice, Trpm5−/−: n = 8 cells/3mice; one-tailed paired Student’s t-test. H The Ca2+-induced current densities in tuft cells (ctrl) were not inhibited by the P2x7 receptor inhibitor AZ10606121 (20 µM) (n = 8 cells/4 mice/4 experiments). Two-tailed Wilcoxon test. Source data are provided in the Source Data file. Data in panels F and H are presented as mean ± SEM.
Fig. 3
Fig. 3. Recruitment of immune cells after acute in vivo tuft cell stimulation.
FACS analyses. A Stimulation of tuft cells intratracheally with 100 µM clozapine-N-oxide (CNO) in Trpm5-DREADD mice (n = 5) led to a significant increase in neutrophil numbers within bronchoalveolar lavage fluid (BALF, Kurskal-Wallis test) in (B) trachea (One-way ANOVA) but not in (C) blood (One-way ANOVA) after 30 min, compared to untreated Trpm5-DREADD control (n = 6), Trpm5-DREADD sham treated (n = 4) and CNO-treated Trpm5+/+ mice (n = 5). D In Trpm5-DREADD mice treated with 100 µM CNO (n = 7), the numbers of monocytes were significantly increased in BAL samples after 30 min compared to CNO-treated Trpm5+/+mice (n = 7). sham-treated: n = 3, control=untreated: n = 6. Kruskal-Wallis test. E Interstitial macrophage (IM) numbers increased in BAL samples of Trpm5-DREADD mice treated with 100 µM CNO (n = 7) compared to CNO-treated Trpm5+/+mice (n = 7). sham-treated: n = 5, control=untreated: n = 6. One-way ANOVA. F The number of alveolar macrophages (AM) remained unchanged in BAL-samples of Trpm5-DREADD mice treated with 100 µM CNO (n = 7). Trpm5+/+: n = 7, sham-treated: n = 5, control=untreated: n = 6. Kruskal-Wallis test. G The dendritic cell (DC) number was significantly increased in BALF samples of Trpm5-DREADD mice (n = 6) treated with 100 µM CNO after 30 min compared to CNO-treated Trpm5+/+ mice (n = 7). sham-treated: n = 4, control=untreated: n = 6. One-way ANOVA. H In lungs of Trpm5-DREADD mice (n = 7) treated with 100 µM CNO the DC number was significantly increased after 30 min compared to CNO-treated Trpm5+/+ mice (n = 6). sham-treated: n = 5, control=untreated: n = 3. One-way ANOVA. AH Source data are provided in the Source Data file. Data in panels A–H are presented as mean ± SEM.
Fig. 4
Fig. 4. FACS analyses of dendritic cell (DC) numbers three days after tuft cell stimulation by denatonium (1 mM) or infection with Pseudomonas aeruginosa NH57388A.
A DC (CD11b+, CD11c+, F4/80-) numbers in denatonium-treated or control tracheae of Trpm5+/+ (control n = 5, den n = 13) Trpm5−/− mice (control n = 5, den n = 7) and Chatfl/fl:Trpm5cre mice (control n = 4, den n = 7) after three days. Kruskal-Wallis test. B DC numbers in tracheae of control or denatonium-treated Panx1−/− (control n = 6, den n = 5) and Panx1+/+ mice (control n = 6, den n = 6). One-way ANOVA. C DC numbers three days post infection or in uninfected controls in Trpm5+/+ (control n = 7, P.a. n = 4), Trpm5−/− (control n = 6, P.a. n = 3) and Panx1−/− mice (control n = 6, P.a. n = 7). One-way ANOVA. D DC numbers in lungs of denatonium-treated (1 mM) and control Trpm5+/+ (control n = 5, den n = 12), Trpm5−/− mice (control n = 6, den n = 15) and Chatfl/fl:Trpm5cre mice (control n = 5, den n = 7). Kruskal-Wallis test. E DC numbers in lungs of denatonium-treated and control Panx1−/− (control n = 4, den n = 5) or Panx1+/+ mice (control n = 5, den n = 5). One-way ANOVA. F DC numbers in lungs of infected Trpm5+/+ (n = 4), Trpm5−/− (n = 3) and Panx1−/− mice (n = 10) and uninfected controls (Trpm5+/+ n = 6, Trpm5−/− n = 9, Panx1−/− n = 4). One-way ANOVA. G DC numbers in airway lymph nodes of denatonium-treated Trpm5+/+ (n = 10), control (n = 10) and Trpm5−/− mice (control n = 10, den n = 9). One-way ANOVA. H DC numbers in airway lymph nodes from denatonium-treated or control Panx1+/+ (n = 5) and Panx1−/− mice (n = 5). Kruskal-Wallis test. I Survival rates of Trpm5+/+ (n = 10), Trpm5−/− (n = 26) and Panx1−/− (n = 11) mice revealed decreased survival in Panx1−/− and Trpm5−/− mice compared to Trpm5+/+mice within the first 72 h after infection with P. aeruginosa NH57388A. Source data are provided in the Source Data file. Data in panels A–H are presented as mean ± SEM.
Fig. 5
Fig. 5. FACS analyses of the percentage of activated (CD11b+, CD11c+, F4/80-, CD86+) dendritic cells (DCs) and TH17 cell recruitment after three days.
A Percentage of CD86+ DCs in tracheae of denatonium-treated (1 mM) Trpm5+/+ (n = 14), controls (n = 7), Trpm5−/− mice (control n = 6, den n = 16) and Chatfl/fl:Trpm5cre mice (control n = 5, den n = 7). Kruskal-Wallis test. B Percentage of CD86+ DCs in tracheae of denatonium-treated or control Panx1+/+ (control n = 4, den n = 6) and Panx1−/− mice (control n = 4, den n = 5). One-way ANOVA. C Percentage of CD86+ DCs in tracheae three days post infection or in uninfected controls in Trpm5+/+ (control n = 7, P.a. n = 4), Trpm5−/− (control n = 5, P.a. n = 3) and Panx1−/− mice (control n = 4, P.a. n = 10). One-way ANOVA. D Percentage of CD86+ DCs in lungs of denatonium-treated Trpm5+/+ (n = 12), control (n = 7), Trpm5−/− mice (control n = 6, den n = 15) and Chatfl/fl:Trpm5cre mice (control n = 5, den n = 7). One-way ANOVA. E Percentage of CD86+ DCs in lungs of denatonium-treated or control Panx1+/+ (n = 5) and Panx1−/− (n = 4) mice. Unpaired Student’s t-test. F Percentage of CD86+ DCs in lungs three days post infection or in uninfected controls of Trpm5+/+ (control n = 7, P.a. n = 3), Trpm5−/− (control n = 6, P.a. n = 3) and Panx1−/− mice (control n = 4, P.a. n = 10). One-way ANOVA. G FACS analysis of TH17 cells in lungs of denatonium-treated Trpm5+/+ (n = 7) and Trpm5−/− (n = 10) mice or controls (Trpm5+/+ n = 5, Trpm5−/− n = 6). One-way ANOVA. H TH17 cell counts from lungs of denatonium-treated and control Panx1+/+ (control n = 5, den n = 6) and Panx1−/− mice (control n = 4, den n = 5). One-way ANOVA. I IL-17A levels in plasma samples in control or denatonium-treated Trpm5+/+ (control n = 4, den n = 5) and Trpm5−/− (control n = 6, den n = 6) mice. Kruskal-Wallis test. J IL-17A levels in plasma samples of control (n = 5) or denatonium-treated Panx1+/+ mice (n = 4) or Panx1−/− mice (control n = 3, den n = 5). Kruskal-Wallis test. Source data are provided in the Source Data file. Data in panels A–J are presented as mean ± SEM.
Fig. 6
Fig. 6. Upregulation of CD86 on dendritic cells (DCs) is dependent on ATP released from tuft cells.
A–F FACS analysis of CD86 expression on sorted pulmonary DCs (CD45+Ly6G-F4/80-CD11c+) co-cultured with sorted Trpm5-DREADD tracheal epithelium (EpCAM+CD45-) (n = 7 mice). Clozapine-n-oxide (CNO) (100 µM) was used to stimulate Trpm5-DREADD tracheal epithelium in presence or absence of ATP hydrolyzing enzyme apyrase (5 U/ml) or nicotinic receptor antagonist mecamylamine (10 µM) and muscarinic receptor antagonist atropine (1 µM) in the co-culture system. The percentage of CD86-expressing DCs was significantly higher when DCs were co-cultured with CNO-stimulated Trpm5-DREADD tracheal epithelium compared to CNO treated DCs (n = 10 mice) or CNO treated Trpm5+/+ tracheal epithelium. Treatment of CNO-stimulated Trpm5-DREADD tracheal epithelium with apyrase but not mecamylamine/atropine reduced the percentages of CD86+ DCs (n = 4 mice). One-way ANOVA. G Co-culture of pulmonary DCs from Panx1−/− mice with CNO-stimulated Trpm5-DREADD tracheal tuft cells significantly increased the percentages of CD86 expressing DCs compared to CNO treated Panx1−/− DCs (n = 4 mice). Two-tailed Mann-Whitney test. H The median fluorescence intensity (MFI) of MHCII in pulmonary DCs was significantly increased after being co-cultured with CNO-stimulated Trpm5-DREADD tracheal epithelium (DC: n = 10 mice, DC + TE: n = 8 mice). This was reduced when CNO-stimulated Trpm5-DREADD tracheal epithelium was treated with apyrase (n = 3 mice), or mecamylamine and atropine (n = 4 mice). One-way ANOVA. I Blood agar plate of phagocytosed P. aeruginosa NH57388A CFUs after treatment of DCs with supernatant (SN) of Trpm5+/+ tracheae stimulated with 1 mM denatonium, with supernatant of Trpm5+/+ tracheae stimulated with denatonium in the presence 5 U/ml apyrase and with supernatants of denatonium-treated Trpm5−/− tracheae and untreated control conditions. J Quantification of (A) (n = 5 mice). Data are shown as a box-and-whisker plot displaying the minimum and maximum values, with the median represented by a horizontal line. One-way ANOVA. K Schematic drawing. Activation of tuft cells with denatonium or CNO leads to an ATP-dependent increased in the number and activation of DCs. (* p < 0.05, ** p < 0.01). Source data are provided in the Source Data file. Data in panels (F, G and H) are presented as mean ± SEM.
Fig. 7
Fig. 7. Tuft cell-induced dendritic cell (DC) phagocytic activity and migration is dependent on ATP.
A Co-culture of CNO-stimulated Trpm5-DREADD tracheal epithelium (TE) with DCs significantly increased the percentage of CCR7-expressing DCs after 4 h (n = 6 mice) and 24 h (n = 7 mice) compared to CNO-treated Trpm5+/+ TE co-culture with DCs (4 h: n = 4 mice, 24 h: n = 5 mice). The increase in % of CCR7+ DCs after 24 h was abolished by apyrase (5 U/ml) (n = 5 mice). DCs cultured alone and treated with CNO (n = 3 mice) exhibited the same percentage of CCR7-expressing cells as DCs co-cultured with Trpm5+/+ TE. One-way ANOVA. B The number of CCR7-expressing DCs in lungs increased significantly 3 days after intratracheal tuft cell stimulation with 1 mM denatonium in Trpm5+/+ mice in contrast to Trpm5−/− mice (n = 4). One-way ANOVA. C In Trpm5+/+ mice (n = 6) CCR7-expression DC counts in lymph nodes are increased 3 days after denatonium treatment, but not in Trpm5−/− mice (n = 4). Kruskal-Wallis test. D DC migration under different experimental conditions: untreated, treated with supernatants (SN) from denatonium-treated Trpm5+/+ mice without and with apyrase. E Quantification of (D). DCs treated with supernatants of unstimulated tracheae of Trpm5+/+, Trpm5-DREADD, Trpm5−/− and Trpm5-DTA mice as well as with supernatants of tracheae stimulated with 1 mM denatonium of Trpm5+/+ mice with and without apyrase (5 U/ml), of denatonium-treated Trpm5−/− and Trpm5-DTA tracheae, and from CNO-treated (100 µM) Trpm5-DREADD tracheae with and without apyrase. Wound closure was evaluated 24 h after induction of the scratch (n = 3). One-way ANOVA or two-tailed unpaired Student’s t-test. F Graphical summary. Stimulation of tuft cells with denatonium or CNO activates the Trpm5 channel, resulting in ATP release via pannexin 1 and tuft cell expansion. The released ATP drives DC recruitment, migration, activation, and phagocytosis, promotes TH17 cell recruitment and IL-17A secretion. Source data are provided in the Source Data file. Date in panels A, B, C and E are presented as mean ± SEM.

References

    1. Hollenhorst, M. I. & Krasteva-Christ, G. Chemosensory cells in the respiratory tract as crucial regulators of innate immune responses. J. Physiol.601, 1555–1572 (2023). - PubMed
    1. Lee, R. J., Chen, B., Redding, K. M., Margolskee, R. F. & Cohen, N. A. Mouse nasal epithelial innate immune responses to pseudomonas aeruginosa quorum-sensing molecules require taste signaling components. Innate Immun.20, 606–617 (2014). - PMC - PubMed
    1. Saunders, C. J., Christensen, M., Finger, T. E. & Tizzano, M. Cholinergic neurotransmission links solitary chemosensory cells to nasal inflammation. Proc. Natl Acad. Sci.111, 6075–6080 (2014). - PMC - PubMed
    1. Hollenhorst, M. I. et al. Bitter taste signaling in tracheal epithelial brush cells elicits innate immune responses to bacterial infection. J. Clin. Invest.132, e150951 (2022). - PMC - PubMed
    1. Hollenhorst, M. I. et al. Tracheal brush cells release acetylcholine in response to bitter tastants for paracrine and autocrine signaling. FASEB J.34, 316–332 (2020). - PubMed

MeSH terms

LinkOut - more resources