Multicenter Study

Host-microbe multiomic profiling identifies distinct COVID-19 immune dysregulation in solid organ transplant recipients

Harry Pickering et al. Nat Commun. .

Abstract

Coronavirus disease 2019 (COVID-19) poses significant risks for solid organ transplant recipients, who have atypical but poorly characterized immune responses to infection. We aim to understand the host immunologic and microbial features of COVID-19 in transplant recipients by leveraging a prospective multicenter cohort of 86 transplant recipients age- and sex-matched with 172 non-transplant controls. We find that transplant recipients have higher nasal SARS-CoV-2 viral abundance and impaired viral clearance, and lower anti-spike IgG levels. In addition, transplant recipients exhibit decreased plasmablasts and transitional B cells, and increased senescent T cells. Blood and nasal transcriptional profiling demonstrate unexpected upregulation of innate immune signaling pathways and increased levels of several proinflammatory serum chemokines. Severe disease in transplant recipients, however, is characterized by a less robust induction of pro-inflammatory genes and chemokines. Together, our study reveals distinct immune features and altered viral dynamics in solid organ transplant recipients.


Conflict of interest statement

Competing interests: F.K. has the following financial interests: The Icahn School of Medicine at Mount Sinai has filed patent applications relating to SARS-CoV-2 serological assays, NDV-based SARS-CoV-2 vaccines, influenza virus vaccines, and influenza virus therapeutics which list Florian Krammer as co-inventor (Patent title and number: Influenza Virus Vaccines and Uses Thereof (Chimeric HA 2) 9,371,366; Influenza Virus Vaccines and Uses Thereof (Chimeric HA 1) 10,131,695; Influenza Virus Vaccines and Uses Thereof (Chimeric HA 2) 2934581; Influenza Virus Vaccines and Uses Thereof (Chimeric HA 2) 9,968,670; Influenza Virus Vaccines and Uses Thereof (Chimeric HA 2) 10,137,189, Influenza Virus Vaccines and Uses Thereof (Chimeric HA 2) 10,583,188; Influenza Virus Vaccines and Uses Thereof (Chimeric HA 1) EP2758075; Influenza Virus Vaccination Regimens (Neuraminidase) 10,736,956; Anti-Influenza B Virus Neuraminidase Antibodies and Uses Thereof 11254733; Influenza Virus Hemagluttinin Proteins and Uses Thereof (Mosaic) 7237344). Mount Sinai has spun out a company, Kantaro, to market serological tests for SARS-CoV-2 and another company, Castlevax, to develop SARS-CoV-2 vaccines. F.K. is a co-founder and scientific advisory board member of Castlevax. F.K. has consulted for Merck, Curevac, Seqirus, and Pfizer and is currently consulting for 3rd Rock Ventures, GSK, Gritstone, and Avimex. The Krammer laboratory is also collaborating with Dynavax on influenza vaccine development. R.R.M. has a Leadership Councilor role 2018-2021 for the Society of Leukocyte Biology. O.L. has received support as a speaker for presentation regarding the Coronavirus pandemic from Midsized Bank Coalition of Americ (MBCA) and Moody’s Analytics. N.G.R. has research grants from Pfizer, Merck, Sanofi, Quidel, Immorna, Vaccine Company, and Lilly, serves on safety committees for ICON and EMMES and the advisory boards of Moderna, Seqirus, Pfizer, and Sanofi, and is a paid safety consultant for ICON, CyanVac and EMMES. The remaining authors declare no competing interests.

Figures

Fig. 1
Fig. 1. Study overview.
This study evaluated solid organ transplant recipients (N = 86) matched 2:1 with non-transplant controls (N = 172) enrolled in the IMPACC cohort of patients hospitalized for COVID-19 at 20 medical sites across the United States. Blood (PBMCs and serum) and nasal swab samples were collected at up to 6 visits over 28 days, and processed for RNA sequencing, proximity extension assay (Olink) soluble proteomics, mass cytometry, and serology. Created in BioRender.
Fig. 2
Fig. 2. SOT recipients have higher SARS-CoV-2 viral rpM and impaired viral clearance compared to controls.
a, b Box plots showing SARS-CoV-2 viral reads per million (rpM) at Visit 1 of a transplant (yellow, n = 86) and control groups (blue, n = 172), and b different organ transplant types (heart—n = 10, kidney—n = 41, liver—n = 14, lung—n = 17). P values were calculated with a a linear model or b two-sided likelihood ratio test. Boxes show the median and interquartile range (IQR), whiskers were calculated as the 25th percentile minus 1.5 times the IQR and the 75th percentile plus 1.5 times the IQR. c Plot showing the dynamics of viral rpM up to 30 days after hospital admission of the transplant and control groups. The blue and orange lines indicated the generalized additive mixed model fits, and the ribbons indicated the 95% confidence interval of the fits. P value was calculated for the interaction between SOT status and days from admission with a generalized additive mixed model. The number of patients sampled at each time point is depicted graphically below the X axis of (c).
Fig. 3
Fig. 3. Compared to controls, SOT recipients have lower B-cell plasmablasts and higher EMRA T cells as well as lower SARS-CoV-2 antibody levels at hospitalization.
a Differences in immune cell population frequency measured by CyTOF by SOT recipients (yellow, n = 54) and controls (blue, n = 107). b Box plots highlighting two cell types which differed in frequency between SOT recipients and controls. Boxes show the median and interquartile range (IQR), whiskers were calculated as the 25th percentile minus 1.5 times the IQR and the 75th percentile plus 1.5 times the IQR. P values in (a, b) were calculated with a linear model and Benjamini–Hochberg correction. c Box plot of spike IgG levels measured by area under the curve (AUC) by SOT recipients (n = 86) and controls (n = 172). d Longitudinal dynamics of spike IgG levels (log-transformed AUC) in SOT recipients and controls over the course of hospitalization. The blue and orange lines indicate the generalized additive mixed model fits, and the ribbons indicate the 95% confidence interval of the fits. P values were calculated with c a linear model or d a generalized additive mixed model. The number of patients sampled at each time point is depicted graphically below the X axis of (d). EMRA effector memory re-expressing CD45RA.
Fig. 4
Fig. 4. SOT recipients have higher levels of specific serum chemokines and lower levels of IFN-gamma.
a Bar plots showing proteins that are differentially expressed between control (blue, n = 161) and transplant patients (yellow, n = 80) at Visit 1 (adjusted P < 0.05). b Box plots showing the levels of CX3CL1 and IFNG at Visit 1. a, b P values were calculated using a linear model and Benjamini–Hochberg correction. Boxes show the median and interquartile range (IQR), whiskers were calculated as the 25th percentile minus 1.5 times the IQR and the 75th percentile plus 1.5 times the IQR. c Scatter plot showing the dynamics of CXCL11 level after hospital admission (without adjusting for SARS-CoV-2 viral rpM). The ribbons indicate the 95% confidence interval of the linear mixed-effects model fits. P value was calculated using a linear mixed-effects model and Benjamini–Hochberg correction. The number of patients sampled at each time point is depicted graphically below the X axis of (c).
Fig. 5
Fig. 5. PBMC transcriptomics demonstrates that SOT recipients exhibit increased innate immune gene expression upon hospitalization, and over time.
a Volcano plot highlighting genes differentially expressed (Padj <0.05) between SOT recipients (yellow, n = 66) and controls (blue, n = 147) at the time of hospitalization. b gene set enrichment analysis (GSEA) highlighting pathways differentially enriched in SOT recipients versus controls (without adjustment for SARS-CoV-2 viral reads per million (rpM)). A positive normalized enrichment score (NES) value indicates that the pathway was enriched over time in SOT. A negative NES value indicates that the pathway was enriched over time in controls. c Average gene expression plot of leading-edge genes from significant GSEA pathways. d Differences in the longitudinal dynamics of signaling pathways. e Longitudinal plots highlighting changes in normalized expression of representative immune signaling pathways that significantly differed over time in SOT recipient versus controls. The blue and orange lines indicated the linear mixed-effects model fits, and the ribbons indicate the 95% confidence interval of the fits. P values were calculated with a a linear model or (b, d, e) a linear mixed-effects model with Benjamini–Hochberg correction. The number of patients sampled at each time point is depicted graphically below the X axis of (d). PBMC peripheral blood mononuclear cells, SOT solid organ transplant.
Fig. 6
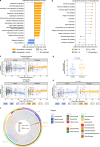
Fig. 6. Upper airway host gene expression and the nasal microbiome differ between SOT recipients and controls.
a Gene set enrichment analysis (GSEA) highlighting pathways differentially enriched in solid organ transplant (SOT) recipients (yellow, n = 63) versus controls (blue, n = 125) in the upper respiratory tract (without adjustment for SARS-CoV-2 viral reads per million (rpM)). b Differences in the longitudinal dynamics of signaling pathways. A positive normalized enrichment score (NES) value indicates that the pathway was enriched over time in SOT. A negative NES value indicates that the pathway was enriched over time in controls. c Longitudinal plots highlighting changes in normalized expression of representative immune signaling pathways that showed significantly different dynamics in SOT recipients versus controls. The ribbons indicate the 95% confidence interval of the linear mixed-effects model fits. P values were calculated with a a linear model or b, c a linear mixed-effects model with Benjamini–Hochberg correction. d Box plot demonstrating differences in upper airway bacterial microbiome alpha diversity in SOT recipients (n = 86) versus controls (n = 172). Boxes show the median and interquartile range (IQR), whiskers were calculated as the 25th percentile minus 1.5 times the IQR and the 75th percentile plus 1.5 times the IQR. P values were calculated with the two-sided Wilcoxon rank-sum test. e Robust regression with 95% confidence intervals highlighting the longitudinal changes in upper airway alpha diversity following hospitalization. f Radial plot highlighting differential abundance from genus (inner most ring) to phylum (outer most ring) and phylogenetic relatedness (inner tree) of taxa differentially enriched in SOT recipients versus controls. P values in (e, f) were calculated with a linear mixed-effects model and f Benjamini–Hochberg correction). The number of patients sampled at each time point is depicted graphically below the X axis of (c, e).
Fig. 7
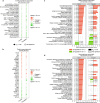
Fig. 7. Host immune correlates of COVID-19 severity differ between SOT recipients and controls.
a Dot plot of immune cell populations that are up- or downregulated in severe patients (TG 4–5, red) compared to mild/moderate patients (TG 1–3, green) within each of the control (n = 107) and transplant (n = 54) groups. b Dot plot of proteins that are up- or downregulated in severe compared to mild/moderate patients within each of the control (n = 161) and transplant (n = 80) groups. c Plots highlighting signaling pathways identified by gene set enrichment analysis (GSEA) from peripheral blood mononuclear cell (PBMC) transcriptomics that were differentially upregulated in severe versus mild/moderate COVID-19 in solid organ transplant (SOT) recipients (right, n = 66) or controls (left, n = 147). d Plots highlighting GSEA-identified signaling pathways from nasal transcriptomics that were differentially upregulated in severe versus mild/moderate COVID-19 in SOT recipients (right, n = 63) or controls (left, n = 125). P values for all analyses were calculated with a linear model and Benjamini–Hochberg correction. CyTOF cytometry by time of flight, PBMC peripheral blood mononuclear cells.
Fig. 8
Fig. 8. Summary schematic highlighting inflammatory dysregulation in SOT recipients hospitalized for COVID-19 based on host/microbe multiomic profiling.
At the time of hospital admission, solid organ transplant (SOT) recipients had higher SARS-CoV-2 abundance, lower anti-SARS-CoV-2 antibody titers, and augmented innate immune gene and protein expression compared to non-SOT controls. Over time, SOT recipients had impaired viral clearance and exhibited persistently increased expression of innate immune signaling pathways. In the upper airway, SOT recipients exhibited differences in the microbiome and transcriptome. In the blood, SOT recipients demonstrated differences in immune cell populations as well as in the expression of genes and proteins central to innate immune responses. Severe disease in transplant recipients was characterized by a less robust induction of proinflammatory genes and chemokines, as well as by differences in immune cell populations. EMRA effector memory re-expressing CD45RA, EM effector memory, CM central memory. Created in BioRender.

Update of

Similar articles

Cited by

References

    1. World Health Organization. WHO Coronavirus (COVID-19) Dashboard. https://covid19.who.int (2023).
    1. Barnes, E. et al. SARS-CoV-2-specific immune responses and clinical outcomes after COVID-19 vaccination in patients with immune-suppressive disease. Nat. Med.29, 1760–1774 (2023). - PMC - PubMed
    1. Müller, T. R. et al. Additive effects of booster mRNA vaccination and SARS-CoV-2 Omicron infection on T cell immunity across immunocompromised states. Sci. Transl. Med.15, eadg9452 (2023). - PMC - PubMed
    1. Trapani, S. et al. Incidence and outcome of SARS-CoV-2 infection on solid organ transplantation recipients: a nationwide population-based study. Am. J. Transpl.21, 2509–2521 (2021). - PMC - PubMed
    1. Kates, O. S. et al. Coronavirus disease 2019 in solid organ transplant: a multicenter cohort study. Clin. Infect. Dis.73, e4090–e4099 (2021). - PMC - PubMed

Publication types

MeSH terms