. 2025 Jan 10;16(1):576.
doi: 10.1038/s41467-024-54908-5.

Small-molecule-induced ERBB4 activation to treat heart failure

Affiliations

Small-molecule-induced ERBB4 activation to treat heart failure

Julie M T Cools et al. Nat Commun. .

Abstract

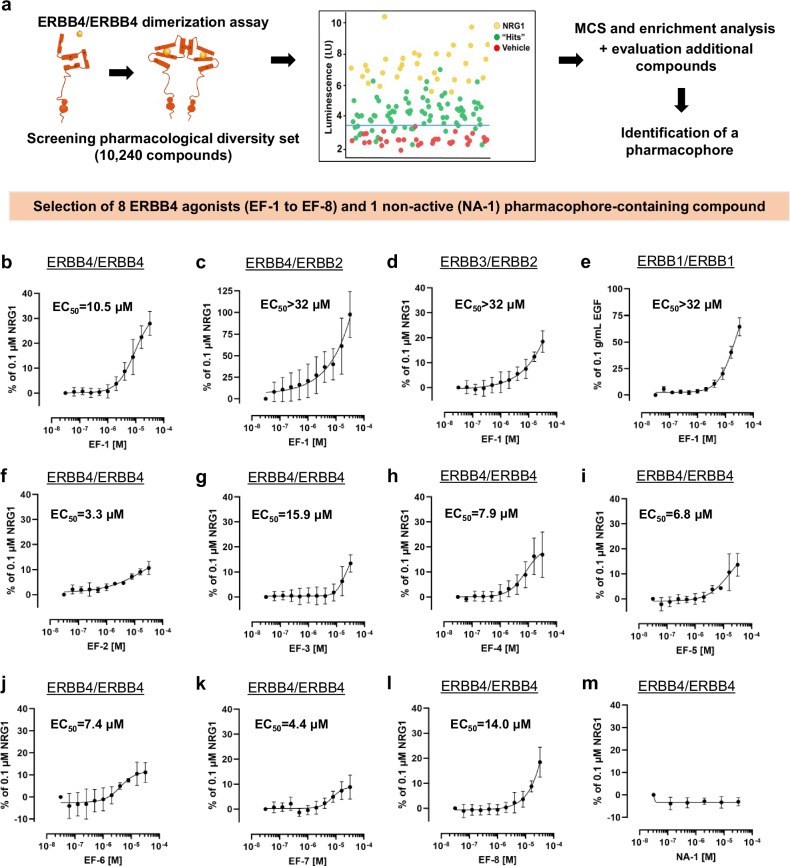
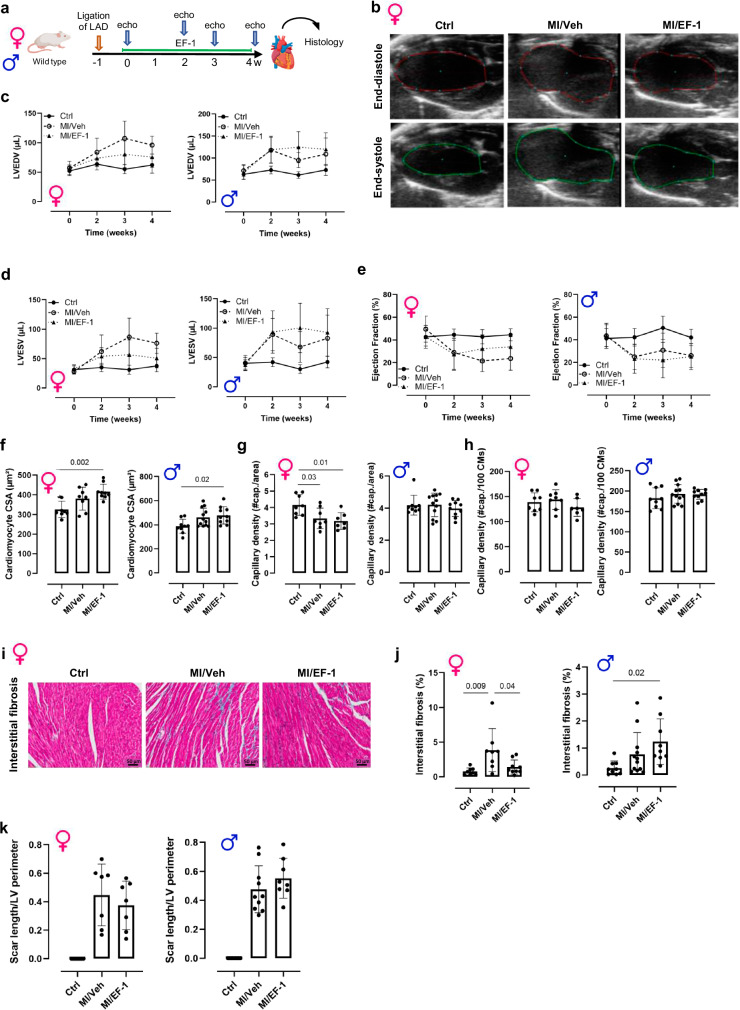
Heart failure is a common and deadly disease requiring new treatments. The neuregulin-1/ERBB4 pathway offers cardioprotective benefits, but using recombinant neuregulin-1 as therapy has limitations due to the need for intravenous delivery and lack of receptor specificity. We hypothesize that small-molecule activation of ERBB4 could protect against heart damage and fibrosis. To test this, we conduct a screening of 10,240 compounds and identify eight structurally similar ones (EF-1 to EF-8) that induce ERBB4 dimerization, with EF-1 being the most effective. EF-1 reduces cell death and hypertrophy in cardiomyocytes and decreases collagen production in cardiac fibroblasts in an ERBB4-dependent manner. In wild-type mice, EF-1 inhibits angiotensin-II-induced fibrosis in males and females and reduces heart damage caused by doxorubicin and myocardial infarction in females, but not in Erbb4-null mice. This study shows that small-molecule ERBB4 activation is feasible and may lead to a novel class of drugs for treating heart failure.


Conflict of interest statement

Competing interests: Patent “MODULATORS OF ERBB4 IN THE TREATMENT OF DISEASES”; EP20210160742; Inventors: V.F.M.S., G.W.D.K., E.F., H.D.W.

Figures

Fig. 1
Fig. 1. High-throughput screening to identify small-molecule ERBB4 agonists.
a An ERBB4/ERBB4 dimerization assay was used to screen 10,240 pharmacologically diverse compounds for their ability to induce ERBB4 homodimerization. The confirmation screen resulted in 62 hits (green dots) with a luminescence signal above threshold (light blue line, 3.5 × 106 LU). MCS analysis and enrichment analysis of the confirmed hits resulted in the identification of a pharmacophore. After the screening and evaluation of additional compounds, 8 candidate ERBB4 agonists were selected. Yellow dots, positive control (NRG1); red dots, negative control (Veh); green dots, hit compounds. DRC of the most potent compound EF-1 in b the ERBB4/ERBB4 dimerization assay (n = 4 biological replicates for every concentration), c the ERBB2/ERBB4 dimerization assay (n = 8 biological replicates for every concentration), d the ERBB2/ERBB3 dimerization assay (n = 6 biological replicates for every concentration) and e the ERBB1/ERBB1 dimerization assay (n = 6 biological replicates for every concentration). fl DRCs of the 7 other selected hit compounds (n = 3 for (g), n = 4 for (f, il) and n = 5 for (h) biological replicates for every concentration) and (m) a non-active compound NA-1 on the ERBB4/ERBB4 dimerization assay (n = 2 biological replicates for every concentration). The signal in the dimerization assays is plotted relative to the signal obtained with 0.1 µM NRG1 (bd, fm) or 0.1 g/mL EGF (e). All data are represented as mean ± SD. Source data are provided as a Source Data file. DRC dose response curve, EGF epidermal growth factor, LU luminescence, MCS maximum common substructure, NA non-active pharmacophore-containing compound, NRG1 neuregulin-1, Veh vehicle.
Fig. 2
Fig. 2. EF-1 and NRG1 activate similar downstream signaling pathways in cultured cardiomyocytes.
Representative western blot images showing the effect of (a) NRG1 (10 nM) and (b) EF-1 (32 µM) on pAkt/Akt and pERK1/2/ERK1/2 pathways in iAMs stimulated for different times. Bar graphs represent the average effects of phosphor-markers normalized to total levels of each protein, relative to vehicle of the same time point; n = 3 (a) or n = 4 (b) biological replicates ± SD; one-way ANOVA with Dunnett’s multiple comparisons test. The samples derive from the same experiment and the blots were processed in parallel. Despite the subtle changes in the representative blots of EF-1, the results were highly reproducible. The uncropped gels are presented in Supplementary Figs. (a) 7 and (b) 8. c Volcano plot showing differential gene expression (two-tailed DESeq2’s Wald test, P adj <0.05) of iAMs in response to EF-1 (n = 4 biological replicates). Vertical dashed lines indicated log2 fold change ≥0.58. The horizontal dashed line indicates -Log10 (P adj <0.05). d Heatmap showing log2 fold change estimates for top DEGs in EF-1-treated iAMs relative to the control group. e Venn diagram of overlapping DEGs between the NRG1 and EF-1 group. f Heatmap showing log2 fold change estimates for top DEGs in EF-1- or NRG1-treated iAMs relative to the control group. Source data are provided as a Source Data file. Akt protein kinase B, ANOVA analysis of variance, DEG differentially expressed gene, ERK extracellular signal-regulated kinase, FC fold change, GAPDH glyceraldehyde-3-phosphate dehydrogenase, iAM conditionally immortalized rat atrial myocyte, NRG1 neuregulin-1, SD standard deviation, Veh vehicle.
Fig. 3
Fig. 3. EF-1 and NRG1 activate similar downstream signaling pathways in human cultured cardiac fibroblasts.
a Volcano plot showing differential gene expression (two-tailed DESeq2’s Wald test, P adj <0.05) of HCFs in response to EF-1 (n = 3 biological replicates). The horizontal dashed line indicates -Log10 (P adj <0.05). b Heatmap showing log2 fold change estimates for top DEGs in EF-1-treated HCFs relative to the control group. c Venn diagram of overlapping DEGs between the NRG1 and EF-1 group. d Heatmap showing log2 fold change estimates for top DEGs in EF-1- or NRG1-treated HCFs relative to the control group. e GSEA of HCFs with EF-1 or NRG1 for gene signatures of TGF-β, PI3K/Akt and MAPK pathway-regulated genes. P-values were adjusted via the Benjamini–Hochberg procedure. fh RT-qPCR on signaling pathway genes in HCFs; normalized FC compared to vehicle (n = 4 biological replicates for every value in each group): f ID2 and BMPR1B, genes involved in TGFβ signaling, g CACNA2D4 and DUSP2, genes involved in MAPK/ERK signaling and h NR4A1 and SGK1, genes involved in PI3k-Akt signaling. All data are represented as mean ± SD, one-way ANOVA with Tukey’s multiple comparisons test. Source data are provided as a Source Data file. Akt protein kinase B, ANOVA analysis of variance, BMPR1B bone morphogenetic protein receptor type 1B, CACNA2D4 calcium voltage-gated channel auxiliary subunit alpha-2 delta-4, DEG differentially expressed gene, DUSP2 dual specificity phosphatase 2, ERK extracellular signal-regulated kinase, FC fold change, GSEA gene set enrichment analysis, HCF human cardiac fibroblast, ID2 Inhibitor of DNA Binding 2, MAPK mitogen-activated protein kinase, NES normalized enrichment score, NRG1 neuregulin-1, NR4A1 nuclear receptor subfamily 4 group A member 1, PI3K phosphatidylinositol 3-kinase, RT-qPCR real-time quantitative polymerase chain reaction, SGK1 serum/glucocorticoid-regulated kinase 1, TGF-β transforming growth factor-β.
Fig. 4
Fig. 4. EF-1 decreases collagen production in fibroblasts, and decreases cardiomyocyte cell death and hypertrophy.
a Effect of TGF-β1 on COL3A1 mRNA expression in HCFs (n = 6 biological replicates for Vehicle group and n = 3 biological replicates for TGFβ group). b ERBB4 knockdown efficiency of siRNAs against ERBB4 compared to control (i.e. scrambled) siRNAs in HCFs (n = 4 biological replicates for SiScr group and n = 6 biological replicates for SiERBB4 group). c COL3A1 mRNA expression after stimulation with EF-1 (4–32 µM) and TGF-β1 in the presence of scrambled (full line with full circle; n = 3 biological replicates for every concentration) or ERBB4-specific siRNAs (dashed line with square; n = 6 biological replicates for every concentration, except n = 5 biological replicates for 16 µM EF-1), or after stimulation with NA-1 (dashed line with triangle; n = 3 biological replicates for every concentration). d Effect of H2O2 on cardiomyocyte cell death (n = 9 biological replicates for Vehicle group and n = 14 biological replicates for H2O2 group). e Erbb4 knockdown efficiency of siRNA against Erbb4 compared to control (i.e. scrambled) siRNAs in iAMs (n = 10 biological replicates for SiScr group and n = 13 biological replicates for SiERBB4 group). f Effect of H2O2 on total cell death of iAMs in the presence of NA-1 (dashed line with triangle; n = 4 for every concentration, except n = 3 biological replicates for 1 µM NA-1), or in the presence of EF-1 (4–32 µM) after transfection with scrambled (full line with full circle; n = 3 biological replicates for every concentration) or Erbb4-specific siRNAs (dashed line with square; n = 3 biological replicates for every concentration). g CSA of iAMs after AngII exposure in the presence or absence of EF-1 (4–32 µM; n = 27 cell areas for Vehicle group, 38 for AngII + 8 µM EF-1 group and 40 for AngII group, AngII + 4 µM EF-1 group, AngII + 16 µM EF-1 group and AngII + 32 µM EF-1 group). Scale bar = 100 µm. h Effect of H2O2 on total cell death of iAMs in the presence or absence of the PI3K/AKT-pathway inhibitor LY294002, with and without EF-1 (32 µM, n = 3 biological replicates for Vehicle and H2O2/Vehicle group, n = 4 biological replicates for H2O2/EF-1 group and all groups with LY294002). i CSA of iAMs after AngII exposure in the presence or absence of the ERK-pathway inhibitor PD98059, with and without EF-1 (32 µM, n = 20 cell areas for all groups). All data are represented as mean ± SD, two-tailed unpaired t-test or one-way ANOVA with Dunnett’s multiple comparisons test against respective concentration for siScr. P-values shown in (c) and (f) are between EF-1 + siScr and EF-1 + siERRB4. Source data are provided as a Source Data file. AngII angiotensin II, ANOVA analysis of variance, COL3A1 collagen type 3 alfa 1, CSA cross sectional area, FC fold change, H2O2 hydrogen peroxide, HCF human cardiac fibroblast, iAM conditionally immortalized rat atrial myocyte, M molar concentration, NA non-active compound containing the pharmacophore, SD standard deviation, siERBB4 silencing RNA against ERBB4, siScr silencing RNA against scrambled control, TGF-β1 transforming growth factor β1, Veh vehicle.
Fig. 5
Fig. 5. EF-1 prevents cardiac fibrosis in vivo.
a Design of the in vivo experiments. Created in BioRender. Cools, J. (2024) https://BioRender.com/y82u338. Hearts were collected after 1 week for mRNA analysis and after 4 weeks for histological analysis. bd RT-qPCR was performed on fibrosis and cardiac stress markers; normalized FC compared to Ctrl: b Col1a1 (n = 10 biological replicates in ctrl group, n = 9 biological replicates in AngII/Veh group and n = 8 biological replicates in AngII/EF-1 group), c Col3a1 (n = 10 biological replicates in ctrl group and n = 9 biological replicates in AngII/Veh and AngII/EF-1 group) and d Nppa (n = 7 biological replicates in ctrl group, n = 10 biological replicates in AngII/Veh group and n = 9 biological replicates in AngII/EF-1 group). e Representative images of Masson’s trichrome staining of AngII-induced myocardial fibrosis following treatment with EF-1 or Veh and corresponding bar graphs showing the quantitation for total, interstitial and perivascular fibrosis in male wild type mice (n = 4 mice in EF-1 group and n = 5 in all other groups). f Representative images of Masson’s trichrome staining of AngII-induced myocardial fibrosis following treatment with EF-1 or Veh and corresponding bar graphs showing the quantitation for total and perivascular fibrosis in female wild type mice (n = 8 mice in all groups). g Representative images of Masson’s trichrome staining of AngII-induced myocardial fibrosis in male and female Erbb4-null mice, treated with EF-1 or Veh and corresponding graphs showing the quantitation for total and perivascular fibrosis (n = 6 mice in Ctrl group and n = 5 in all other groups). Scale bar = 500 µm for total fibrosis, 50 µm for interstitial and perivascular fibrosis. All data are represented as mean ± SD, one-way ANOVA with Tukey’s multiple comparisons test. Source data are provided as a Source Data file. AngII angiotensin II, ANOVA analysis of variance, Col1a1 collagen type 1 alpha 1, Col3a1 collagen type 3 alpha 1, Ctrl control, echo echocardiography, FC fold change, NA non-activating pharmacophore-containing compound, Nppa atrial natriuretic peptide, RT-qPCR reverse transcription-quantitative polymerase chain reaction, SD standard deviation, Veh vehicle.
Fig. 6
Fig. 6. EF-1 prevented cardiomyocyte cell death in vivo in female mice.
a Design of the in vivo DOX experiment. Created in BioRender. Cools, J. (2024) https://BioRender.com/y82u338. Graphs showing the cTnI levels measured in plasma samples of untreated control mice and of mice treated for 7 days with EF-1 or Veh and given a single IP injection of 20 mg/kg DOX on day 4 of treatment for b female wild type mice (n = 9 mice in Ctrl group, n = 8 mice in all other groups), c male wild type mice (n = 8 mice in Ctrl group, n = 9 mice in all other groups) and d Erbb4-null mice (n = 9 mice in DOX/Veh group, n = 8 mice in all other groups). All data are represented as mean ± SD, one-way ANOVA test with Tukey’s correction for multiple testing. Source data are provided as a Source Data file. ANOVA analysis of variance, cTnI cardiac troponin I, Ctrl control, DOX doxorubicin, IP intraperitoneal, SD standard deviation, Veh vehicle.
Fig. 7
Fig. 7. EF-1 decreases ventricular dilation after MI in female mice.
a Design of the in vivo MI experiment. Created in BioRender. Cools, J. (2024) https://BioRender.com/y82u338. b Representative echocardiographic images in end-diastole and end-systole of sham-operated control female mice and of mice that underwent MI for 4 weeks with EF-1 or Veh. Graphs showing (c) LVEDV, (d) LVESV and (e) EF in the different experimental groups during the entire experiment in both female and male mice. Ctrl = full line with full circle; MI/Veh = dashed line with open circle; MI/EF-1 = dashed line with triangle. f CSA of cardiomyocytes analyzed with an isolectin-B4/WGA/DAPI staining in female and male mice. Vascularization analysis of capillaries with an isolectin-B4/WGA/DAPI staining, showing the number of capillaries in female and male mice (g) per area of cardiomyocytes and (h) per 100 cardiomyocytes. i Representative images of Masson’s trichrome staining of interstitial fibrosis in the remote zone in female mice. j Corresponding graph quantifying the fibrotic area in the different experimental groups in female mice and the graph of the quantification of the fibrotic area in male mice. k Scar size analysis of the myocardial infarction area in female and male mice. Scale bar = 50 µM for interstitial firosis. All data are represented as mean (biological replicates) ± SD, n = 8 female mice in Ctrl and MI/Veh group, n = 9 female mice in MI/EF-1 group; n = 10 male mice in Ctrl group and MI/EF-1 group on T2 and T4, n = 5 male mice in Ctrl group and MI/EF-1 group on T0 and T3, n = 12 male mice in MI/Veh group on T2 and T4, n = 6 male mice in MI/Veh group on T0 and T3, one-way ANOVA test with Tukey’s correction for multiple testing. Source data are provided as a Source Data file. ANOVA analysis of variance, CSA cross-sectional area, Ctrl control, DAPI 4’,6-Diamidino-2-phenylindole dihydrochloride, EF ejection fraction, IP intraperitoneal, LVEDV left-ventricular end-diastolic volume, LVESD left-ventricular end-systolic volume, MI myocardial infarction, SD standard deviation, Veh vehicle, WGA wheat germ agglutinin.

References

    1. Nemeth, B. T., Varga, Z. V., Wu, W. J. & Pacher, P. Trastuzumab cardiotoxicity: from clinical trials to experimental studies. Br. J. Pharm.174, 3727 (2017). - PMC - PubMed
    1. Zeglinski, M., Ludke, A., Jassal, D. S. & Singal, P. K. Trastuzumab-induced cardiac dysfunction: A ‘dual-hit’. Exp. Clin. Cardiol.16, 70–74 (2011). - PMC - PubMed
    1. Gassmann, M. et al. Aberrant neural and cardiac development in mice lacking the ErbB4 neuregulin receptor. Nature378, 390–394 (1995). - PubMed
    1. Meyer, D. & Birchmeier, C. Multiple essential functions of neuregulin in development. Nature378, 386–390 (1995). - PubMed
    1. Lee, K. F. et al. Requirement for neuregulin receptor erbB2 in neural and cardiac development. Nature378, 394–398 (1995). - PubMed

MeSH terms

LinkOut - more resources