. 2025 Jan 10;15(1):1629.
doi: 10.1038/s41598-025-85202-z.

Amplitude and frequency of human gait synchronization with a machine oscillator system

Affiliations

Amplitude and frequency of human gait synchronization with a machine oscillator system

Ryan T Schroeder et al. Sci Rep. .

Abstract

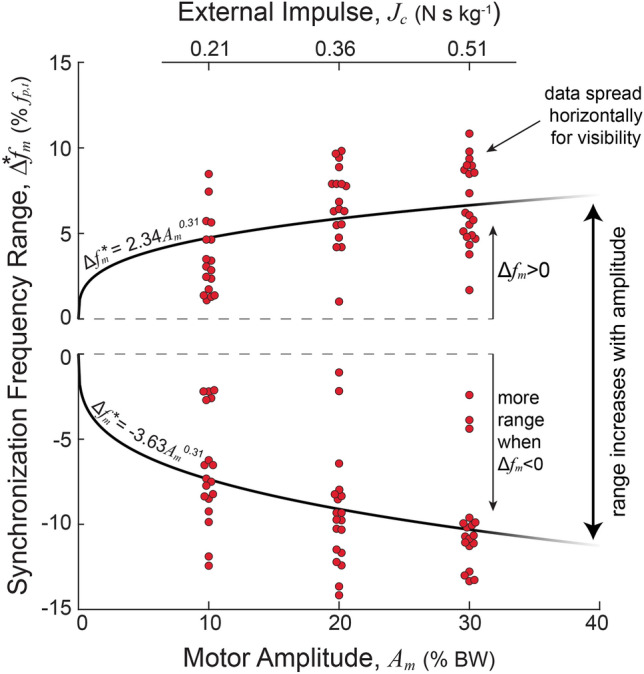
Humans sometimes synchronize their steps to mechanical oscillations in the environment (e.g., when walking on a swaying bridge or with a wearable robot). Previous studies have discovered discrete frequencies and/or amplitudes where individuals spontaneously synchronize to external oscillations, but these parameters are often chosen arbitrarily or for convenience of a successful experiment and are sparsely sampled due to time constraints on subject availability. As a result, the parameter space under which human gait synchronization occurs is still relatively underexplored. Here we systematically measure synchronization over a broad range of parameters in machine oscillations, applied vertically near the body center of mass during walking. Two complementary experiments were utilized to characterize the amplitudes and frequencies where subjects' gait matched the oscillation frequency within ± 0.02 Hz for at least 80% of 20 consecutive steps (i.e., synchronization). Individuals were found to synchronize at lower amplitudes and in less time when the oscillation frequency was nearer their baseline step frequency, as well as over a broader range of frequencies during larger oscillation amplitudes. Subjects also had a greater tendency to synchronize with oscillation frequencies below (rather than above) their baseline step frequencies. The results of this study provide a comprehensive mapping of parameters where synchronization occurs and could inform the design of exoskeletons, rehabilitation devices and other gait-assistive technologies.

Keywords: Amplitude; Entrainment; Frequency; Locomotion; Oscillator; Walking.


Conflict of interest statement

Declarations. Competing interests: The authors declare no competing interests.

Figures

Fig. 1
Fig. 1
System schematic and images. (A) A schematic of the oscillator system is depicted in the sagittal plane. (B) Images of a subject walking in the system during a trial, from the side and from behind. Downward force came as the resultant of self-equalizing oblique cables. A curtain was used to blind the subject from any motion of the pulleys or motors, and headphones were used to play ambient noise to block out rhythmic sounds from the system. Harness pulleys were mounted on rollers to allow realignment with the subject’s fore-aft position on the treadmill.
Fig. 2
Fig. 2
Experiment protocols. (A) In the Time-varying Amplitude (TVA) Experiment, motor frequency is held constant (fm, blue) while motor amplitude increases over time (Am, dark red). Subjects are predicted to eventually synchronize their gait with the force oscillations (by matching their step frequency fs with the motor frequency fm), and the corresponding amplitude defines sensitivity (formula image). This experiment is repeated for multiple motor frequencies (Δfm) relative to their baseline preferred frequency (fp), and waveforms of current sent to the motors (Ic(t) in red; not to scale) are shown with amplitude gradually increasing over time. (B) In the Time-varying Frequency (TVF) Experiment, motor frequency is varied gradually over time, and amplitude is held constant. Subjects are predicted to synchronize their gait with the oscillations over a finite range of motor frequencies (formula image) relative to their baseline preferred step frequency. This experiment is repeated for multiple amplitudes.
Fig. 3
Fig. 3
Example trial. The TVA Experiment is shown for formula image. (A) Step frequency over time (fs, magenta), begins near baseline preferred and drifts toward motor frequency (fm, blue) during synchronization. (B) Motor amplitude (Am) shown in red (left axis) and the positive (i.e., pulling upward) measured impulse (Jc) relative to baseline plotted in light blue (right axis). (C) Mean active force oscillation (± 1 standard deviation) plotted for Am = 20, 30% BW, and all traces shown for Am = 10% BW, since force alignment is inconsistent sans synchronization. Force signal commanded to motors (grey dashed), shown for comparison to measured forces. Force curves are associated with data outlined in boxes in (A) and (B), labeled (i), (ii) and (iii). Alignment of force oscillations relative to double stance (DS) and middle stance (MS) is viewed relative to the step cycle.
Fig. 4
Fig. 4
Frequency response to TVA experiment. Filtered subject step frequency (Freq.) is shown over time (magenta is median and grey shaded region is 25–75th percentiles of data from all subjects who synchronized during the trial). Motor frequency is held constant (blue) and subject baseline preferred is indicated (dashed grey line) for reference. The prescribed motor amplitude (Amp.) is shown (red) over the course of the experiment. The number of subjects included in each data trend are indicated at the top of each subplot (N).
Fig. 5
Fig. 5
Amplitude sensitivity to synchronization. Motor amplitudes where subjects first synchronized with the external oscillations (formula image) are shown to indicate subject sensitivity as a function of motor frequency (Δfm). The measured external impulse associated with amplitude sensitivity (formula image) is also shown in a second vertical axis. Each data point represents the observed sensitivity of a single subject during a single trial (N = 56). Interpolation from a linear regression model is shown. In this experiment, lower amplitudes are interpreted to mean that a subject has higher sensitivity to synchronization and vice versa. In this sense, subjects exhibited higher sensitivity to synchronization at motor frequencies below their preferred step frequency at baseline (i.e., Δfm < 0).
Fig. 6
Fig. 6
Frequency response to TVF experiment. Filtered subject step frequency (Freq.) is shown over time (magenta is median and grey shaded region is 25–75th percentiles of data from all subjects who synchronized during the trial). Motor frequency is varied over time (blue) and subject baseline preferred is indicated (dashed grey line) for reference. The prescribed motor amplitude (Amp.) is shown (red) as a step function until the end of the experiment. The number of subjects included in each data trend are indicated at the top of each subplot (N).
Fig. 7
Fig. 7
Frequency range of synchronization. The range of frequencies associated with subject synchronization (formula image) are shown as a function of motor amplitude (Am) prescribed in testing conditions. A linear function was used to map external impulse from the oscillations onto motor amplitude, relative to baseline. Each data point represents a single subject during a single trial (N = 114), where variation in motor amplitude data is artificially added for visibility. Interpolation is used to show trendlines of frequency range over motor amplitude (solid black curve).

References

    1. Crowe, A., Schiereck, P., de Boer, R. W. & Keessen, W. Characterization of human gait by means of body center of mass oscillations derived from ground reaction forces. IEEE Trans. Biomed. Eng.42, 293–303 (1995). - PubMed
    1. Strogatz, S. H. & Stewart, I. Coupled oscillators and biological synchronization. Sci. Am.269, 102–109 (1993). - PubMed
    1. Dallard, P. et al. London Millennium Bridge: Pedestrian-induced lateral vibration. J. Bridg. Eng.6, 1–6 (2012).
    1. Strogatz, S. H., Abrams, D. M., McRobie, A., Eckhardt, B. & Ott, E. Crowd synchrony on the Millennium Bridge. Nature438, 43–44 (2005). - PubMed
    1. Joshi, V. & Srinivasan, M. Walking crowds on a shaky surface: Stable walkers discover Millennium Bridge oscillations with and without pedestrian synchrony. Biol. Lett.14, 20180564 (2018). - PMC - PubMed

Publication types

LinkOut - more resources