. 2025 Apr;32(4):763-775.
doi: 10.1038/s41418-024-01429-9. Epub 2025 Jan 10.

Tenascin-C promotes bone regeneration via inflammatory macrophages

Affiliations

Tenascin-C promotes bone regeneration via inflammatory macrophages

Qian Ren et al. Cell Death Differ. 2025 Apr.

Abstract

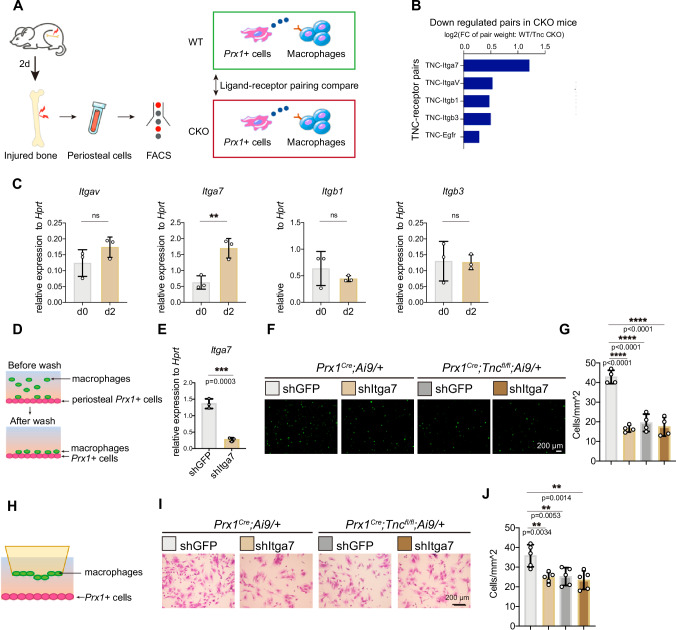
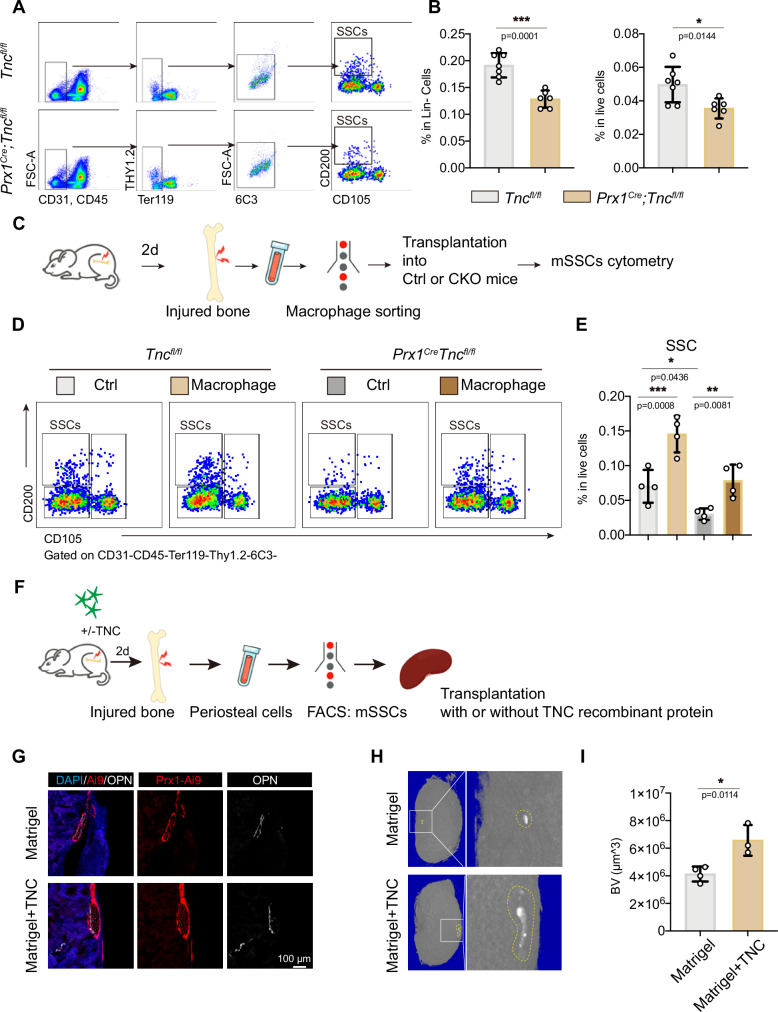
During the early stage of tissue injury, macrophages play important roles in the activation of stem cells for further regeneration. However, the regulation of macrophages during bone regeneration remains unclear. Here, the extracellular matrix (ECM) tenascin-C (TNC) is found to express in the periosteum and recruit inflammatory macrophages. TNC-deficiency in the periosteum delays bone repair. Transplantation of macrophages derived from injured periosteum is able to rescue the decreased skeletal stem cells and impaired bone regeneration caused by TNC deficiency. The cell communication analysis identifies ITGA7 as a TNC receptor contributing to the recruitment of inflammatory macrophages. TNC expression declines in aged mice and the exogenous delivery of TNC significantly promotes bone regeneration after aging through the recruitment of macrophages. Taken together, this study reveals the regulation of macrophage recruitment and its function in the activation of skeletal stem cells after bone injury, providing a strategy to accelerate bone regeneration by TNC delivery.


Conflict of interest statement

Competing interests: The authors declare no competing interests.

Figures

Fig. 1
Fig. 1. Expression of TNC increased after bone defect injury, and its deficiency in Prx1+ cells led to bone repair delay.
A The schematic diagram of drill injury. B Representative immunofluorescence images showing the expression of TNC in the periosteum of wild type (WT) mice at uninjured (d0), 2-day post injury (d2), 7-day post injury (d7). C Quantitative RT-PCR detection of the Tnc gene expression in periosteal Prx1+ cells of Prx1Cre; Ai9/+ mice at d0, d2, d7. n = 5 for d0, n = 6 for d2, d7. D Representative micro-CT images of the drill holes in the femoral bone of Tncfl/fl and Prx1Cre;Tncfl/fl mice at 14-day post bone defect injury, where the black dashed circle illustrated the regenerated bone in the drill hole. E Quantitative measurements of bone volume (BV) and bone volume per tissue volume (BV/TV) of the newly formed bone in the drill holes. n = 12. Representative images of Prx1Cre; Ai9/+ and Prx1Cre; Tncfl/fl; Ai9/+ mice (F) and the quantification of the Ai9+ area (G). n = 4 for Ctrl, n = 3 for CKO. The immunofluorescence of the ossification marker osteopontin (OPN) (H) and the quantification of the OPN+ area (I) in the drill holes of Tncfl/fl and Prx1Cre;Tncfl/fl mice at 14-day post bone defect injury. n = 3. J The schematic diagram of periosteum scratch injury. K Representative immunofluorescence images showing the expression of TNC in the periosteum of wild type (WT) mice at uninjured (d0), 2-day post injury (d2), 7-day post scratch injury (d7). L Quantitative RT-PCR detection of the Tnc gene expression in periosteal Prx1+ cells of Prx1Cre; Ai9/+ mice at d0, d2, d7 after scratch injury. n = 4. M Representative images of periosteum of Prx1Cre; Ai9/+ and Prx1Cre; Tncfl/fl; Ai9/+ mice at d7 of scratch injury. Quantitative results of the chondrocytes marked by Sox9 (N) (n = 3), the cartilage area (O) (n = 6) and the expression of the indicated genes of Ai9+ cells at d7 after scratch injury (P) (n = 4). Q Representative images of the Sirius Red staining of the periosteum at d7 after scratch injury. R Quantification of the fibrosis area in the periosteum according to the Sirius Red staining. n = 4 for Ctrl, n = 3 for CKO. S Quantitative RT-qPCR examination of the indicated genes in Ai9+ cells at d7 after scratch injury. n = 3. The statistical significance of differences was assessed using two-tailed Student’s unpaired t test or one-way ANOVA. All bar graphs are presented as the mean ± SD.
Fig. 2
Fig. 2. TNC-deficiency impaired osteogenic and chondrogenic differentiation of the periosteal Prx1+ cells after bone injury.
A ALP (upper panel) and Alizarin Red S (lower panel) staining of primary periosteal cells from the indicated mice 2-day post bone drill injury after induction with osteogenic medium for 7 days and 21 days, respectively. Quantification of the percentage of ALP- stained area (B) (n = 3). Quantification of the percentage of Alizarin Red S area and the relative activity of ALP (C) (n = 4). D Quantitative RT-qPCR detection of osteogenic biomarker genes (Alp, Col1a1, Osx, Bsp) and Tnc in the osteogenic differentiated cells. n = 3. E Quantification of cell proliferation of the sorted tdTomato+ periosteal cells from the indicated mice 2-day post bone drill injury in CCK-8 assay. n = 6. Representative images of the Alcian blue staining and Col2 staining (F) and the expression of the indicated genes of the chondrogenic differentiated periosteal cells after scratch injury (G). n = 3. The statistical significance of differences was assessed using two-tailed Student’s unpaired t test. All bar graphs are presented as the mean ± SD.
Fig. 3
Fig. 3. Decreased macrophage recruitment after bone injury in Prx1Cre;Tncfl/fl mice.
A Scheme of the experiment: 2 days after the femoral bone of Tncfl/fl and Prx1Cre;Tncfl/fl mice were drill injured, the percentage of macrophages in the periosteal cells were analyzed by flow cytometry. B Flow cytometry analysis of the periosteal macrophages at 2-day post injury. C Quantification of the percentage of total macrophages and M1, M2 macrophages in the periosteal cells at 2-day post injury. n = 5 for Ctrl, n = 6 for CKO. D Representative immunofluorescence images and their corresponding images reconstructed by imaris of the periosteum in Prx1Cre; Ai9/+ and Prx1Cre; Tncfl/fl; Ai9/+ mice at d0 and d2, where tdTomato and CD68 signal marking the periosteal Prx1+ cells and macrophages, respectively. Quantification of the CD68+ cells (E) and the shortest distance between tdTomato+ cells and CD68+ cells (F) in the periosteum at indicated mice and time points. n = 4 or 5. G Experiment scheme of the adhesion assay: confluent primary periosteal Prx1+ cells from the periosteum of Prx1Cre;Ai9/+ and Prx1Cre;Tncfl/fl ;Ai9/+ mice at d2 were seeded in the culture dish and the macrophages from the periosteum of WT mice at d2 stained by Calcein-AM were added in the dish for 30 min for cell adhesion before the un-adhered cells were washed. Representative images (H) and quantification (I) of the adhered macrophages in the adhesion assay. n = 3. J Experiment scheme of the trans-well assay: the periosteal Prx1+ cells from the periosteum of Prx1Cre;Ai9/+ and Prx1Cre;Tncfl/fl ;Ai9/+ mice at d2 were seeded in the lower chamber to induce the migration of the macrophages from the periosteum of WT mice at d2 seeded in the upper chamber. Representative images (K) and quantification (L) of the migrated macrophages (stained by crystal violet). n = 5. M Representative micro-CT images and immunofluorescence images of the drill holes with transplantation of macrophages from the periosteum of WT mice at d2 in the femoral bone of Tncfl/fl and Prx1Cre;Tncfl/fl mice at 14-day post bone defect injury. Quantitative measurements of bone volume (BV) (N) and bone volume per tissue volume (BV/TV) (O) of the newly formed bone in the drill holes of the indicated mice with macrophages transplantation. n = 5 or 6. The statistical significance of differences was assessed using two-tailed Student’s unpaired t test or two-way ANOVA. All bar graphs are presented as the mean ± SD.
Fig. 4
Fig. 4. TNC promoted the recruitment of macrophage through ITGA7.
A Scheme for experiment and analysis of cell crosstalk mediated by Prx1+ cells-derived TNC and the receptor of TNC. 2 days after the femoral bone of Prx1Cre;Ai9/+ and Prx1Cre;Tncfl/fl ;Ai9/+ mice were drill injured, periosteal cells were isolated for the FACS of Prx1+ cells, labeling by tdTomato, and macrophages for RNA-seq. With the RNA-seq data of the two types of cells, NATMI identified the pairs of TNC and its receptors, which were ranked by their weights calculated by the expression foldchange between control and CKO group. B Summary of the analysis result described in (A). C RT-qPCR examination of the gene expression of the indicated integrins in the periosteal macrophages isolated by FACS at d0 and d2. n = 3. D Experiment scheme of the adhesion assay: confluent primary periosteal Prx1+ cells from the periosteum of mice at d2 were seeded in the culture dish and the macrophages from the periosteum of mice at d2 treated with indicated lentivirus and then stained by Calcein-AM were added in the dish for 30 min for cell adhesion before the un-adhered cells were washed. E Itga7 gene expression examined by RT-qPCR in macrophages infected with indicated lentivirus. n = 3. Representative images (F) and quantification (G) of the adhered macrophages in the adhesion assay. n = 4. H Experiment scheme of the trans-well assay: the periosteal Prx1+ cells from the periosteum of mice at d2 were seeded in the lower chamber to induce the migration of the indicated macrophages from the periosteum of mice at d2 seeded in the upper chamber. Representative images (I) and quantification (J) of the migrated macrophages (stained by crystal violet). n = 5. The statistical significance of differences was assessed using two-tailed Student’s unpaired t test or one-way ANOVA. All bar graphs are presented as the mean ± SD.
Fig. 5
Fig. 5. mSSCs decreased in Prx1Cre;Tncfl/fl mice after bone injury.
A Flow cytometry analysis of mSSCs in the periosteum at 2-day post injury. (B) Quantification of the percentage of mSSCs in the periosteal cells at 2-day post injury. n = 7 for Ctrl, n = 6 for CKO. (C) Experiment scheme: 2 days after bone drill injury of WT mice, macrophages of periosteum were sorted for transplantation to drill-injured Tncfl/fl and Prx1Cre;Tncfl/fl mice. 2 days after the transplantation of macrophages, the percentage of mSSCs in periosteum was analyzed by flow cytometry. D Flow cytometry analysis of the periosteal mSSCs at 2-day post injury and macrophages transplantation. E Quantification of the percentage of mSSCs in the periosteal cells at 2-day post injury. n = 4. F Experiment scheme: femoral bone of Prx1Cre;Ai9/+ mice were drill injured with or without the treatment of TNC. 2 days after the injury, mSSCs in the periosteum were sorted for the transplantation to renal capsule. G Representative immunofluorescence images of the kidneys with mSSCs transplantation, where the transplanted cells were labeled by tdTomato and bone was labeled by OPN. Representative micro-CT images (H) of the kidneys with indicated treatment where the yellow dashed line illustrating the new-formed bone in the renal capsule and the quantification (I) of bone volume per tissue volume (BV/TV) of the newly formed bone in the renal capsule. n = 4 for Ctrl, n = 3 for treatment group. The statistical significance of differences was assessed using two-tailed Student’s unpaired t test or two-way ANOVA. All bar graphs are presented as the mean ± SD.
Fig. 6
Fig. 6. Local delivery of TNC improved bone regeneration after aging.
Representative immunofluorescence images of TNC in the homeostatic periosteum (A) and the quantification of TNC area in young and old mice (B). C Quantitative RT-qPCR detection of the Tnc gene expression in periosteum of young and old mice. Flow cytometry of macrophages at d2 of drill injury (D) and quantification results (E) in periosteum of young and old mice. n = 5 for young group, n = 4 for old group. (F, G) Representative immunofluorescence images of macrophages (F) and quantification (G) in the periosteum of young and old mice. Representative immunofluorescence images of TNC (H) and quantification of TNC area (I) in the periosteum of young and old mice 2 days after drill injury. n = 4 for young group, n = 5 for old group. J Representative micro-CT images and immunofluorescence images of the drill holes in the femoral bone of WT young and old mice at 14-day post bone defect injury, where the black dashed circle illustrated the regenerated bone in the drill holes. Quantitative measurements of bone volume (BV) (K) and bone volume per tissue volume (BV/TV) of the newly formed bone in the drill holes (L). n = 8 or 10. The statistical significance of differences was assessed using two-tailed Student’s unpaired t test or two-way ANOVA. All bar graphs are presented as the mean ± SD.

References

    1. Deutschbein J, Lindner T, Möckel M, Pigorsch M, Gilles G, Stöckle U, et al. Health-related quality of life and associated factors after hip fracture. Results from a six-month prospective cohort study. PeerJ. 2023;11:e14671. - PMC - PubMed
    1. Bergh C, Möller M, Ekelund J, Brisby H. Mortality after sustaining skeletal fractures in relation to age. J Clin Med. 2022;11:2313. - PMC - PubMed
    1. Einhorn TA, Gerstenfeld LC. Fracture healing: mechanisms and interventions. Nat Rev Rheumatol. 2015;11:45–54. - PMC - PubMed
    1. Wynn TA, Vannella KM. Macrophages in tissue repair, regeneration, and fibrosis. Immunity. 2016;44:450–62. - PMC - PubMed
    1. Watanabe S, Alexander M, Misharin AV, Budinger GRS. The role of macrophages in the resolution of inflammation. J Clin Investig. 2019;129:2619–28. - PMC - PubMed

LinkOut - more resources