. 2025 Feb;10(2):541-553.
doi: 10.1038/s41564-024-01912-6. Epub 2025 Jan 10.

Ecological dynamics of Enterobacteriaceae in the human gut microbiome across global populations

Affiliations

Ecological dynamics of Enterobacteriaceae in the human gut microbiome across global populations

Qi Yin et al. Nat Microbiol. 2025 Feb.

Abstract

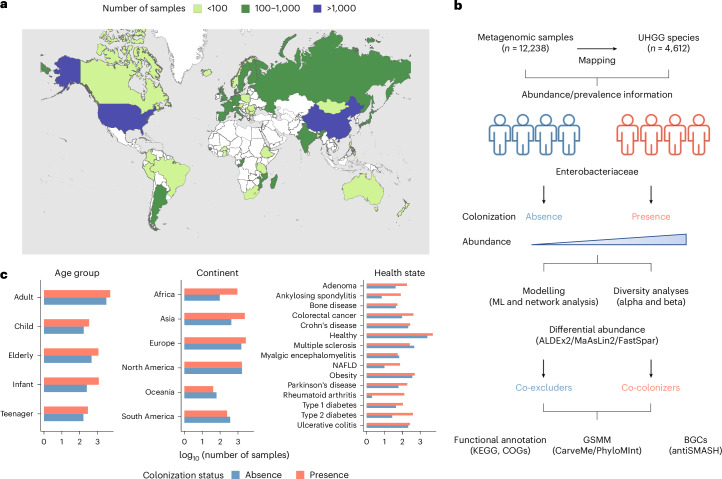
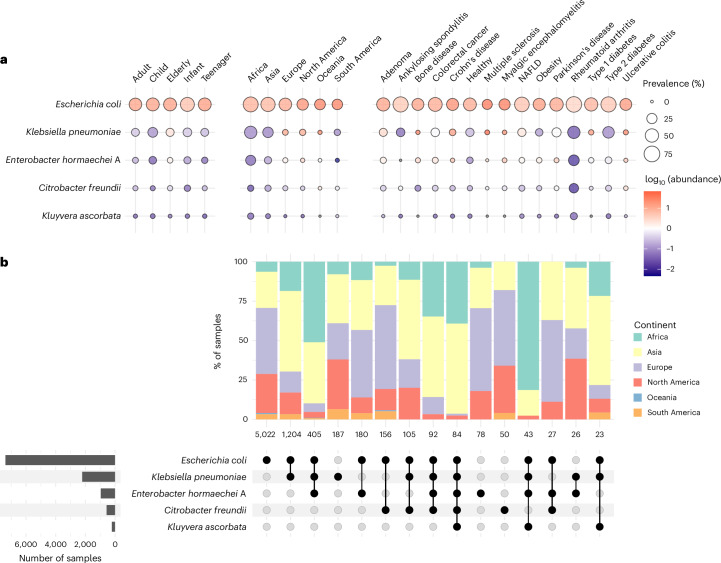
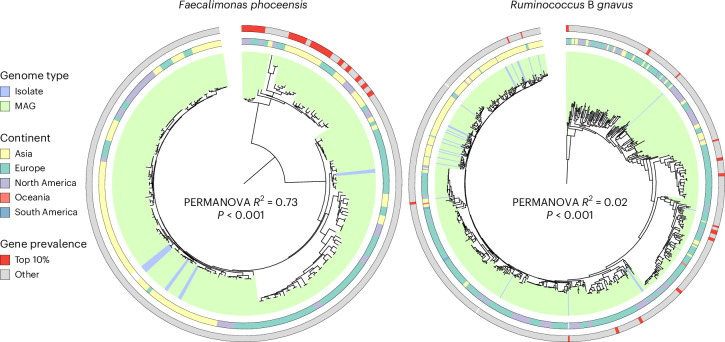
Gut bacteria from the Enterobacteriaceae family are a major cause of opportunistic infections worldwide. Given their prevalence among healthy human gut microbiomes, interspecies interactions may play a role in modulating infection resistance. Here we uncover global ecological patterns linked to Enterobacteriaceae colonization and abundance by leveraging a large-scale dataset of 12,238 public human gut metagenomes spanning 45 countries. Machine learning analyses identified a robust gut microbiome signature associated with Enterobacteriaceae colonization status, consistent across health states and geographic locations. We classified 172 gut microbial species as co-colonizers and 135 as co-excluders, revealing a genus-wide signal of colonization resistance within Faecalibacterium and strain-specific co-colonization patterns of the underexplored Faecalimonas phoceensis. Co-exclusion is linked to functions involved in short-chain fatty acid production, iron metabolism and quorum sensing, while co-colonization is linked to greater functional diversity and metabolic resemblance to Enterobacteriaceae. Our work underscores the critical role of the intestinal environment in the colonization success of gut-associated opportunistic pathogens with implications for developing non-antibiotic therapeutic strategies.


Conflict of interest statement

Competing interests: The authors declare no competing interests.

Figures

Fig. 1
Fig. 1. Exploring the global ecological landscape of Enterobacteriaceae.
a, Geographic distribution of the 12,238 human gut metagenomic samples used in this study. b, Workflow developed to identify and functionally characterize Enterobacteriaceae co-excluders and co-colonizers. ML, machine learning; GSMM, genome-scale metabolic modelling; BGCs, biosynthetic gene clusters. c, Metadata distribution of the number of samples where no Enterobacteriaceae species was detected (Absent) or at least one species was detected (Presence).
Fig. 2
Fig. 2. Distribution and diversity of the most prevalent Enterobacteriaceae species.
a, Prevalence and median abundance of representative species from the five most prevalent Enterobacteriaceae genera across different age groups, continents and health states. b, Upset plot showing Enterobacteriaceae co-colonization patterns. Vertical bars represent the proportion of samples by continent harbouring the species highlighted in the lower panel. Numbers below the bars indicate sample size. Horizontal bars in the lower left panel show the total number of samples in which each species was detected.
Fig. 3
Fig. 3. Gut microbiome composition is associated with Enterobacteriaceae colonization and abundance.
a, ROC curve of the machine learning results linking the gut microbiome composition with Enterobacteriaceae, E. coli or K. pneumoniae colonization status. AUROC values were obtained with gradient boosting applied to the 12,238 human gut metagenomes. b, Phylogenetic tree of the 306 bacterial species associated with Enterobacteriaceae colonization and abundance. Clades are coloured according to their affiliated order. Red and blue colours in the outer layer indicate the number of analyses (out of 12) in which each species was classified as a co-excluder (negative) or co-colonizer (positive). A maximum score of 12 denotes that the species was found to be consistently associated with Enterobacteriaecae, E. coli and K. pneumoniae co-colonization across all 12,238 datasets, as well as the subset of healthy adults. c, Top 10 gut microbiome species classified as co-excluders (negative effect size) or co-colonizers (positive effect size) coloured by their family affiliation.
Fig. 4
Fig. 4. Faecalimonas phoceensis exhibits strain-specific co-colonization patterns.
Core-genome phylogenetic tree of 200 Faecalimonas phoceensis (left) and 665 Ruminococcus B gnavus genomes (right). Clades are coloured on the basis of whether the genome is a metagenome-assembled genome (MAG) or an isolate. First outer layer denotes genome geographic origin and the second layer highlights in red those genomes with the highest number of significant accessory genes (top 10%). PERMANOVA was used to relate each species phylogenetic structure (pairwise cophenetic distances) with the number of significant accessory genes. Only genomes with >90% completeness were included in the analysis.
Fig. 5
Fig. 5. Functional differences between co-excluders and co-colonizers.
a, Distribution of Shannon diversity values obtained among co-excluders (n = 129) and co-colonizers (n = 116), which did not belong to the Enterobacteriaceae family, based on the pattern of KOs detected per genome. Exact P values were calculated with a two-sided Wilcoxon rank-sum test. b, COG functional categories significantly associated with co-colonizers (positive effect size) or co-excluders (negative effect size). c, Primary metabolic pathways detected with gutSMASH differentially abundant between co-excluders and co-colonizers. d, Pairwise metabolic distances between co-excluders or co-colonizers compared to all Enterobacteriaceae species detected at >1% prevalence (co-excluders: n = 4,773 comparisons; co-colonizers: n = 4,292 comparisons). P values were calculated with a two-sided Wilcoxon rank-sum test. In a and d, box lengths represent the IQR of the data, the central line represents the median, and the whiskers depict the lowest and highest values within 1.5× the IQR of the first and third quartiles, respectively.
Fig. 6
Fig. 6. Co-excluders harbour biosynthetic gene clusters involved in quorum sensing.
a, BGCs detected with antiSMASH that were found to be overrepresented among co-excluders or co-colonizers (two-sided Fisher’s exact test, adjusted P < 0.05). b, Network of all cyclic lactone autoinducer BGCs detected among co-colonizers and co-excluders. BGC nodes are linked if they share >50% nucleotide identity over >50% alignment coverage. c, Distribution of amino acid identity values obtained by comparing each autoinducer BGC family against the MIBiG database (n values indicated in parenthesis next to each BGC family represent the total number of alignments against the MIBiG database). Box lengths represent the IQR of the data, the central line represents the median, and the whiskers depict the lowest and highest values within 1.5× the IQR of the first and third quartiles, respectively.
Extended Data Fig. 1
Extended Data Fig. 1. Sample distribution and mapping quality control.
a, Distribution of age groups, health states and continents of the 12,238 gut metagenomic samples. b, Comparison of taxonomic profiles and abundances of three mock community samples in relation to their expected proportions, estimated using the read mapping filtering parameters used in this study. c, Detection limit of our metagenomic approach evaluated with 120 synthetic metagenomics consisting of the top 50 most prevalent gut species and one Enterobacteriaceae species at a defined abundance across three levels of sequencing depth. Horizontal dashed line represents the minimum relative abundance at which the five Enterobacteriaceae species tested were detected. Abundance values are log-scaled. d, Two-sided Pearson correlation between the number of samples with or without Enterobacteriaceae across the 65 studies. Error band represents the 95% confidence interval.
Extended Data Fig. 2
Extended Data Fig. 2. Strain diversity of Escherichia coli in the human gut microbiome among healthy adults.
a, Minimum spanning tree of the E. coli sequence types (STs) detected across 5,128 human gut metagenomes from healthy adults. The most prevalent STs are labelled next to their respective nodes (ST100024 and ST100083 represent unknown STs). b, Geographical distribution of samples containing known or unknown STs.
Extended Data Fig. 3
Extended Data Fig. 3. Machine learning models to classify Enterobacteriaceae colonization status.
a, Area Under the ROC Curve (AUROC) performance results of different machine learning methods, datasets and outcome variables (taxa) relating the gut microbiome composition with Enterobacteriaceae colonization status (n = 10 independent seeds per analysis). Box lengths represent the IQR of the data, the central line represents the median value, and the whiskers depict the lowest and highest values within 1.5 times the IQR of the first and third quartiles, respectively. b, ROC curve of the machine learning results linking the gut microbiome composition with Enterobacteriaceae status. AUROC values represent the median of gradient boosting models across 10 independent seeds, stratified by continent and only considering samples from healthy adults c, All-against-all performance results comparing models trained and tested using microbiome samples across different continents. All models were generated with the gradient boosting algorithm using samples from healthy adults only to classify Enterobacteriaceae colonization status.
Extended Data Fig. 4
Extended Data Fig. 4. Microbiome diversity metrics based on Enterobacteriaceae colonization status and abundance.
a, Distribution of pairwise beta diversity estimates (Aitchison distance) between samples with or without Enterobacteriaceae. b, Two-sided Pearson correlation between Enterobacteriaceae abundance (transformed to centred log-ratio) and gut microbiome alpha diversity (Shannon index). Sample depths were rarefied to 500,000 reads.
Extended Data Fig. 5
Extended Data Fig. 5. Candidate gut microbiome species associated with Enterobacteriaceae colonization and abundance.
a, Heatmap depicting all statistically significant microbiome species linked to Enterobacteriaceae, E. coli or K. pneumoniae colonization and/or abundance across the entire dataset or strictly among healthy adults. b, Number of species among the 1000 most prevalent detected that were classified as co-excluders, co-colonizers or not significant according to their order affiliation. c, Proportion of candidate species per taxon classified according to whether they were consistently associated to different taxa and/or across different datasets. d, Phylogenetic tree of representative genomes from all Faecalibacterium species detected in this study and their estimated association to Enterobacteriaceae, E. coli or K. pneumoniae. Species without a labeled effect size were not associated with any of the Enterobacteriaceae species tested.
Extended Data Fig. 6
Extended Data Fig. 6. Co-excluders and co-colonizers of carbapenemase-producing Enterobacteriaceae.
a, Number of species differentially abundant between individuals colonized by carbapenemase-producing Enterobacteriaceae (CPE) compared to household negative controls (left) and compared to CPE-negative index subjects that were decolonized within the previous year (right). Species are coloured based on whether they were also found to be significantly different, and in the same direction, using the whole Enterobacteriaceae family (green), missing (grey) or significant but in opposite directions (red). b, Bar height represents the effect size derived from MaAsLin2 of species that were associated with both Enterobacteriaceae and CPE status using household controls (left) or using CPE-negative index subjects (right). Positive effect size denotes co-colonizers, while co-excluders are shown with a negative effect size. Error bars represent the standard error.
Extended Data Fig. 7
Extended Data Fig. 7. Accessory genes significantly linked to Enterobacteriaceae status.
a, Number and annotation of all accessory genes per species identified as significantly associated with Enterobacteriaceae colonization. Analysis was performed with 39 gut microbiome species that were identified as either co-colonizers or co-excluders of Enterobacteriaceae among healthy adults, but only 15 species contained significantly associated accessory genes. b, COG functional category significantly overrepresented (two-sided Fisher’s exact test, adjusted P = 7.93 × 10⁻⁵) among the accessory genes associated with Enterobacteriaceae colonization.
Extended Data Fig. 8
Extended Data Fig. 8. Functional diversity and candidate orthologs among co-excluders and co-colonizers.
a, Distribution of the number of annotated genes with KEGG (left) and Shannon diversity estimates (right) among co-excluders (n = 122) and co-colonizers (n = 96). Only genomes with >90% completeness were included. Box lengths represent the IQR of the data, the central line represents the median value, and the whiskers depict the lowest and highest values within 1.5 times the IQR of the first and third quartiles, respectively. P values were derived from a two-sided Wilcoxon rank-sum test. P values were derived from a Wilcoxon rank-sum test. b, Heatmap depicting the distribution of the top 20 KEGG Orthologs (KOs) associated with co-excluders or co-colonizers. Columns represent bacterial species coloured by their taxonomic affiliation, genome type and classification (co-colonizer or co-excluder). KOs are grouped using a complete linkage hierarchical clustering on the basis of their presence/absence patterns. c, COG functional categories significantly associated with co-colonizers (positive effect size) or co-excluders (negative effect size), only considering genomes belonging to the Bacillota phylum.
Extended Data Fig. 9
Extended Data Fig. 9. Metabolic indices estimated between gut microbiome species and Enterobacteriaceae.
a, Metabolic competition and complementary indices estimated with PhyloMint between co-excluders or co-colonizers and all Enterobacteriaceae species detected at >1% prevalence. b, Distribution of metabolic distance scores between co-colonizers (n = 4292 comparisons) and co-excluders (n = 4773 comparisons) in relation to Enterobacteriaceae. c, Comparison of metabolic distances within and between co-excluders and co-colonizers. Co-excluders vs. co-excluders: n = 8256 comparisons; co-colonizers vs. co-colonizers: n = 6670 comparisons; co-colonizers vs. co-excluders: n = 14,964 comparisons. d, Reproducibility of metabolic distance scores of co-colonizers (n = 4292 comparisons) and co-excluders (n = 4773 comparisons) compared to Enterobacteriaceae after simulating models with defined gut media (M1) supplemented with diets from the Virtual Metabolic Human database, or with the M3 rich growth media. All comparisons were statistically significant (P < 0.0001). Box lengths represent the IQR of the data, the central line represents the median value, and the whiskers depict the lowest and highest values within 1.5 times the IQR of the first and third quartiles, respectively. P values were derived from a two-sided Wilcoxon rank-sum test.
Extended Data Fig. 10
Extended Data Fig. 10. Distribution of predicted metabolites among co-excluders and co-colonizers.
a, Distribution of the number of metabolites predicted from uptake (top) or secretion (bottom) fluxes among co-excluders (n = 129) and co-colonizers (n = 116). P values were derived from a two-sided Wilcoxon rank-sum test. Box lengths represent the IQR of the data, the central line represents the median value, and the whiskers depict the lowest and highest values within 1.5 times the IQR of the first and third quartiles, respectively. b, Metabolites significantly associated with either co-excluders or co-colonizers. Columns represent bacterial species coloured by their taxonomic affiliation, genome type and classification (co-colonizer or co-excluder). Metabolites are grouped using a complete linkage hierarchical clustering on the basis of their presence/absence patterns and coloured based on the type of metabolic flux (uptake or secretion).

References

    1. Pickard, J. M., Zeng, M. Y., Caruso, R. & Núñez, G. Gut microbiota: role in pathogen colonization, immune responses, and inflammatory disease. Immunol. Rev.279, 70–89 (2017). - PMC - PubMed
    1. Leshem, A., Liwinski, T. & Elinav, E. Immune–microbiota interplay and colonization resistance in infection. Mol. Cell78, 597–613 (2020). - PubMed
    1. Hou, K. et al. Microbiota in health and diseases. Signal Transduct. Target. Ther.7, 135 (2022). - PMC - PubMed
    1. Duvallet, C., Gibbons, S. M., Gurry, T., Irizarry, R. A. & Alm, E. J. Meta-analysis of gut microbiome studies identifies disease-specific and shared responses. Nat. Commun.8, 1784 (2017). - PMC - PubMed
    1. Armour, C. R., Nayfach, S., Pollard, K. S. & Sharpton, T. J. A metagenomic meta-analysis reveals functional signatures of health and disease in the human gut microbiome. mSystems4, e00332-18 (2019). - PMC - PubMed

MeSH terms

LinkOut - more resources