. 2025 Feb;4(2):145-162.
doi: 10.1038/s44161-024-00591-0. Epub 2025 Jan 10.

Endothelial IGFBP6 suppresses vascular inflammation and atherosclerosis

Affiliations

Endothelial IGFBP6 suppresses vascular inflammation and atherosclerosis

Meiming Su et al. Nat Cardiovasc Res. 2025 Feb.

Abstract

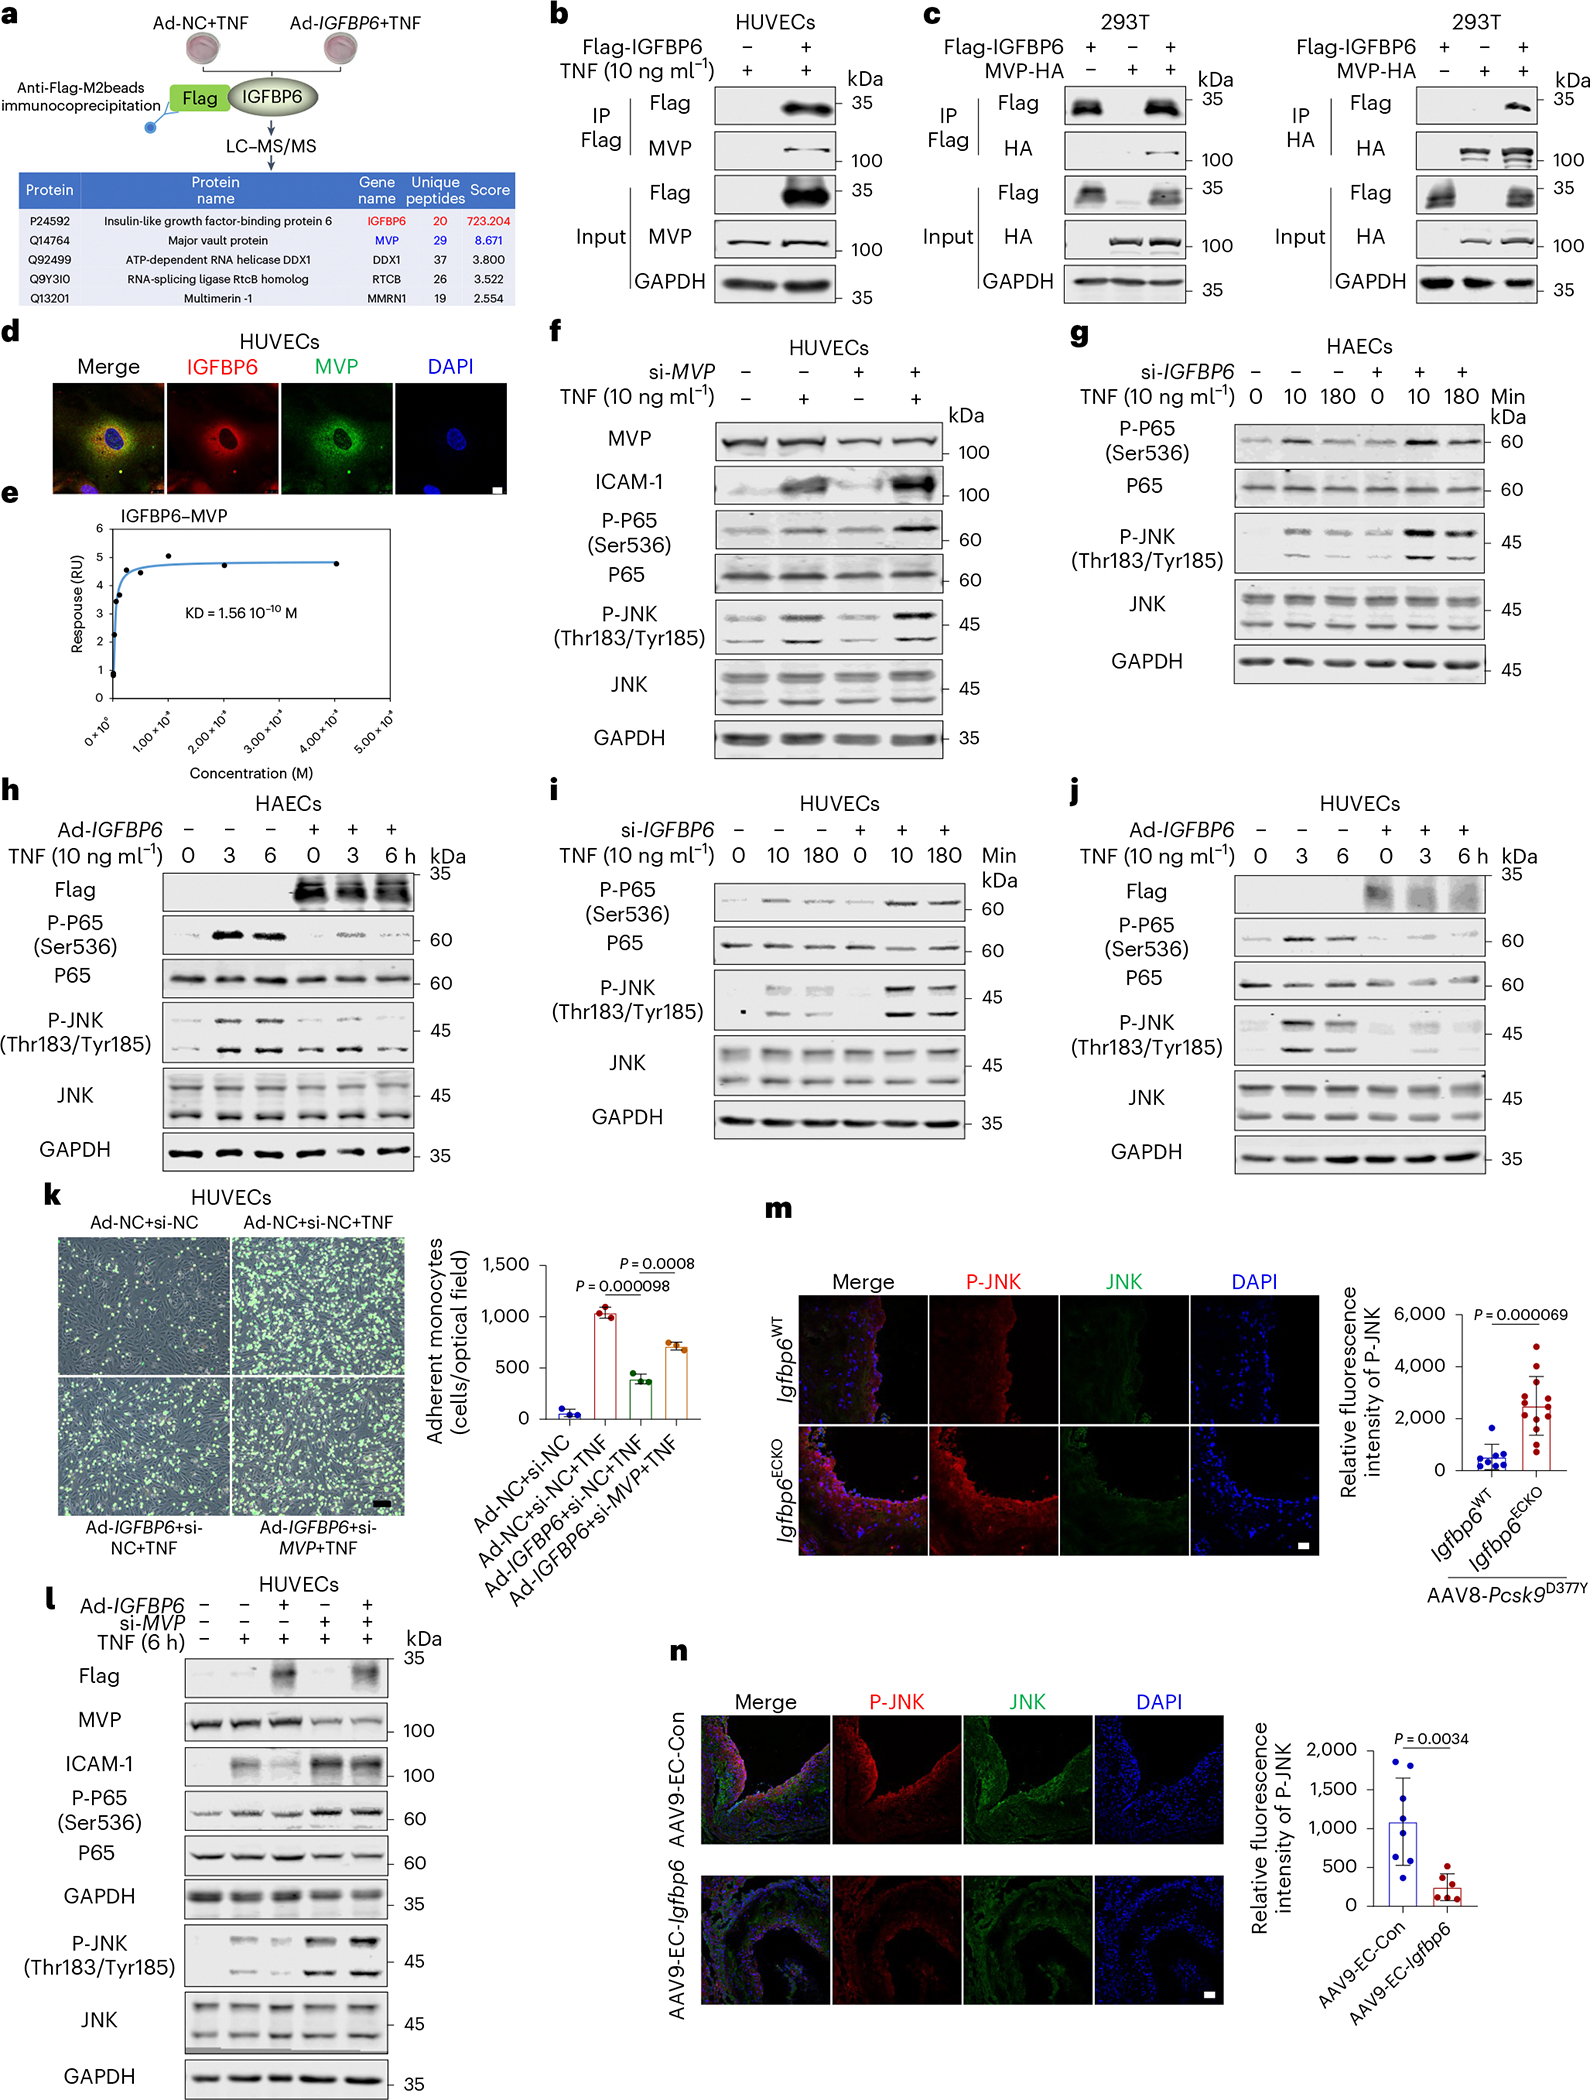
Beyond dyslipidemia, inflammation contributes to the development of atherosclerosis. However, intrinsic factors that counteract vascular inflammation and atherosclerosis remain scarce. Here we identify insulin-like growth factor binding protein 6 (IGFBP6) as a homeostasis-associated molecule that restrains endothelial inflammation and atherosclerosis. IGFBP6 levels are significantly reduced in human atherosclerotic arteries and patient serum. Reduction of IGFBP6 in human endothelial cells by siRNA increases inflammatory molecule expression and monocyte adhesion. Conversely, pro-inflammatory effects mediated by disturbed flow (DF) and tumor necrosis factor (TNF) are reversed by IGFBP6 overexpression. Mechanistic investigations further reveal that IGFBP6 executes anti-inflammatory effects directly through the major vault protein (MVP)-c-Jun N-terminal kinase (JNK)/nuclear factor kappa B (NF-κB) signaling axis. Finally, IGFBP6-deficient mice show aggravated diet- and DF-induced atherosclerosis, whereas endothelial-cell-specific IGFBP6-overexpressing mice protect against atherosclerosis. Based on these findings, we propose that reduction of endothelial IGFBP6 is a predisposing factor in vascular inflammation and atherosclerosis, which can be therapeutically targeted.


Conflict of interest statement

Competing interests: The authors declare no competing interests.

Figures

Extended Data Fig. 1 |
Extended Data Fig. 1 |. The gene expression values of IGFs and IGFBPs.
a, The mRNA expression counts of IGFs and IGFBPs in UF- and DF-treated HUVECs. (GEO accession No. GSE20739, n = 3). b, A heatmap showing the differentially expressed genes (DEGs) between the two groups. Upregulated genes are labelled in red and downregulated genes are shown in blue. c, The mRNA expression of IGFBP1-7 in HUVECs under static conditions (n = 3). Statistical analysis was performed by two-tailed Welch’s t test for a, by one-way ANOVA followed by the Tukey’s test for c.
Extended Data Fig. 2 |
Extended Data Fig. 2 |. Construction and genotype identification of IGFBP6 global knockout mice.
a, Identification of genotypes of Igfbp6/ mice. b, The LDLR protein level in liver tissues of mice after PCSK9 injection as detected by Western blot. Liver tissues from male C57BL/6 J and Ldlr/ mice were used as controls. c, Analysis of ALT, AST, TG, TC, HDL-C, and LDL-C levels in male WT and Igfbp6/ mice (n = 13–15). Statistical analysis was performed by two-tailed Student’s t test, Mann–Whitney U test and Welch’s t test for c.
Extended Data Fig. 3 |
Extended Data Fig. 3 |. Construction of EC-specific IGFBP6 knockout mice, genotype identification and serum biochemistry.
a, Schematic view of the generation of Igfbp6ECKO mice. b, Identification of genotypes of Igfbp6ECKO mice. c, The mRNA expression of Igfbps in the aortic intima of male Igfbp6ECKO mice and control mice (n = 5). d, Analysis of body weight, blood glucose, ALT, AST, TG, TC, HDL-C, and LDL-C levels (n = 7–11). Statistical analysis was performed by two-tailed Student’s t test and Mann–Whitney U test for c, d, and by Welch’s t test for d (Male: LDL-C).
Extended Data Fig. 4 |
Extended Data Fig. 4 |. Validation and serum biochemistry of EC-specific IGFBP6 overexpression mice.
a, En face immunofluorescence staining IGFBP6 (red), VE-Cadherin (green), and DAPI (blue) in mouse aorta, showing increased IGFBP6 expression in the aortic endothelium of male AAV9-EC-Igfbp6 mice (n = 3). Scale bar: 50 μm. b, The mRNA expression of Igfbps in the aortic intima of male AAV9-EC-Igfbp6 mice and control mice (n = 5). c, Analysis of body weight, blood glucose, ALT, AST, TG, TC, HDL-C, and LDL-C levels in mouse serum (n = 10). Statistical analysis was performed by two-tailed Mann–Whitney U test and by Student’s t test for b, c, and by Welch’s t test for c (ALT).
Extended Data Fig. 5 |
Extended Data Fig. 5 |. IGFBP6 suppresses inflammation in HAECs and RNA-sequencing of IGFBP6 overexpressed ECs indicates the anti-inflammatory effect of IGFBP6.
a and b, HAECs were transfected with control si-NC or si-IGFBP6 for 48 h and then treated with TNF-α for 6 h. The expression of IGFBP6, VCAM-1, ICAM-1 was determined by qRT-PCR (a, n = 3) and Western blot (b, n = 4). c and d, HAECs were transfected with Ad-NC or Ad-IGFBP6 for 24 h and then treated with TNF-α for 6 h. The expression of Flag-IGFBP6, VCAM-1, ICAM-1, SELE and CCL2 was determined by qRT-PCR (c) and Western blot (d) (n = 3). e and f, HAECs were treated as indicated and THP-1 monocyte adhesion assay was performed and the number of adherent monocytes were quantified (n = 3). Scale bar: 50 μm. g, HUVECs were transfected with Ad-NC or Ad-IGFBP6 for 24 h and then treated with TNF-α for 6 h. The treated cells were analyzed by transcriptome sequencing (n = 3). h, Bubble diagram of the KEGG pathway enrichment analysis of DEGs. i, Heatmap diagram showing the DEGs between the two groups. Upregulated genes are labelled in red and downregulated genes are shown in blue. Scale bar: 50 μm. Statistical analysis was performed by two-tailed paired t test for a (left panel), b, d, by two-way ANOVA (repeated measures) followed by the Bonferroni’s test for a (right panel), c, by Student’s t test for e, f.
Extended Data Fig. 6 |
Extended Data Fig. 6 |. KLF4 up-regulates the expression of IGFBP6 and MVP depletion promotes inflammation in HUVECs.
a and b, HUVECs were treated with Ad-NC or Ad-KLF4 for 24 h, and the expression of KLF4, NOS3 and IGFBP6 was determined by qRT-PCR (a, n = 5), and ELISA (b, n = 3). c, HUVECs were transfected with si-NC or si-MVP for 48 h and then treated with TNF-α for 6 h. The expression of MVP, ICAM-1and SELE was determined by qRT-PCR (n = 3). d, HUVECs were treated as indicated and THP-1 monocyte adhesion assay was performed and the number of adherent monocytes were quantified (n = 3). Scale bar: 50 μm. Statistical analysis was performed by two-tailed paired t test for a, by Student’s t test for b, by two-way ANOVA (repeated measures) followed by the Bonferroni’s test for c, and by two-way ANOVA followed by the Tukey’s test for d.
Extended Data Fig. 7 |
Extended Data Fig. 7 |. The anti-inflammatory effect of IGFBP6 depends on the binding site of IGFBP6 to MVP.
a, In HUVECs, Co-IP experiments were performed on MVP and ASK1 (n = 3). b, HUVECs were treated with adenovirus to overexpress IGFBP6. After 42 h of treatment, TNF-α was added for 6 h. After that, flag-tagged IGFBP6 was pulled down and ASK1 (n = 3) was detected. c, Representative Co-IP and Western blot assays revealed dimerization of ASK1 in HEK293T cells transfected with indicated plasmid vectors (n = 3). d, Molecular docking was performed using Alphafold3 to predict the binding sites of IGFBP6 and MVP. e, Representative Co-IP and Western blot assays showing the binding domains of IGFBP6 to MVP in HEK293T cells (n = 3). f, HUVECs were treated with IGFBP6 and mutated IGFBP6 adenovirus for 42 h, followed by TNF-α for 6 h. The expression levels of Flag, VCAM-1, ICAM-1 were detected by Western blot (n = 3).
Extended Data Fig. 8 |
Extended Data Fig. 8 |. Secreted IGFBP6 and MVP do not affect inflammation in HUVECs.
a and b, HUVECs were treated with adenoviruses (Ad-MVP and Ad-IGFBP6) for 7 days, during which the supernatant was continuously collected. Ultrafiltration tubes were used to concentrate the protein in the supernatant, and flag (a, n = 3) or HA (b, n = 3) antibodies were used for Co-IP, respectively, and finally verified by Western blot. c, HUVECs were treated with different concentrations of IGFBP6 recombinant protein for 42 h, and then treated with TNF-α for 6 h, and indicated proteins were detected by Western blot (n = 3). d, HUVECs were treated with different concentrations of IGFBP6 recombinant protein for 3 h, and then treated with TNF-α for 10 mins, and indicated proteins were detected by Western blot (n = 3). e, 80% of confluent HUVECs were treated with Ad-NC or Ad-IGFBP6 in the presence of TNF. After that, whole cell lysate was collected for Western blot (left 4 lanes, control). In parallel experiments, the treated cells were washed with PBS and new complete medium was supplemented. Then, conditioned media were collected to treat HUVECs before lysate was collected for Western blot (right 4 lanes) (n = 3). f, HUVECs were treated with different concentrations of MVP recombinant protein for 3 h, and then treated with TNF-α for 10 mins, and indicated proteins were detected by Western blot (n = 3).
Extended Data Fig. 9 |
Extended Data Fig. 9 |. Graphical Abstract.
IGFBP6 serves as a novel endothelial homeostasis-associated molecule which is mechanoresponsive and confers anti-inflammation and atheroprotection via binding with intracellular MVP and suppresses JNK and p65 phosphorylation.
Extended Data Fig. 10 |
Extended Data Fig. 10 |. Immunostaining of murine aortic roots and human coronary arteries with isotype control IgG.
a and b, Representative images of immunofluorescence staining with rat IgG, rabbit IgG or mouse IgG for mouse and human plaque tissues (n = 3). Scale bar = 50 μm.
Fig. 1 |
Fig. 1 |. IGFBP6 is decreased in human atherosclerotic plaques and regulated by blood flow.
a, Identification of IGFBP6 as a novel endothelial homeostasis-associated molecule. Statin-upregulated genes (GSE176531) and UF-upregulated genes (GSE20739 and GSE87534) were overlapped with downregulated genes in unstable atherosclerotic plaques (GSE163154 and GSE41571). b, The expression of IGFBP6 in macroscopically intact tissues versus atheroma plaques, stable plaques versus unstable plaques in public datasets from patients (GSE43292 (n = 32) or GSE163154 (stable plaques: n = 16; unstable plaques: n = 27)). c, Expression of IGFBP6 in tissues and organs of patients with CAD (n = 600) and healthy individuals (n = 250) in the STARNET database. AOR, atherosclerotic aortic wall; LIV, liver; SF, subcutaneous fat; SKLM, skeletal muscle; VAF, visceral fat. d, Representative images of immunofluorescence staining of IGFBP6 (red), VE-cadherin (green) and DAPI (blue). The expression of IGFBP6 was downregulated in the endothelium of human aortic atherosclerotic lesions compared to normal controls (n = 3). Scale bar, 25 μm. e, Serum samples were collected from normal controls and patients with CAD to verify the IGFBP6 content by ELISA (control: n = 12; CAD: n = 19). f, IGFBP6 mRNA expression was downregulated comparing DF to UF in the public microarray in HUVECs (n = 3, GSE20739). g, HUVECs were subjected to DF or UF for 24 h. KLF2, KLF4 and IGFBP6 mRNA expression were downregulated in DF-treated HUVECs (n = 3). h, Schematic representation of a mouse model with PCL. i, Igfbp6 was decreased in the intimal RNA of mouse carotid arteries 4 d after PCL surgery (n = 5). j, Immunofluorescence staining for IGFBP6 (red) and DAPI (blue) showed that IGFBP6 was reduced in the carotid arteries of mice at 4 weeks after PCL surgery (n = 5). Green: auto-fluorescence of the elastic lamina (EL). Scale bar, 25 μm. k, Immunoblotting showing that the IGFBP6 was lower in the inner curvature of the AA than in the TA in C57BL/6J mouse aortas (n = 6). l, En face immunofluorescence staining for IGFBP6 (red), VE-cadherin (green) and DAPI (blue) in C57BL/6J mouse aortas, showing decreased IGFBP6 expression in the AA compared to the TA (n = 10). Scale bar, 50 μm. Data are shown as mean ± s.d. Statistical analysis was performed by two-tailed Student’s t-test for b, e, k and l, by Welch’s t-test for c and f and by paired t-test for g and i.
Fig. 2 |
Fig. 2 |. IGFBP6 deficiency increases atherosclerosis in mice receiving PCL surgery.
a, Igfbp6 transcript level was successfully deleted in various tissues and organs in Igfbp6−/− mice (n = 3). b, Schematic diagram illustrating the experimental scheme. c, Mouse serum was used to verify IGFBP6 deletion by ELISA in Igfbp6−/− mice (n = 4). d, Immunofluorescence staining for IGFBP6 (red) and DAPI (blue) showed that IGFBP6 was reduced in the RCAs of Igfbp6−/− mice (n = 3). EL denotes elastic lamella that display auto-fluorescence (green). Scale bar, 25 μm. e, Increased plaque formation in male Igfbp6−/− mice receiving PCL (WT: n = 15; Igfbp6−/−: n = 13). Scale bar, 2 mm. f, Representative Oil Red O–stained carotid arteries of male WT and Igfbp6−/− mice. The panel on the right shows the quantification of the Oil Red O–positive plaque area (WT: n = 15; Igfbp6−/−: n = 10). Scale bars, 50 μm. g, Immunofluorescence staining for VCAM-1 (green) and DAPI (blue) showed that VCAM-1 was increased in carotid cryosections from Igfbp6−/− mice (n = 6). Scale bars, 100 μm and 25 μm. Data are shown as mean ± s.d. Statistical analysis was performed by two-tailed Welch’s t-test for a, by Mann–Whitney U-test for c and by Student’s t-test for e and f. W, weeks.
Fig. 3 |
Fig. 3 |. EC-specific knockout of IGFBP6 aggravates atherosclerosis in mice.
a, Schematic figure showing the experimental strategy. b, En face immunofluorescence staining for IGFBP6 (red), VE-cadherin (green) and DAPI (blue) in the aortas of mice. Decreased IGFBP6 expression in the intima of Igfbp6ECKO mice was observed (n = 5). Scale bar, 50 μm. c, The expression of Igfbp6 mRNA in the intima and non-intima lysate of the aorta was detected by qRT–PCR (n = 5). d, IGFBP6 level in the serum of Igfbp6ECKO mice was detected by ELISA (n = 4). e,f, Representative en face images of Oil Red O staining of atherosclerotic lesions of the aorta in male (e) (Igfbp6WT: n = 8; Igfbp6ECKO: n = 7) and female Igfbp6ECKO mice and respective controls (f) (Igfbp6WT: n = 8; Igfbp6ECKO: n = 10). Scale bar, 2 mm. g,h, Representative images of atherosclerotic lesions in the aortic root stained with Oil Red O in male (g) (Igfbp6WT: n = 8; Igfbp6ECKO: n = 7) and female Igfbp6ECKO mice and respective controls (h) (Igfbp6WT: n = 8; Igfbp6ECKO: n = 11). Scale bar, 200 μm. i, Representative Oil Red O–stained cryosections of brachiocephalic arteries from male Igfbp6ECKO mice and control mice. The quantification of the Oil Red O–positive plaque area is shown in the right panel (Igfbp6WT: n = 7; Igfbp6ECKO: n = 9). Scale bar, 50 μm. j, Massonʼs trichrome staining showed collagen expression in plaques, and decreased collagen expression in the aortic roots of male Igfbp6ECKO mice was observed as compared to control mice (Igfbp6WT: n = 8; Igfbp6ECKO: n = 11). Scale bar, 200 μm. k, H&E staining of aortic root lesions was performed in male Igfbp6ECKO mice and control mice, and the area of the necrotic plaque core was quantified (Igfbp6WT: n = 8; Igfbp6ECKO: n = 11). Scale bar, 200 μm. l,m, Immunofluorescence staining of α-SMA (red) and CD68 (green) in the diseased area of the aortic root in male (l, Igfbp6WT: n = 8; Igfbp6ECKO: n = 7) and female Igfbp6ECKO mice as compared to control mice (m, Igfbp6WT: n = 6; Igfbp6ECKO: n = 8). Scale bar, 50 μm. Data are shown as mean ± s.d. Statistical analysis was performed by two-tailed Student’s t-test for c (left panel), ek, l (right panel) and m (left panel), by Mann–Whitney U-test for c (right panel) and by Welch’s t-test for d and l (left panel) and m (right panel). W, weeks.
Fig. 4 |
Fig. 4 |. EC-specific overexpression of IGFBP6 ameliorates atherosclerosis in ApoE−/− mice.
a, Representative images of atherosclerosis plaque development in the gross whole aorta and aortic sinus (stained with Oil Red O) of male C57BL/6J mice fed with a normal chow diet for 6 weeks and male ApoE−/− mice fed with an HCD for 6 weeks or 18 weeks (n = 5). Scale bars, 1 mm and 200 μm. b, Immunofluorescence staining of IGFBP6 (red), CD31 (green) and DAPI (blue) in the diseased area of the aortic root in male C57BL/6J and ApoE−/− mice (n = 5). Scale bar, 25 μm. c, Serum samples were collected from male C57BL/6J and ApoE−/− mice to verify IGFBP6 levels by ELISA (n = 5). d, Schematic figure showing the experimental strategy. e, Immunofluorescence staining of IGFBP6 (red) in the diseased area of the aortic root in male AAV9-EC-Igfbp6 mice (n = 5). Scale bar, 50 μm. f, The expression of Igfbp6 mRNA in the intima and non-intima lysate of the aorta was detected by qRT–PCR (n = 5). gi, Representative images of Oil Red O–stained aortas (g, n = 14), sections of aortic sinus (h, n = 9) and sections of brachiocephalic arteries (i, n = 10). Scatter plots show the statistical evaluation of the Oil Red O–positive areas. Scale bars, 2 mm (g and i) and 200 μm (h). j, Massonʼs trichrome staining showed increased collagen expression in the aortic roots of male AAV9-EC-Igfbp6 mice (n = 9). Scale bar, 200 μm. k, H&E staining of aortic root lesions was performed in male AAV9-EC-Igfbp6 mice, and the area of the necrotic core of the plaque was quantified (AAV9-EC-Con: n = 9; AAV9-EC-Igfbp6: n = 11). Scale bar, 200 μm. l,m, Immunofluorescence staining of α-SMA (red) and CD68 (green) in the diseased area of the aortic root and brachiocephalic arteries in male AAV9-EC-Igfbp6 mice (l, AAV9-EC-Con: n = 9 or n = 13; AAV9-EC-Igfbp6: n = 12; m, AAV9-EC-Con: n = 7 or n = 10; AAV9-EC-Igfbp6: n = 11 or n = 9). Scale bar, 50 μm. Data are shown as mean ± s.d. Statistical analysis was performed by two-tailed one-way ANOVA followed by Bonferroni’s test for c, by Student’s t-test for fj and l (right panel), by Welch’s t-test for k and by Mann–Whitney U-test for l (left panel) and m. W, weeks.
Fig. 5 |
Fig. 5 |. IGFBP6 regulates EC inflammation.
a, HUVECs were treated with various inflammatory stimuli (IL-1α, IL-1β, TNF, IFN-γ and LPS) for 24 h, and the mRNA expression of VCAM-1 and IGFBP6 was detected (n = 3–4). b, HUVECs were transfected with si-NC or si-IGFBP6 for 48 h and then treated with TNF for 6 h. The expression of IGFBP6 was determined by ELISA (b, n = 3). c,d, The expression of VCAM-1, ICAM-1 and SELE was determined by qRT–PCR (c, n = 5) and western blot (d, VCAM-1 and ICAM-1: n = 9; SELE: n = 3). e,f, HUVECs were transfected with Ad-NC or Ad-IGFBP6 for 24 h and then treated with TNF for 6 h. The expression of IGFBP6/Flag, VCAM-1, ICAM-1 and SELE was determined by qRT–PCR (e, n = 3) and western blot (f, VCAM-1 and ICAM-1: n = 5; SELE: n = 3). g, Number of adherent THP-1 cells to HUVECs treated with si-NC or si-IGFBP6 in the presence of TNF (n = 6). Scale bar, 50 μm. h, Number of adherent THP-1 cells to HUVECs treated with Ad-NC or Ad-IGFBP6 in the presence of TNF (n = 6). Scale bar, 50 μm. i,j, HUVECs were transfected with Ad-NC or Ad-IGFBP6 for 24 h and then treated with UF or DF for 24 h, respectively. The expression of VCAM-1 and ICAM-1 was detected by qRT–PCR (i, n = 3) and western blot (j, n = 4). k, Number of adherent THP-1 cells to HUVECs treated with Ad-NC or Ad-IGFBP6 in the presence of DF or static (n = 4). Scale bar, 50 μm. l, After intraperitoneal injection of murine TNF (500 ng per mouse) for 4 h, the leukocytes of mice were stained with Rhodamine 6G, and the number and migration rate of leukocytes in mesenteric vessels were observed and counted (n = 3). Scale bar, 100 μm. Data are shown as mean ± s.d. Statistical analysis was performed by two-tailed Student’s t-test for l (left and middle panel), by paired t-test for a, b, d and f, by two-way ANOVA (repeated measures) followed by Bonferroni’s test for c, e, g, i and j, by two-way ANOVA followed by Tukey’s test for h and k and by Welch’s t-test for l (right panel). Veh, vehicle.
Fig. 6 |
Fig. 6 |. IGFBP6 is a transcriptional target of KLF2.
ad, HUVECs were treated with escalating concentrations of indicated chemicals (atorvastatin (a), simvastatin (b), rosuvastatin (c) and resveratrol (d)) for 24 h. Then, the mRNA expression of KLF2 and IGFBP6 was detected (n = 5). e, HUVECs were treated with si-NC or si-KLF2 for 48 h, and the mRNA expression of KLF2 and IGFBP6 was detected (n = 3). f, HUVECs were treated with siRNA or si-KLF2 for 24 h and then treated with DMSO or atorvastatin for 24 h, and the mRNA expression of KLF2 and IGFBP6 was detected (n = 5). g,h, HUVECs were treated with Ad-NC or Ad-KLF2 for 24 h, and the expression of KLF2 and IGFBP6 was determined by qRT–PCR (g, n = 4) and ELISA (h, n = 3). i, Dual-luciferase reporter assay showed (293T) that KLF2 regulated IGFBP6 promoter activity in HEK293T cells transfected with different mutants of IGFBP6 promoters (n = 5). j, In Ad-KLF2-transduced HUVECs, chromatin immunoprecipitation–PCR showed that KLF2 bound to the IGFBP6 promoter (n = 3). Data are shown as mean ± s.d. Statistical analysis was performed by two-tailed one-way ANOVA (repeated measures) followed by Bonferroni’s test for a and b (left panel) and d and f, by Kruskal–Wallis test for b (right panel), by Mann–Whitney U-test for g (right panel), by Welch’s t-test for i (Ad-NC WT versus Ad-KLF2 WT), by one-way ANOVA followed by Tukey’s test for i (Ad-KLF2 WT versus Ad-KLF2 MT1 versus Ad-KLF2 MT2), by paired t-test for c, e and g (left panel) and j and by Student’s t-test for h.
Fig. 7 |
Fig. 7 |. IGFBP6 interacts with MVP and suppresses endothelial inflammation via MVP-dependent inhibition of p65 and JNK phosphorylation.
a, HUVECs were treated with Ad-NC or Ad-IGFBP6 for 24 h before treatment with TNF for 6 h. Lysates were immunoprecipitated with anti-Flag-M2 beads. List of IGFBP6-binding proteins identified by LC–MS/MS. b,c, Immunoprecipitation (IP) was performed with the indicated antibodies in HUVECs (b) and HEK293T cells (c). d, Immunofluorescence staining for IGFBP6 (red), MVP (green) and DAPI (blue) in HUVECs (n = 4). Scale bar, 10 μm. e, SPR analysis of the direct interaction of MVP and IGFBP6. f, HUVECs were transfected with si-NC or si-MVP for 48 h and treated with TNF for 6 h. Whole cell lysate of treated cells was immunoblotted to detect MVP, ICAM-1, P-p65, p65, P-JNK and JNK (n = 3). g,i, ECs were transfected with si-NC or si-IGFBP6 for 48 h and then treated with TNF for different times. The protein expression of P-p65, p65, P-JNK and JNK was determined in HAECs (g) and HUVECs (i) (n = 3). h,j, ECs were transfected with Ad-NC or Ad-IGFBP6 for 24 h and then treated with TNF for different times. The protein expression of P-p65, p65, P-JNK and JNK was determined in HAECs (h) and HUVECs (j) (n = 3). k, HUVECs were transfected with adenovirus (Ad-NC or Ad-IGFBP6) and siRNA (si-NC or si-MVP) for 48 h and then treated with TNF for 6 h. THP-1 monocyte adhesion assay was performed (n = 3). Scale bar, 50 μm. l, The protein expression of Flag-tagged IGFBP6, MVP, ICAM-1, P-p65, p65, P-JNK and JNK was determined in HUVECs (n = 3). m,n, Immunofluorescence staining of P-JNK (red) and JNK (green) in the diseased area of the aortic root in male Igfbp6ECKO mice (m, Igfbp6WT: n = 8; Igfbp6ECKO: n = 13) and male AAV9-EC-Igfbp6 mice (n, AAV9-EC-Con: n = 8; AAV9-EC-Igfbp6: n = 6). Scale bar, 50 μm. Data are shown as mean ± s.d. Statistical analysis was performed by two-tailed Student’s t-test for k, by Mann–Whitney U-test for m and by Welch’s t-test for n.

References

    1. Libby P et al. Atherosclerosis. Nat. Rev. Dis. Primers 5, 56 (2019). - PubMed
    1. Hahn C & Schwartz MA Mechanotransduction in vascular physiology and atherogenesis. Nat. Rev. Mol. Cell Biol. 10, 53–62 (2009). - PMC - PubMed
    1. Souilhol C et al. Endothelial responses to shear stress in atherosclerosis: a novel role for developmental genes. Nat. Rev. Cardiol. 17, 52–63 (2020). - PubMed
    1. Davies PF Endothelial mechanisms of flow-mediated athero-protection and susceptibility. Circ. Res. 101, 10–12 (2007). - PubMed
    1. Kwak BR et al. Biomechanical factors in atherosclerosis: mechanisms and clinical implications. Eur. Heart J. 35, 3013–3020 (2014). - PMC - PubMed

MeSH terms

Substances