. 2025 Feb;57(2):358-368.
doi: 10.1038/s41588-024-02050-9. Epub 2025 Jan 10.

Cell state-dependent allelic effects and contextual Mendelian randomization analysis for human brain phenotypes

Affiliations

Cell state-dependent allelic effects and contextual Mendelian randomization analysis for human brain phenotypes

Alexander Haglund et al. Nat Genet. 2025 Feb.

Abstract

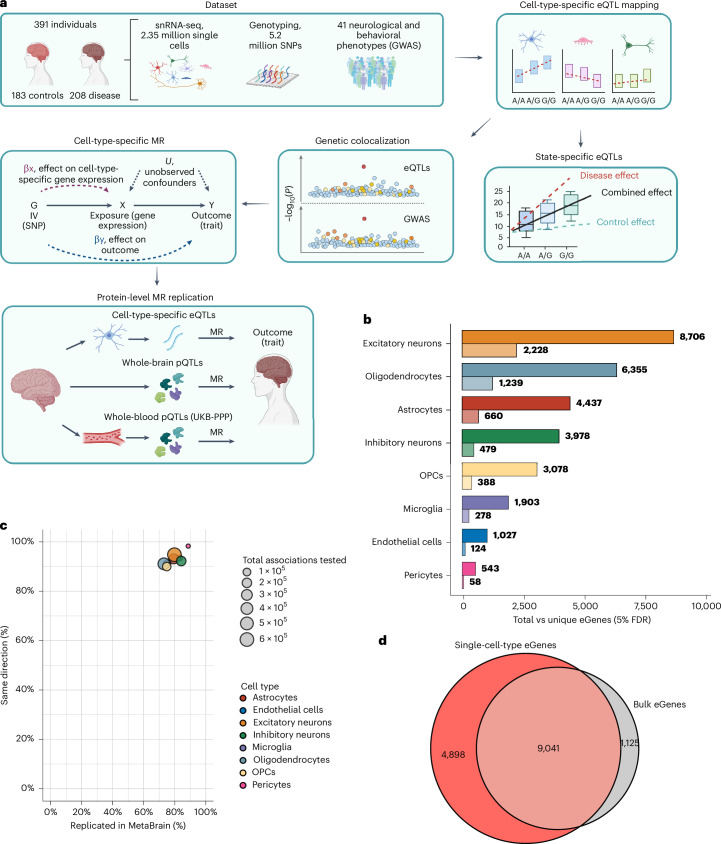
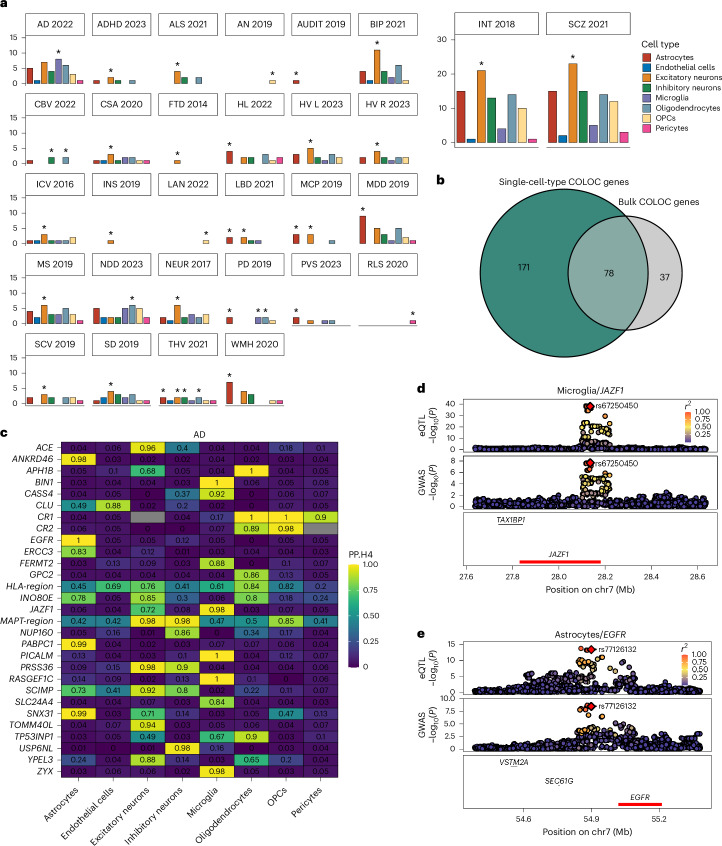
Gene expression quantitative trait loci are widely used to infer relationships between genes and central nervous system (CNS) phenotypes; however, the effect of brain disease on these inferences is unclear. Using 2,348,438 single-nuclei profiles from 391 disease-case and control brains, we report 13,939 genes whose expression correlated with genetic variation, of which 16.7-40.8% (depending on cell type) showed disease-dependent allelic effects. Across 501 colocalizations for 30 CNS traits, 23.6% had a disease dependency, even after adjusting for disease status. To estimate the unconfounded effect of genes on outcomes, we repeated the analysis using nondiseased brains (n = 183) and reported an additional 91 colocalizations not present in the larger mixed disease and control dataset, demonstrating enhanced interpretation of disease-associated variants. Principled implementation of single-cell Mendelian randomization in control-only brains identified 140 putatively causal gene-trait associations, of which 11 were replicated in the UK Biobank, prioritizing candidate peripheral biomarkers predictive of CNS outcomes.


Conflict of interest statement

Competing interests: The authors declare no competing interests.

Figures

Fig. 1
Fig. 1. Study design and eQTL analysis.
a, Overview of study workflow, created using BioRender.com. b, Total eGenes per cell type (top, darker bar) versus eGenes unique to that cell type (bottom, lighter bar). c, Replication of single-cell-type cis-eQTLs (number of eQTLs per cell type indicated by bubble size) using cis-eQTLs from human cortex bulk RNA-seq dataset (MetaBrain) for both replication (x axis) and directionality (y axis). d, Overlap of single-cell-type eGenes with eGenes from the same single-cell dataset but with counts aggregated across cells to simulate an equivalently sized ‘bulk-tissue’ gene expression dataset (pseudobulk).
Fig. 2
Fig. 2. Modeling of disease–interaction cis-eQTLs.
a, Overview of the statistical framework. For each single-cell-type cis-eQTL tested, we first assessed a null model (M0), testing the association of the gene with clinical and technical covariates. We then tested whether the base model (M1), which includes the use of genotype to model the observed SNP–transcript association, was better suited compared to the null model. We repeated this comparison between the base model and the disease–interaction model (M2), testing whether the use of an interaction term on diagnosis was more appropriate. b, Percentage of cis-eQTLs with a significant disease interaction (that is, q value < 0.05 in favor of the interaction model M2) for each cell type. c, QQ plots of observed versus expected LRT P values calculated on M1 versus M2, for each cell type, showing significant deviation from the expected distribution. dg, Examples of single-cell-type cis-eQTLs from the full cohort (n = 391) where the SNP–gene association has a significant disease interaction for microglia (d), astrocytes (e), oligodendrocytes (f) and excitatory neurons (g). The P values for ‘all’ represent the t statistic for the M1 models, whereas the P values for AD, PD and MS represent the P value from the interaction with genotype within the M2 model. The ‘control’ P value represents the effect of genotype on expression after accounting for interaction effects. Elements of the boxes show the center line (median), box limits represent upper and lower quartiles and whiskers represent upper and lower quartils ±1.5× IQR. All data points have been included. QQ, quantile-quantile plots; IQR, interquartile range.
Fig. 3
Fig. 3. Colocalization analysis for brain phenotypes using cell-type eQTLs.
a, Summary of colocalizations (PP.H4 > 0.8) per cell type and trait. Each bar chart is colored by cell type. Y axes indicate the number of colocalizations in that cell type. Asterisks indicate the cell type with most colocalizations with a particular trait. b, Number of unique colocalized (PP.H4) genes from single-cell-type and ‘pseudobulk’ eQTL data. c, Single cell-type colocalizations (PP.H4 > 0.8) for AD (genes on x axis and cell types on y axis). d, Colocalization Manhattan plots for the association of JAZF1 expression in microglia and AD risk. Each point represents the −log10(P) for an SNP and its association with gene expression (top) and disease risk (bottom). e, Colocalization Manhattan plots for the association of EGFR expression in astrocytes and AD risk. ADHD, attention deficit hyperactivity disorder; ALS, amyotrophic lateral sclerosis; AN, anorexia nervosa; AUDIT, alcohol use disorder; INT, intelligence; SCZ, schizophrenia; BIP, bipolar disorder; HL, hearing loss; CBV, cerebellar volume; CSA, cortical surface area; FTD, frontotemporal dementia (behavioral variant); HV L/R, hippocampal volume (left/right); ICV, intracranial volume; INS, insomnia; LAN, reading and language skills; LBD, Lewy body dementia; MCP, multisite chronic pain; MDD, major depressive disorder; NDD, neurodegenerative disease; NEUR, neuroticism; PVS, perivascular space burden; RLS, restless legs syndrome; SCV, subcortical volume; SD, sleep duration; STR, stroke; THV, whole thalamus volume; chr, chromosome.
Fig. 4
Fig. 4. Impact of disease on colocalizations.
a, Overview of colocalizations (PP.H4 > 0.8) aggregated across cell types for 30 CNS traits, indicating the total number of colocalizations for a given trait and the proportion with a disease interaction. b, Colocalization between TP53INP1 expression in oligodendrocytes and AD in the full cohort (left, PP.H4 = 0.91) and the control-only cohort (right, PP.H4 = 0.04). Each point represents the −log10(P) for an SNP and its association with the gene (top) and disease (bottom). c, Cis-eQTL plot showing the effect of disease samples in the full cohort (n = 391) on the association between the lead colocalized SNP rs4582532 and TP53INP1 expression in oligodendrocytes. The P values for ‘all’ represent the t statistic for the M1 models, whereas the P values for AD, PD and MS represent the P value from the interaction with genotype within the M2 model. The ‘control’ P value represents the effect of genotype on expression after accounting for interaction effects. d, Colocalization between RAB38 expression in excitatory neurons and behavioral frontotemporal dementia in the full cohort (left, PP.H4 = 0.81) and the control-only cohort (right, PP.H4 = 0.06). e, Cis-eQTL plot showing the effect of disease samples in the full cohort (n = 391) on the association between the colocalized lead SNP rs16913634 and RAB38 expression in excitatory neurons. Elements of the boxes show the center line (median), box limits represent upper and lower quartiles and whiskers represent upper and lower quartiles ±1.5× IQR. All data points have been included. f, Colocalization between PEX13 expression in excitatory neurons and MS in the full cohort (left, PP.H4 = 0.08) and the control-only cohort (right, PP.H4 = 0.87). g, Cis-eQTL plot showing the effect of disease samples in the full cohort (n = 391) on the association between the colocalized lead SNP rs11772842 and PEX13 expression in excitatory neurons. h, Comparison of colocalizations discovered in the full mixed disease-case and control dataset (n = 391) versus control samples only (n = 183).
Fig. 5
Fig. 5. MR results for brain phenotypes at gene and protein expression levels.
a, Overview of significant MR results (IVW fixed effects P < 0.05 or Wald ratio for single instruments). Trait abbreviations are as per Fig. 3b. b, IVW effect size and directionality for genes with MR evidence for an association between the change in gene expression in the indicated cell type and risk of AD. Each point represents the IVW effect size for a given cell type, with error bars (effect size ± 1.96× s.e.) indicating the 95% confidence interval. A positive effect size means an increase in expression is associated with an increase in disease risk (and vice versa), whereas a negative effect size indicates an inverse association between gene expression and disease risk. c, Overview of single-cell gene–trait pairs replicated by colocalization analysis and/or MR using plasma pQTLs derived from the UKB-PPP. d, Overview of MR IVW P value associations for pQTLs in plasma compared to the corresponding single-cell MR IVW P value (x axis) at −log10 scale. e, Overview of MR IVW P value associations for pQTLs in brain (y axis) compared to corresponding single-cell MR IVW P value (x axis) at −log10 scale.

References

    1. Maurano, M. T. et al. Systematic localization of common disease-associated variation in regulatory DNA. Science337, 1190–1195 (2012). - PMC - PubMed
    1. Hekselman, I. & Yeger-Lotem, E. Mechanisms of tissue and cell-type specificity in heritable traits and diseases. Nat. Rev. Genet.21, 3 (2020). - PubMed
    1. Burgess, S. et al. Using genetic association data to guide drug discovery and development: review of methods and applications. Am. J. Hum. Genet.110, 195–214 (2023). - PMC - PubMed
    1. Soskic, B. et al. Immune disease risk variants regulate gene expression dynamics during CD4+ T cell activation. Nat. Genet.54, 6 (2022). - PMC - PubMed
    1. Porcu, E. et al. Differentially expressed genes reflect disease-induced rather than disease-causing changes in the transcriptome. Nat. Commun.12, 5647 (2021). - PMC - PubMed

LinkOut - more resources