Clinical Trial
. 2025 Mar;31(3):979-987.
doi: 10.1038/s41591-024-03406-8. Epub 2025 Jan 10.

Autologous macrophage therapy for liver cirrhosis: a phase 2 open-label randomized controlled trial

Affiliations
Clinical Trial

Autologous macrophage therapy for liver cirrhosis: a phase 2 open-label randomized controlled trial

Paul N Brennan et al. Nat Med. 2025 Mar.

Abstract

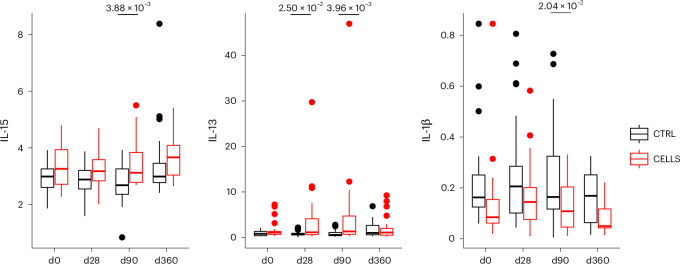
Cirrhosis is a major cause of morbidity and mortality; however, there are no approved therapies except orthotopic liver transplantation. Preclinical studies showed that bone-marrow-derived macrophage injections reduce inflammation, resolve fibrosis and stimulate liver regeneration. In a multicenter, open-label, parallel-group, phase 2 randomized controlled trial ( ISRCTN10368050 ) in n = 51 adult patients with compensated cirrhosis and Model for End-Stage Liver Disease (MELD) score ≥10 and ≤17, we evaluated the efficacy of autologous monocyte-derived macrophage therapy (n = 27) compared to standard medical care (n = 24). The primary endpoint was the difference in baseline to day 90 change in MELD score (ΔMELD) between treatment and control groups (ΔΔMELD). Secondary endpoints included adverse clinical outcomes, non-invasive fibrosis biomarkers and health-related quality of life (HRQoL) at 90 d, 180 d and 360 d. The ΔΔMELD between day 0 and day 90 in the treatment group compared to controls was -0.87 (95% confidence interval: -1.79, 0.0; P = 0.06); therefore, the primary endpoint was not met. During 360-d follow-up, five of 24 participants in the control group developed a total of 10 severe adverse events, four of which were liver related, and three deaths (two liver related), whereas no liver-related severe adverse events or deaths occurred in the treatment group. Although no differences were observed in biomarkers or HRQoL, exploratory analysis showed anti-inflammatory serum cytokine profiles after macrophage infusion. This study reinforces the safety and potential efficacy of macrophage therapy in cirrhosis, supporting further investigation.


Conflict of interest statement

Competing interests: P.N.B. has received educational honoraria from Takeda and has served as a consultant to Resolution Therapeutics. I.M.P. has received speaker fees from Advanz Pharma. J.F.D. has received research grants and lecture honoraria from Merck Sharp & Dohme, AbbVie and Gilead. A.M.K. is a consultant to Resolution Therapeutics. J.D.M.C. is a founder of and adviser to Resolution Therapeutics. J.A.F. serves as a consultant or advisory board member for Stellaris, Kynos Therapeutics, Resolution Therapeutics, Ipsen, River 2 Renal Corp., Stimuliver, Global Clinical Trial Partners and Guidepoint and has received speaker fees from HistoIndex and research grant funding from GlaxoSmithKline, Intercept Pharmaceuticals and Genentech. S.J.F. is a founder of and adviser to Resolution Therapeutics and an adviser to Cytotheryx. The other authors declare no competing interests.

Figures

Fig. 1
Fig. 1. CONSORT diagram of the participant flow.
The diagram is split by triple-infusion, single-infusion and control groups.
Fig. 2
Fig. 2. Baseline to day 90 ΔMELD score.
a, Box plot of ΔMELD score, split by treatment allocation. Control (CTRL) group: n = 24 participants. CELLS group: n = 27 participants (includes both single-infusion and triple-infusion participants). Box plots are defined as first to third quartile (Q1, Q3), with center line representing the median. Whiskers extend to the lowest/highest values no further than 1.5× IQR from Q1/Q3, as appropriate. b, Plot of total cell dose (n × 109) versus ΔMELD. Participants are color coded by dominant etiology (ALD, MASLD or Other). This plot includes all participants who received at least one infusion.
Fig. 3
Fig. 3. Longitudinal cytokine measurements.
Box plots of anti-inflammatory and pro-inflammatory cytokines with significant effects due to macrophage treatment, split by timepoint and treatment. Control (CTRL) group: n = 23 participants (except d360 in all cytokines n = 21). CELLS group: n = 26 participants. Repeated ANOVA, two-sided, with pairwise two-sided post hoc tests. Box plots are defined as first to third quartile (Q1, Q3), with center line representing the median. Whiskers extend to the lowest/highest values no further than 1.5× IQR from Q1/Q3, as appropriate. d, day.
Extended Data Fig. 1
Extended Data Fig. 1. Isolation of monocytes and manufacturing of the MATCH01 product.
a-d, Process robustness for manufacturing of the MATCH01 product. All products manufactured in the 23-participant single-dose group and the 3-participant triple-dose group. a-b Leukapheresis starting material (a, Total Nucleated Cell (TNC) collected from steady state leukapheresis from male and female participants * p = 0.0398; b, CD14+ monocyte content in steady state leukapheresis ** p = 0.0069). Two-sided unpaired t-test. c-d, Performance in manufacturing process (c, yield of CD14+ cells from the CliniMACS Prodigy selection procedure; d, final process yield of manufactured product for infusion, as a percentage of input CD14+ monocytes. ns = no significant difference by two-sided unpaired t-test. e-f, Phenotype of macrophages in final manufactured product for infusion, compared between alcohol and non-alcohol-related liver disease groups, 19 consecutive participants from single dose series. Two-sided unpaired t-tests. e, Expression of CD14 and CD16 in infused product between alcohol and non-alcohol-related liver disease groups. f, Change in relative expression of CD163, CD169 and CCR2 molecules on final product macrophages, compared to input monocytes. In all panels, bars represent group means.
Extended Data Fig. 2
Extended Data Fig. 2. Intra-patient robustness of macrophage manufacturing process.
Three participants (P1, P2, P3) donated leukapheresis three times at monthly intervals and received infusions of freshly manufactured macrophages. a, The total leukocyte content and the b, CD14 content of each donation remained constant between each donation timepoint. c, CD14+ selection efficiency and d, conversion to macrophages in the final product remained constant between each donation and comparable to the main group (Extended Data Fig. 1). e, Accordingly, the participants received infusions of comparable numbers of macrophages on each occasion, even though the product was manufactured in a unique production run per product.
Extended Data Fig. 3
Extended Data Fig. 3. Plot of the baseline to day 360 changes in MELD score (∆MELD).
Individual line plots are shown for each participant. Treatment allocation is separated into participants that received three cell infusions, single cell infusions and control (standard of care).
Extended Data Fig. 4
Extended Data Fig. 4. Summary of anti- and pro-inflammatory cytokine data.
Heatmap of median log fold change for measurements of anti- and pro-inflammatory cytokines, compared to day 0, in treated and untreated groups.

References

    1. Devarbhavi, H. et al. Global burden of liver disease: 2023 update. J. Hepatol.79, 516–537 (2023). - PubMed
    1. Huang, D. Q. et al. Global epidemiology of cirrhosis—aetiology, trends and predictions. Nat. Rev. Gastroenterol. Hepatol.20, 388–398 (2023). - PMC - PubMed
    1. Brennan, P. N. et al. Progress is impossible without change: understanding the evolving nomenclature of steatotic liver disease and its effect on hepatology practice. Lancet Gastroenterol. Hepatol.9, 577–582 (2024). - PubMed
    1. Pellicoro, A., Ramachandran, P., Iredale, J. P. & Fallowfield, J. A. Liver fibrosis and repair: immune regulation of wound healing in a solid organ. Nat. Rev. Immunol.14, 181–194 (2014). - PubMed
    1. D’Amico, G., Garcia-Tsao, G. & Pagliaro, L. Natural history and prognostic indicators of survival in cirrhosis: a systematic review of 118 studies. J. Hepatol.44, 217–231 (2006). - PubMed

Publication types