. 2025 Jan 10;30(1):5.
doi: 10.1186/s11658-024-00680-9.

Effect of SNORD113-3/ADAR2 on glycolipid metabolism in glioblastoma via A-to-I editing of PHKA2

Affiliations

Effect of SNORD113-3/ADAR2 on glycolipid metabolism in glioblastoma via A-to-I editing of PHKA2

Zheng Cui et al. Cell Mol Biol Lett. .

Abstract

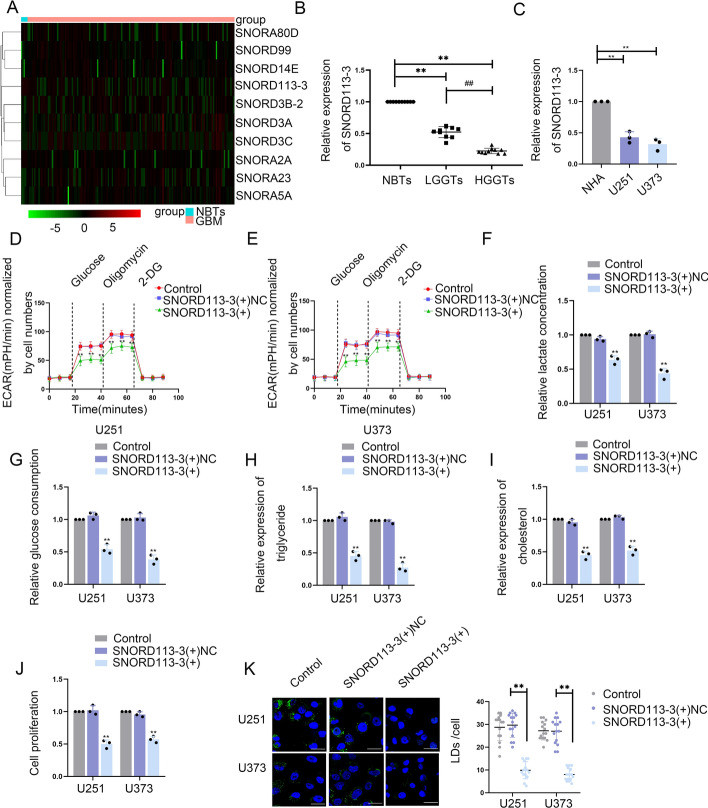
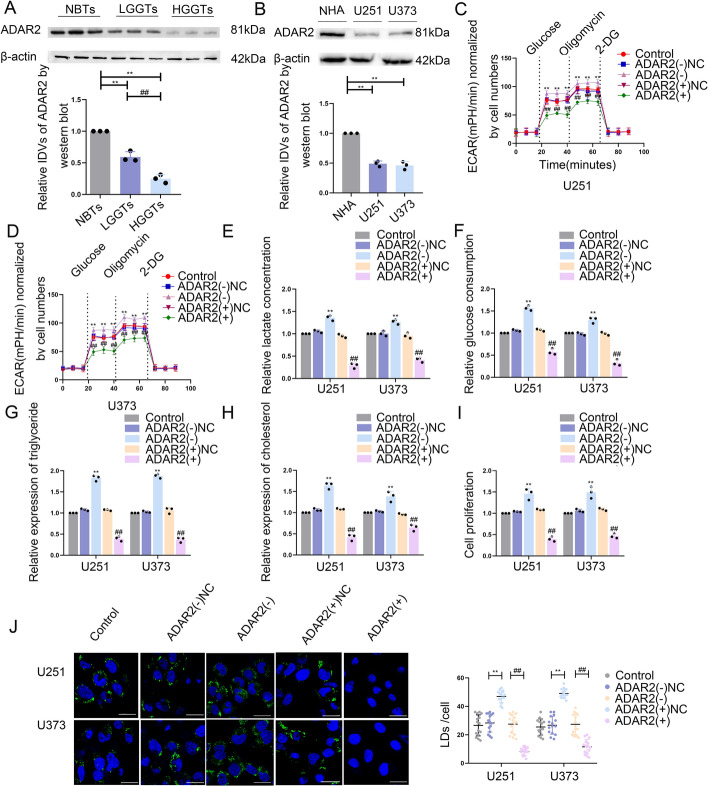
Background: Glioblastoma multiforme (GBM) is a highly aggressive brain tumor, characterized by its poor prognosis. Glycolipid metabolism is strongly associated with GBM development and malignant behavior. However, the precise functions of snoRNAs and ADARs in glycolipid metabolism within GBM cells remain elusive. The objective of the present study is to delve into the underlying mechanisms through which snoRNAs and ADARs exert regulatory effects on glycolipid metabolism in GBM cells.

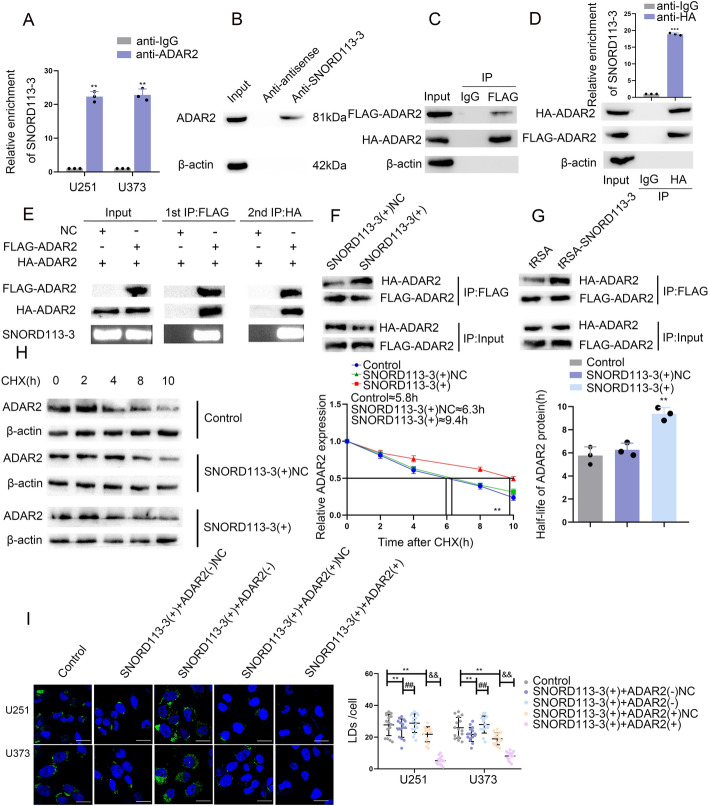
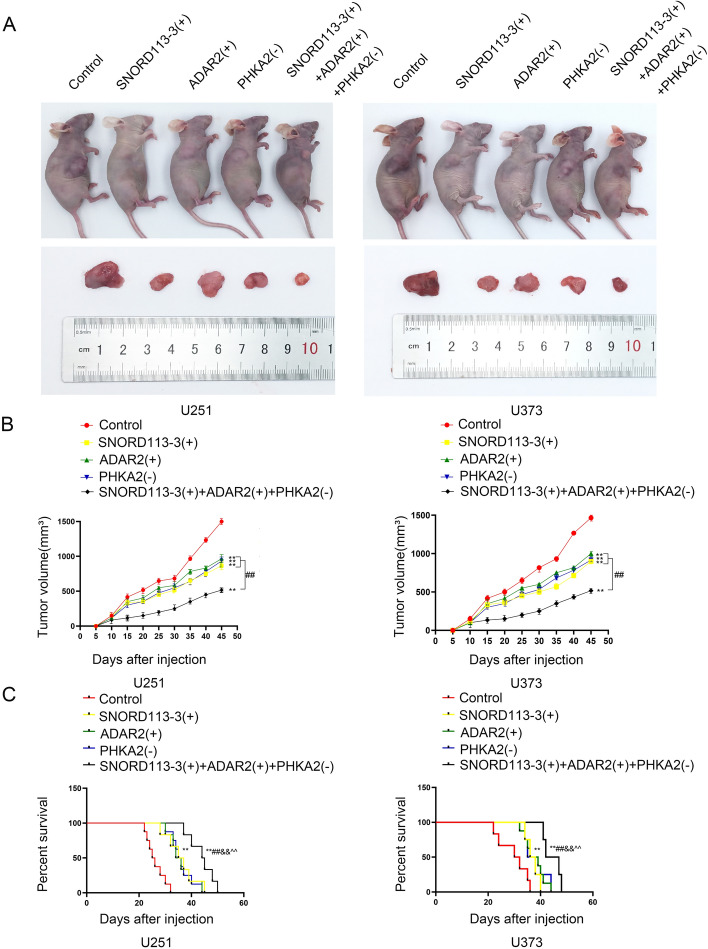
Methods: RNA immunoprecipitation and RNA pull-down experiments were conducted to verify the homodimerization of ADAR2 by SNORD113-3, and Sanger sequencing and Western blot experiments were used to detect the A-to-I RNA editing of PHKA2 mRNA by ADAR2. Furthermore, the phosphorylation of EBF1 was measured by in vitro kinase assay. Finally, in vivo studies using nude mice confirmed that SNORD113-3 and ADAR2 overexpression, along with PHKA2 knockdown, could suppress the formation of subcutaneous xenograft tumors and improve the outcome of tumor-bearing nude mice.

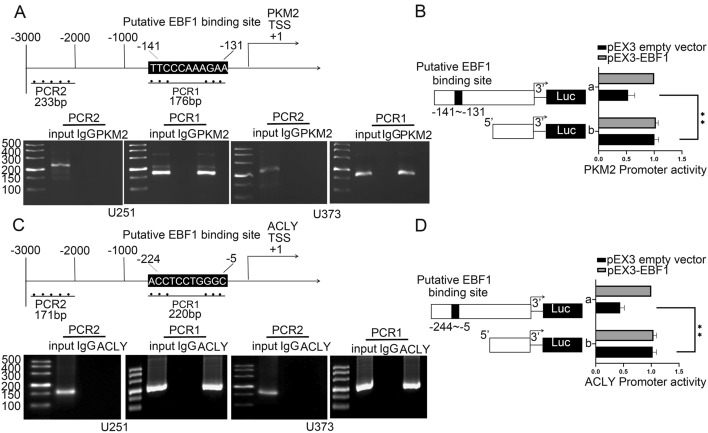
Results: We found that PHKA2 in GBM significantly promoted glycolipid metabolism, while SNORD113-3, ADAR2, and EBF1 significantly inhibited glycolipid metabolism. SNORD113-3 promotes ADAR2 protein expression by promoting ADAR2 homodimer formation. ADAR2 mediates the A-to-I RNA editing of PHKA2 mRNA. Mass spectrometry analysis and in vitro kinase testing revealed that PHKA2 phosphorylates EBF1 on Y256, reducing the stability and expression of EBF1. Furthermore, direct binding of EBF1 to PKM2 and ACLY promoters was observed, suggesting the inhibition of their expression by EBF1. These findings suggest the existence of a SNORD113-3/ADAR2/PHKA2/EBF1 pathway that collectively regulates the metabolism of glycolipid and the growth of GBM cells. Finally, in vivo studies using nude mice confirmed that knockdown of PHKA2, along with overexpression of SNORD113-3 and ADAR2, could obviously suppress GBM subcutaneous xenograft tumor formation and improve the outcome of those tumor-bearing nude mice.

Conclusions: Herein, we clarified the underlying mechanism involving the SNORD113-3/ADAR2/PHKA2/EBF1 pathway in the regulation of GBM cell growth and glycolipid metabolism. Our results provide a framework for the development of innovative therapeutic interventions to improve the prognosis of patients with GBM.

Keywords: A-to-I RNA editing; ADAR2; Glioma; Glycolipid metabolism; Phosphorylation.


Conflict of interest statement

Declarations. Ethics approval and consent to participate: All patients have provided their informed consent with ethical approval granted by the Ethics Committee of the Affiliated Hospital of China Medical University. Similarly, the animal experiments conducted have been authorized by the Ethics Committee of the Affiliated Hospital of China Medical University. Competing interests: The authors declare that they have no competing interests.

Figures

Fig. 1
Fig. 1
Screening for SNORD113-3, the expression of SNORD113-3, and its effects on glycolipid metabolism in GBM. A Heatmap with hierarchical cluster analysis of differentially expressed snoRNAs between non-tumor brain tissues (NBTs) and glioblastoma (GBM) tissues. P < 0.05, |log2FC|> 1. B SNORD113-3 expression was downregulated in tissues (NBTs [n = 10], LGGTs [n = 10], and HGGTs [n = 10]) via qRT-PCR. **P < 0.01 versus NBTs group; ##P < 0.01 versus LGGTs group. C SNORD113-3 expression level was analyzed in NHA cell, U251, and U373 cells via qRT-PCR. Data presented as mean ± SD (n = 3, each group), **P < 0.01 versus the NHA group. D, E The extracellular acidification rate (ECAR) was measured to demonstrate the effects of SNORD113-3 on glycolysis in U251 and U373 cells, and the glycolysis was calculated. Data presented as mean ± SD (n = 3, each group), **P < 0.01 versus SNORD113-3( +)NC group. F, G Lactate production and glucose uptake were measured in U251 and U373 cells after SNORD113-3 overexpression. Data presented as mean ± SD (n = 3, each group), **P < 0.01 versus SNORD113-3( +)NC group. H, I Intracellular triglyceride and cholesterol expression levels were measured after SNORD113-3 overexpression. Data presented as mean ± SD (n = 3, each group), **P < 0.01 versus SNORD113-3( +)NC group. J The effect of SNORD113-3 on proliferation was analyzed via CCK-8 assay. Data presented as mean ± SD (n = 3, each group), **P < 0.01 versus SNORD113-3( +)NC group. K Representative confocal fluorescence imaging of lipid droplets (LDs) stained by BODIPY 493/503 (green) in U251 and U373 cells. The nucleus (blue) was stained by DAPI. Scale bars = 10 µm. Data presented as mean ± SD (n = 15, each group). **P < 0.01 versus SNORD113-3( +)NC group. One-way ANOVA was used for statistical analysis
Fig. 2
Fig. 2
The expression of ADAR2 and its effects on glycolipid metabolism and proliferation in GBM. A ADAR2 protein levels were analyzed in NBTs, LGGTs, and HGGTs by western blot. Data presented as mean ± SD (n = 3, each group), **P < 0.01 versus NBTs group; ##P < 0.01 versus LGGTs group. B ADAR2 protein levels in NHA, U251, and U373 cells were detected via western blot. Data presented as mean ± SD (n = 3, each group), **P < 0.01 versus the NHA group. C, D The extracellular acidification rate (ECAR) was measured to demonstrate the effects of ADAR2 on glycolysis in U251 and U373 cells, and the glycolysis was calculated. Data presented as mean ± SD (n = 3, each group), **P < 0.01 versus ADAR2(–)NC group; ##P < 0.01 versus ADAR2( +)NC group. E, F Lactate production and glucose uptake were measured in U251 and U373 cells after ADAR2 knockdown or overexpression. Data presented as mean ± SD (n = 3, each group), **P < 0.01 versus ADAR2(–)NC group; ##P < 0.01 versus ADAR2( +)NC group. G, H Intracellular triglyceride and cholesterol expression levels were measured to evaluate the effect of ADAR2 on lipogenesis. Data presented as mean ± SD (n = 3, each group), **P < 0.01 versus ADAR2(–)NC group; ##P < 0.01 versus ADAR2( +)NC group. I The effect of ADAR2 on proliferation was analyzed via CCK-8 assay. Data presented as mean ± SD (n = 3, each group), **P < 0.01 versus ADAR2(–)NC group; ##P < 0.01 versus ADAR2( +)NC group. J Representative confocal fluorescence imaging of LDs stained by BODIPY 493/503 (green) in U251 and U373 cells after ADAR2 knockdown or overexpression. The nucleus (blue) was stained by DAPI. Scale bars = 10 µm. Data presented as mean ± SD (n = 15, each group). **P < 0.01 versus ADAR2(–)NC group; ##P < 0.01 versus ADAR2( +)NC group. Statistical analysis was performed using the one-way ANOVA method
Fig. 3
Fig. 3
SNORD113-3 facilitated glycolipid metabolism of GBM cells by promoting ADAR2 dimerization. A An enrichment of SNORD113-3 in ADAR2 immunoprecipitated samples via RNA immunoprecipitation (RIP) assay. Data presented as mean ± SD (n = 3, each group), **P < 0.01 versus the anti-IgG group. B RNA pull-down assay followed by western blot showed the specific associations of ADAR2 with biotinylated-SNORD113-3 or antisense RNA. C Immunoprecipitation of FLAG-ADAR2 with HA-ADAR2 was performed using 293 T cells. D FLAG-ADAR2 and SNORD113-3 were coprecipitated with HA-ADAR2 in 293 T cells. E FLAG-ADAR2, HA-ADAR2, and SNORD113-3 were coprecipitated with anti-FLAG antibody, eluted with FLAG peptide, and then coprecipitated with the anti-HA antibody (n = 3, each group). F, G SNORD113-3 promote the binding of FLAG-ADAR2 to HA-ADAR2 both in vivo and in vitro (n = 3, each group). H The effects of ADAR2 stability were detected by cycloheximide (CHX) chase assays. Data presented as mean ± SD (n = 3, each group). **P < 0.01 versus SNORD113-3( +)NC group. I Representative confocal fluorescence imaging of LDs stained by BODIPY 493/503 (green) in U251 and U373 cells. The nucleus (blue) was stained by DAPI. Scale bars = 10 µm. Data presented as mean ± SD (n = 15, each group). **P < 0.01 versus control group; ##P < 0.01 versus SNORD113-3( +) + ADAR2(–)NC group; &&P < 0.01 versus SNORD113-3( +) + ADAR2( +)NC group. Statistical analysis was performed using the one-way ANOVA method
Fig. 4
Fig. 4
The expression of PHKA2 and its effects on glycolipid metabolism in GBM. A PHKA2 protein levels were analyzed in NBTs, LGGTs, and HGGTs by western blot. Data presented as mean ± SD (n = 3, each group), *P < 0.05 versus NBTs group; **P < 0.01 versus NBTs group; ##P < 0.01 versus LGGTs group. B PHKA2 protein levels in NHA, U251, and U373 cells were detected via western blot. Data presented as mean ± SD (n = 3, each group), **P < 0.01 versus the NHA group. C, D The extracellular acidification rate (ECAR) was measured to demonstrate the effects of PHKA2 on glycolysis in U251 and U373 cells, and the glycolysis was calculated. Data presented as mean ± SD (n = 3, each group), **P < 0.01 versus PHKA2(–)NC group; ##P < 0.01 versus PHKA2( +)NC group. E, F Lactate production and glucose uptake were measured in U251 and U373 cells after PHKA2 knockdown or overexpression. Data presented as mean ± SD (n = 3, each group), **P < 0.01 versus PHKA2(–)NC group; ##P < 0.01 versus PHKA2( +)NC group. G, H Intracellular triglyceride and cholesterol expression levels were measured to evaluate the effect of PHKA2 on lipogenesis. Data presented as mean ± SD (n = 3, each group), **P < 0.01 versus PHKA2(–)NC group; ##P < 0.01 versus PHKA2( +)NC group. I The effect of PHKA2 on proliferation was analyzed via CCK-8 assay. **P < 0.01 versus PHKA2(–)NC group; ##P < 0.01 versus PHKA2( +)NC group. Data presented as mean ± SD (n = 3, each group). J Representative confocal fluorescence imaging of lipid droplets (LDs) stained by BODIPY 493/503 (green) in U251 and U373 cells. The nucleus (blue) was stained by DAPI. Scale bars = 10 µm. Data presented as mean ± SD (n = 15, each group). **P < 0.01 versus PHKA2(–)NC group; ##P < 0.01 versus PHKA2( +)NC group. Statistical analysis was performed using the one-way ANOVA method
Fig. 5
Fig. 5
PHKA2 facilitated glycolipid metabolism of GBM cells by ADAR2-induced A-to-I RNA editing. A An enrichment of PHKA2 mRNA in ADAR2 immunoprecipitated samples via RNA immunoprecipitation (RIP) assay. Data presented as mean ± SD (n = 3, each group), **P < 0.01 versus the anti-IgG group. B Sequence chromatograms of PHKA2 transcripts in U251 transduced with ADAR2(–)NC, ADAR2(–), or ADAR1(-)NC, ADAR1(–). Arrowheads indicate edited positions. Percentages indicate the calculated frequency of editing at selected positions. C Sequence chromatograms of the PHKA2 mRNA. Arrowheads indicate edited positions. D Western blot of ADAR2 and PHKA2 in U251 and U373 cells. Data presented as mean ± SD (n = 3, each group), **P < 0.01 versus ADAR2(–)NC group;##P < 0.01 versus ADAR2( +)NC group. E The half-life of PHKA2 mRNA at different times treated by ActD with ADAR2 overexpression in U251 and U373 cells. Data presented as mean ± SD (n = 3, each group), **P < 0.01 versus the ADAR2( +) group. F ECAR was used to measure the glycolysis and glycolytic capacity of U251 and U373 cells. Data presented as mean ± SD (n = 3, each group), **P < 0.01 versus control group; ##P < 0.01 versus ADAR2( +) + PHKA2(-)NC group; &&P < 0.01 versus ADAR2( +) + PHKA2( +)NC group. Statistical analysis was measured using the one-way ANOVA method.
Fig. 6
Fig. 6
The expression of EBF1 and its effects on glycolipid metabolism in GBM. A EBF1 protein levels were analyzed in NBTs, LGGTs, and HGGTs by western blot. Data presented as mean ± SD (n = 3, each group), **P < 0.01 versus the NBTs group; ##P < 0.01 versus the LGGs group. B EBF1 protein levels in NHA, U251, and U373 cells were detected via western blot. Data presented as mean ± SD (n = 3, each group), **P < 0.01 versus the NHA group. C, D The extracellular acidification rate (ECAR) was measured to demonstrate the effects of EBF1 on glycolysis in U251 and U373 cells, and the glycolysis was calculated. Data presented as mean ± SD (n = 3, each group), **P < 0.01 versus EBF1(–)NC group; ##P < 0.01 versus EBF1( +)NC group. E, F Lactate production and glucose uptake were measured in U251 and U373 cells after EBF1 knockdown or overexpression. Data presented as mean ± SD (n = 3, each group), **P < 0.01 versus EBF1(–)NC group; ##P < 0.01 versus EBF1( +)NC group. G, H Intracellular triglyceride and cholesterol expression levels were measured to evaluate the effect of EBF1 on lipogenesis. Data presented as mean ± SD (n = 3, each group), **P < 0.01 versus PHKA2(–)NC group; ##P < 0.01 versus PHKA2( +)NC group. I The effect of EBF1 on proliferation was analyzed via CCK-8 assay. **P < 0.01 versus EBF1(–)NC group; ##P < 0.01 versus EBF1( +)NC group. Data presented as the mean ± SD (n = 3, each group). J Representative confocal fluorescence imaging of lipid droplets (LDs) stained by BODIPY 493/503 (green) in U251 and U373 cells. The nucleus (blue) was stained by DAPI. Scale bars = 10 µm. Data presented as mean ± SD (n = 15, each group). **P < 0.01 versus EBF1(–)NC group; ##P < 0.01 versus EBF1( +)NC group. Statistical analysis was performed using the one-way ANOVA method
Fig. 7
Fig. 7
The effects of EBF1 phosphorylated by PHKA2 on glycolipid metabolism and proliferation in GBM. A Lysates of U251 cells were subjected to immunoprecipitation (IP) and immunoblotting (IB) with PHKA2 and EBF1 antibodies. B Lysates of 293 T cells transfected with FLAG-PHKA2 and GST-EBF1 plasmids were subjected to IP and IB with FLAG tag and GST tag antibodies. C The direct interaction between PHKA2 and EBF1 was confirmed by GST pull-down assays. GST protein functioned as a negative control. D, E ECAR was used to measure the glycolysis and glycolytic capacity of U251 and U373 cells. Data presented as mean ± SD (n = 3, each group), **P < 0.01 versus control group; ##P < 0.01 versus PHKA2(–) + ENF1( +)NC group; &&P < 0.01 versus PHKA2(–) + EBF1(–)NC group. F Representative confocal fluorescence imaging of LDs stained by BODIPY 493/503 (green) in U251 and U373 cells. The nucleus (blue) was stained by DAPI. Scale bars = 10 µm. Data presented as mean ± SD (n = 15, each group). **P < 0.01 versus control group; ##P < 0.01 versus PHKA2(–) + EBF1( −)NC group; &&P < 0.01 versus PHKA2(-) + EBF1( +)NC group. G Left panel, in vitro kinase assays were performed and detected by autoradiography (arrow, phosphorylated band). Right panel, proteins were visualized by Coomassie brilliant blue (CBB) staining. H The phosphorylated bands were subjected to mass spectrometry, and Y256 was identified. I In vitro kinase assays and CBB staining were conducted after Y256 mutation. J The effects of Y256 phosphorylation on EBF1 stability were detected by cycloheximide (CHX) chase assays. Data presented as mean ± SD (n = 3, each group). **P < 0.01 versus EBF1-WT group. Statistical analysis was performed using the one-way ANOVA method
Fig. 8
Fig. 8
EBF1 directly bound to the promoter regions of PKM2, ACLY and transcriptionally suppressed their expression. A The putative EBF1 binding site is indicated in the PKM2 promoter region (above). Chromatin immunoprecipitation (ChIP) assay showed the products amplified putative EBF1-binding sites of PKM2 (below). B Schematic diagram of luciferase reporter construction and PKM2 relative luciferase activity measured in cells cotransfected with the PKM2 promoter (−1000 to 0 bp) (or PKM2 promoter-deleted putative EBF1 binding site) and pEX3 empty vector or pEX3-EBF1. Data presented as mean ± SD (n = 3, each group), **P < 0.01 versus pEX3 empty vector group. C The putative EBF1 binding site is indicated in the ACLY promoter region (above). ChIP assay showed the products amplified putative EBF1-binding sites of ACLY (below). D Schematic diagram of luciferase reporter construction and ACLY relative luciferase activity measured in cells cotransfected with the ACLY promoter (−1000 to 0 bp) (or ACLY promoter-deleted putative EBF1 binding site) and pEX3 empty vector or pEX3-EBF1. Data presented as mean ± SD (n = 3, each group), **P < 0.01 versus pEX3 empty vector group. One-way ANOVA was used for statistical analysis
Fig. 9
Fig. 9
Overexpression of SNORD113-3 and ADAR2 with knockdown of PHKA2 suppressed tumor growth and prolonged survival in nude mice. A Subcutaneously xenografted nude mice injected with different treated cells are shown (above). Representative tumors from each group are shown (below). B Tumor growth curves are shown. Tumor size was recorded every 5 days, and tumors were extracted at 45 days after injection. **P < 0.01 versus control group; ##P < 0.01 versus SNORD113-3(+) + ADAR2(+) + PHKA2(−) group by two-way ANOVA. C Survival curves of nude mice with orthotopic xenografts are shown. Data presented as mean ± SD (n = 8, each group). **P < 0.01 versus control group; ##P < 0.01, &&P < 0.01, ^^P < 0.01, SNORD113-3(+), ADAR2(+) or PHKA2(–) group compared with the SNORD113-3(+) + ADAR2(+) + PHKA2(–) group, respectively
Fig. 10
Fig. 10
SNORD113-3 mediates ADAR2 A-to-I editing of PHKA2 mRNA, promoting EBF1-Y256 phosphorylation in the regulation of glycolipid metabolism and proliferation of GBM cells: schematic diagram

References

    1. da Hora CC, Schweiger MW, Wurdinger T, Tannous BA. Patient-derived glioma models: from patients to dish to animals. Cells. 2019;8:1177. - PMC - PubMed
    1. Janjua TI, Rewatkar P, Ahmed-Cox A, Saeed I, Mansfeld FM, Kulshreshtha R, Kumeria T, Ziegler DS, Kavallaris M, Mazzieri R, et al. Frontiers in the treatment of glioblastoma: past, present and emerging. Adv Drug Deliv Rev. 2021;171:108–38. - PubMed
    1. Park JY, Lee JE, Park JB, Yoo H, Lee SH, Kim JH. Roles of long non-coding RNAs on tumorigenesis and glioma development. Brain Tumor Res Treat. 2014;2(1):1–6. - PMC - PubMed
    1. Strickland M, Stoll EA. Metabolic reprogramming in glioma. Front Cell Dev Biol. 2017;5:43. - PMC - PubMed
    1. Geng F, Cheng X, Wu X, Yoo JY, Cheng C, Guo JY, Mo X, Ru P, Hurwitz B, Kim SH, et al. Inhibition of SOAT1 suppresses glioblastoma growth via blocking SREBP-1-mediated lipogenesis. Clin Cancer Res. 2016;22:5337–48. - PMC - PubMed