

Geographic factors associated with SARS-CoV-2 prevalence during the first wave - 6 districts in Zambia, July 2020
- PMID: 39794764
- PMCID: PMC11720952
- DOI: 10.1186/s12889-025-21347-w
Geographic factors associated with SARS-CoV-2 prevalence during the first wave - 6 districts in Zambia, July 2020
Abstract
Background: Geographical factors can affect infectious disease transmission, including SARS-CoV-2, a virus that is spread through respiratory secretions. Prioritization of surveillance and response activities during a pandemic can be informed by a pathogen's geographical transmission patterns. We assessed the relationship between geographical factors and SARS-CoV-2 prevalence in Zambia.
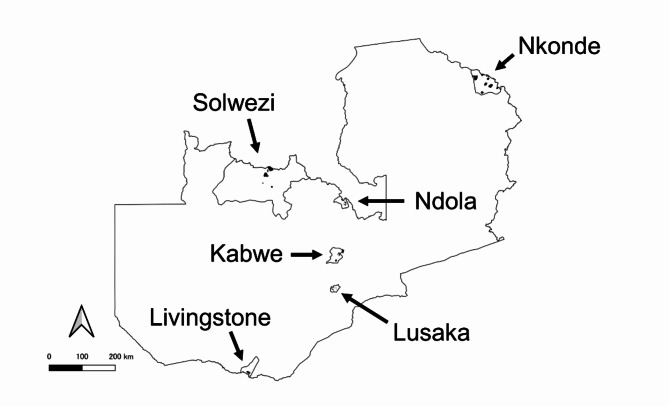
Methods: We did a cross-sectional study of SARS-CoV-2 prevalence in six districts in July 2020, which was during the upslope of the first wave in Zambia. In each district, 16 Standard Enumeration Areas (SEAs) were randomly selected and 20 households from each SEA were sampled. The SEA PCR prevalence was calculated as the number of persons testing PCR positive for SARS-CoV-2 in the SEA times the individual sampling weight for the SEA divided by the SEA population. We analysed SEA geographical data for population density, socioeconomic status (SES) (with lower scores indicating reduced vulnerability), literacy, access to water, and sanitation, and hygiene (WASH) factors. Gaussian conditional autoregressive (CAR) models and Generalised estimating equations (GEE) were used to measure adjusted prevalence Ratios (aPRs) and 95% confidence intervals (CIs) for SARS-CoV-2 prevalence with geographical factors, after adjusting for clustering by district, in R.
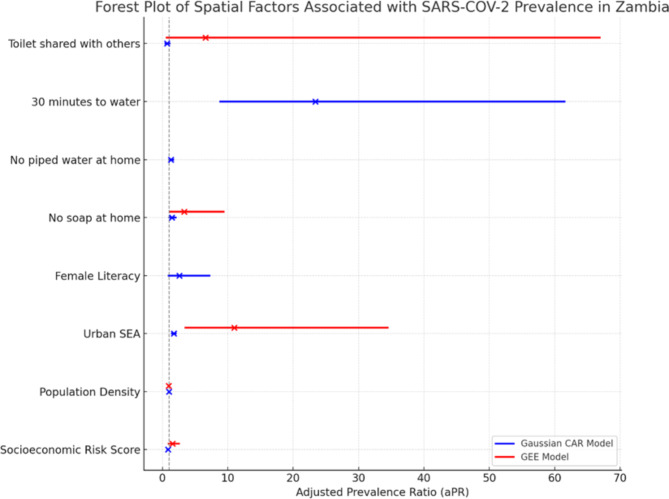
Results: Overall, the median SARS-CoV-2 prevalence in the 96 SEAs was 41.7 (Interquartile range (IQR), 0.0-96.2) infections per 1000 persons. In the multivariable CAR analysis, increasing SES vulnerability was associated with lower SARS-CoV-2 prevalence (aPR) = 0.85, 95% CI: 0.78-0.94). Conversely, urban SEAs and poor access to WASH were associated with a higher SARS-CoV-2 prevalence (aPR = 1.73, 95% CI: 1.46-2.03, No soap: aPR = 1.47, 95% CI: 1.05-2.05, households without piped water: aPR = 1.32, 95% CI: 1.05-1.65, 30 min to fetch water: aPR = 23.39, 95% CI: 8.89-61.52). Findings were similar in the multivariable GEE analysis.
Conclusions: SARS-CoV-2 prevalence was higher in wealthier, urban EAs, with poor access to WASH. As this study was conducted early in the first wave could have impacted our findings. Additional analyses from subsequent waves could confirm if these findings persist. During the beginning of a COVID-19 wave in Zambia, surveillance and response activities should be focused on urban population centres and improving access to WASH.
Keywords: COVID-19; Hygiene; Literacy; Prevalence; SARS-CoV-2; Sanitation; Urban population; Water; Zambia.
© 2025. The Author(s).
Conflict of interest statement
Declarations. Ethics approval and consent to participate: Ethical approval to conduct the primary study was obtained from the University of Zambia Biomedical Research Ethics Committee (IRB00001131 of IORG0000774) study reference (REF. NO. 1030–2020). Consent to participate: Not applicable. Consent for publication: Not applicable. Competing interests: The authors declare no competing interests.
Figures
References
MeSH terms
LinkOut - more resources
Full Text Sources
Medical
Research Materials
Miscellaneous
