. 2025 Jan 11;44(1):11.
doi: 10.1186/s13046-024-03270-x.

PRMT5 inhibition has a potent anti-tumor activity against adenoid cystic carcinoma of salivary glands

Affiliations

PRMT5 inhibition has a potent anti-tumor activity against adenoid cystic carcinoma of salivary glands

Vasudha Mishra et al. J Exp Clin Cancer Res. .

Abstract

Background: Adenoid cystic carcinoma (ACC) is a rare glandular malignancy, commonly originating in salivary glands of the head and neck. Given its protracted growth, ACC is usually diagnosed in advanced stage. Treatment of ACC is limited to surgery and/or adjuvant radiotherapy, which often fails to prevent disease recurrence, and no FDA-approved targeted therapies are currently available. As such, identification of new therapeutic targets specific to ACC is crucial for improved patients' outcomes.

Methods: After thoroughly evaluating the gene expression and signaling patterns characterizing ACC, we applied PandaOmics (an AI-driven software platform for novel therapeutic target discovery) on the unique transcriptomic dataset of 87 primary ACCs. Identifying protein arginine methyl transferase 5 (PRMT5) as a putative candidate with the top-scored druggability, we next determined the applicability of PRMT5 inhibitors (PRT543 and PRT811) using ACC cell lines, organoids, and patient derived xenograft (PDX) models. Molecular changes associated with response to PRMT5 inhibition and anti-proliferative effect of the combination therapy with lenvatinib was then analyzed.

Results: Using a comprehensive AI-powered engine for target identification, PRMT5 was predicted among potential therapeutic target candidates for ACC. Here we show that monotherapy with selective PRMT5 inhibitors induced a potent anti-tumor activity across several cellular and animal models of ACC, which was paralleled by downregulation of genes associated with ACC tumorigenesis, including MYB and MYC (the recognized drivers of ACC progression). Furthermore, as a subset of genes targeted by lenvatinib is upregulated in ACC, we demonstrate that addition of lenvatinib enhanced the growth inhibitory effect of PRMT5 blockade in vitro, suggesting a potential clinical benefit for patients expressing lenvatinib favorable molecular profile.

Conclusion: Taken together, our study underscores the role of PRMT5 in ACC oncogenesis and provides a strong rationale for the clinical development of PRMT5 inhibitors as a targeted monotherapy or combination therapy for treatment of patients with this rare disease, based on the analysis of their underlying molecular profile.

Keywords: Adenoid cystic carcinoma (ACC); Organoid models; PandaOmics; Patient derived xenografts (PDXs); Protein arginine methyl transferase 5 (PRMT5); RNA-Seq; Whole exome sequencing.


Conflict of interest statement

Declarations. Ethics approval and consent to participate: All human samples used in this study were obtained by the Human Tissue Resource Center at the University of Chicago following informed written consent, under the Institutional Review Boards (IRB)-approved protocols. Consent for publication: Not applicable. Competing interests: VT, KI, PS, and BR are affiliated with Prelude Therapeutics, a clinical-stage biopharmaceutical company designing and developing novel small molecule therapies that target the key drivers of cancer cell growth and resistance. MK, VS, AO, OG, IO, FP, and AZ are affiliated with InSilico Medicine, a company developing an AI-based end-to-end integrated pipeline for drug discovery and development. The remaining authors declare no conflict of interest.

Figures
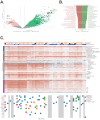
Fig. 1
Fig. 1
Genomic characterization of the University of Chicago ACC tumors dataset. (A) Volcano plot based on the transcriptomic data comparing ACC specimens and normal salivary gland samples. Green and pink colors depict significantly up-regulated and down-regulated genes respectively. Darker colors highlight genes known to be associated with ACC carcinogenesis. (B) Gene set enrichment analysis based on the transcriptomic data comparing ACC tumors and non-involved salivary gland samples. Analysis was performed using two collections of gene sets obtained from Enrichr library: MSigDB Hallmark 2020 and KEGG 2021 Human. Top 25 upregulated (green) and downregulated (red) pathways from MSigDB Hallmark gene sets (circle) and KEGG database (triangle) are shown. All indicated pathways have FDR q-val ≤ 0.05. (C) Top: Pathway activation heatmap comparing ACC tumors and normal salivary gland samples. Pathway activation (shades of red) or inhibition (shades of blue) is inferred based on the scores obtained from In silico Pathway Activation Network Decomposition Analysis (iPANDA) algorithm applied to Reactome pathways database. Pathways are grouped according to the Reactome’s “superpathways” that describe normal cellular functions. Bottom: Mutations in genes frequently mutated in ACC (reported by at least two prior studies). Multiple mutations within the same gene in a given sample are indicated once
Fig. 2
Fig. 2
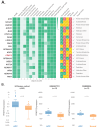
Identification of PRMT5 as a putative therapeutic target for ACC. (A) The PandaOmics TargetID engine was applied to the combined ACC dataset following upper-quartile normalization and log2-transformation to rank ACC target hypotheses based on the predictive models (Omics scores) mined from the transcriptomic data. Omics score values (column 2–14) represent the probability of a given evidence group indicating the association of a given gene to a given disease. All scores range from 0 to 1, with 0 indicating no evidence, and 1 - the highest degree of evidence. The prioritized target hypotheses were screened using the Druggability filters, which utilize traffic light logic (see Methods for color keys) to indicate the most crucial protein characteristics such as accessibility by small molecules and antibodies, safety and novelty (columns 15–18). For this analysis, “small molecule” and “safety” filters were pre-set to include only targets that may be accessible by small compounds, don’t have any red flags in terms of safety, and have an established protein structure. “Antibody” and “novelty” filters have been used as default settings. A ranked list of the top 20 most promising therapeutic targets is shown. (B) PRMT5 mRNA expression levels in ACC tumors and normal salivary gland tissues across three datasets used for the analysis
Fig. 3
Fig. 3
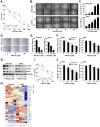
PRT543 inhibits tumorigenic properties of ACC cell lines and organoids. (A) ACC cell lines HACC2A and UFH2 were treated with increasing concentrations of PRT543 and relative cell viability was determined on day 7. (B) ACC cell lines were treated with PRT543 or DMSO for 7 days, trypsinized, counted, plated in triplicate in 6-well plates (1 × 106 cells per well) containing inserts and allowed to attach for 12 h. The inserts were removed and the gap was photographed immediately and after 12 h. (C) Gap area in individual wells was measured using ImageJ and relative gap width percentage was calculated as the gap area at 12 h relative to the gap area at 0 h. (D) ACC cell lines HACC2A and UFH2 were treated with indicated concentrations of PRT543 for 7 days, trypsinized, counted and cultured (1 × 104 cells per well) in triplicate into the transwell chambers. After 24 h the membranes were stained with crystal violet and cells that had migrated through the membrane were photographed. (E) The average number of cells per field that migrated through the membrane is shown as a bar chart. (F) RT-PCR analysis of MYB and MYC gene expression in cells treated with PRT543 for 7 days relative to untreated controls. (G) Lysates were collected at end point from cells treated with increasing concentrations of PRT543 and analyzed by western blot for the expression of indicated proteins. GAPDH was used as loading control. (H) Normalized expression of 24 ACC-related genes in HACC2A and UFH2 cells treated with increasing concentrations of PRT543 displayed as a heatmap. Higher or lower expression of genes is indicated with shades of red or blue cells, respectively. (I) Two ACC organoid models were treated with increasing concentrations of PRT543 and relative cell viability was determined on day 7. (J) RT-PCR analysis of MYB and MYC gene expression in organoid models treated with PRT543 relative to untreated controls. *p < 0.05, **p < 0.01, and ***p < 0.001
Fig. 4
Fig. 4
PRT543 inhibits tumor growth in ACC PDX models in vivo. (A) Five ACC PDX models were treated with either PRT543 (as admixed with chow for models ACCx11, ACCx6 and ACCx5M1 or po for models ACCx2139 and ACCx9) or vehicle. Graphs show the average tumor volume for 5–6 animals ± SD. Red arrow: dosage reduced on day 28 and administered at 5 mg/kg. *p < 0.05, **p < 0.01, ****p < 0.001, ns - not significant. (B) Hierarchical clustering of normalized baseline expression of 24 ACC-related genes in 5 ACC PDX models and 6 normal human salivary gland tissues displayed as a heatmap. Higher or lower expression of genes is indicated with shades of red or blue cells, respectively
Fig. 5
Fig. 5
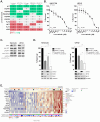
PRT811, a brain penetrant PRMT5 inhibitor, mimics the anti-proliferative effects of PRT543 in vitro. (A-B) Two ACC cell lines were treated with the indicated concentrations of either PRT543 or PRT811. Relative cell viability (A) and proliferation (B) were assessed at the end point. (C) Lysates were collected from cells treated with increasing concentrations of PRT811 for 7 days and analyzed by western blot for the expression of indicated proteins. GAPDH was used as loading control. (D) RT-PCR analysis of MYB and MYC gene expression in cell lines treated with PRT811 for 7 days relative to untreated controls. (E) Two ACC organoid models were treated with increasing concentrations of PRT811 and relative cell viability was determined on day 7. (F) RT-PCR analysis of MYB and MYC gene expression in organoid models treated with PRT811 relative to untreated controls. *p < 0.05, **p < 0.01 and ***p < 0.001
Fig. 6
Fig. 6
Lenvatinib enhances the anti-proliferative effects of PRMT5 inhibition in vitro. (A) mRNA expression level of tyrosine kinases targeted by lenvatinib was analyzed across the indicated datasets. The up pointing and down pointing arrows indicate upregulated and downregulated gene expression, respectively, relative to the normal controls. Differentially upregulated or downregulated genes are indicated with shades of green or red cells, respectively. Gray color indicate genes whose expression is not significantly altered (p-value > 0.05) relative to the normal controls. (B) ACC cell lines HACC2A and UFH2 were treated with increasing concentrations of lenvatinib for 72 h. At the end point, relative cell viability was determined and IC50 value for each cell line was calculated. (C) Lysates were collected from HACC2A and UFH2 cells treated with the IC50 concentration of lenvatinib for 72 h and the expression of indicated proteins was analyzed by western blot. (D) HACC2A and UFH2 cell lines were treated with the IC50 concentrations of PRT811 for 7 days, following by the exposure to IC50 concentrations of lenvatinib at days 8–10. Relative cell viability was determined at the end point (top), and lysates were analyzed by western blot for the expression of indicated proteins (bottom). GAPDH was used as loading control **p < 0.01 and ***p < 0.001. (E) The PRMT5 mRNA expression in 62 primary ACC tumors is sorted from low to high. The corresponding expression of MYC, MYB and lenvatinib target genes are shown for each patient. Higher or lower expression of genes is indicated with shades of red or blue cells, respectively. Pearson coefficient indicates correlation between levels of each gene displayed on the heatmap with PRMT5 mRNA expression. Green frame - a subset of tumors with highest expression of PRMT5 is enriched for elevated levels of MYC, MYB and lenvatinib target genes

References

    1. Boyle TAC, Laurent SS, Semus S, Joseph N. Epidemiology of adenoid cystic carcinoma in the United States. J Clin Oncol. 2020;38:e13600–13600.
    1. Ellington CL, et al. Adenoid cystic carcinoma of the head and neck: incidence and survival trends based on 1973–2007 Surveillance, Epidemiology, and end results data. Cancer. 2012;118:4444–51. - PubMed
    1. Fonseca FP, et al. Clinicopathologic analysis of 493 cases of salivary gland tumors in a Southern Brazilian population. Oral Surg Oral Med Oral Pathol Oral Radiol. 2012;114:230–9. - PubMed
    1. Bjørndal K, et al. Salivary adenoid cystic carcinoma in Denmark 1990–2005: outcome and independent prognostic factors including the benefit of radiotherapy. Results of the Danish Head and Neck Cancer Group (DAHANCA). Oral Oncol. 2015;51:1138–42. - PubMed
    1. Hay AJ, et al. Minor salivary gland tumors of the head and neck-memorial Sloan Kettering experience: incidence and outcomes by site and histological type. Cancer. 2019;125:3354–66. - PMC - PubMed

MeSH terms

Substances