. 2024 Dec 25;15(1):23.
doi: 10.3390/ani15010023.

RNA-Seq and ATAC-Seq Reveal CYP26A1-Mediated Regulation of Retinoic Acid-Induced Meiosis in Chicken Primordial Germ Cells

Affiliations

RNA-Seq and ATAC-Seq Reveal CYP26A1-Mediated Regulation of Retinoic Acid-Induced Meiosis in Chicken Primordial Germ Cells

Zhaochuan Wang et al. Animals (Basel). .

Abstract

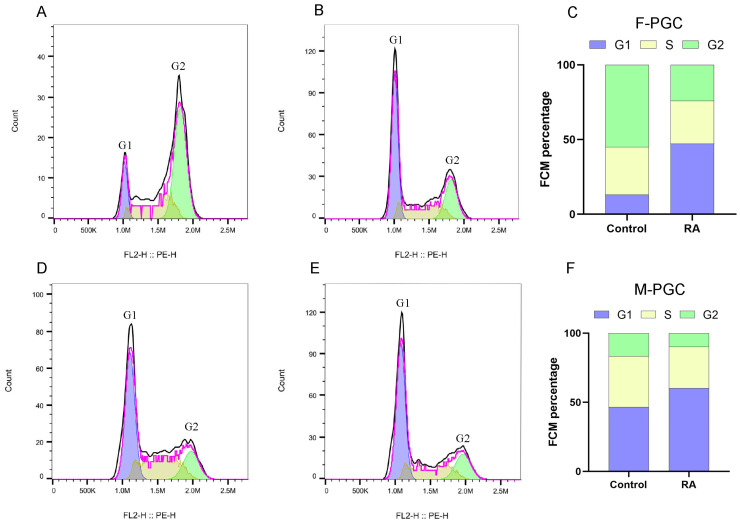
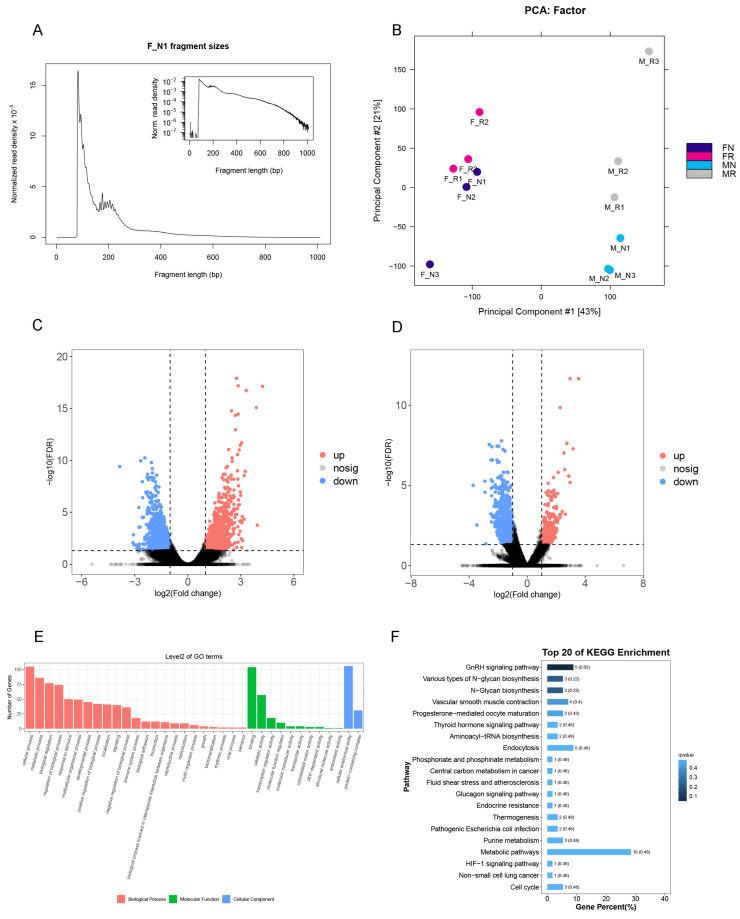
Retinoic acid (RA) plays a critical role in initiating meiosis in primordial germ cells (PGC), yet the specific mechanisms of its interaction with PGC remain unclear. In this study, we used an in vitro feeder-free culture system with chicken PGC as a model to explore the mechanisms by which RA induces the entry of PGC into meiosis. Results demonstrated that exogenous RA treatment altered the cell cycle distribution of PGC, significantly increasing the proportion of cells in the G1 phase and decreasing those in the G2 phase, suggesting that RA may promote the transition of PGC from proliferation to differentiation. Giemsa staining further revealed that chromosomes in a subset of RA-treated PGC exhibited meiotic characteristics. Through combined RNA-seq and ATAC-seq analyses, we identified that CYP26A1, a gene involved in RA degradation, was significantly upregulated in the RA-treated group, with enhanced accessibility in its chromatin regions. This finding suggests a robust mechanism for self-regulation of RA levels within PGC, indicating that CYP26A1 may play a pivotal role in the degradation of exogenous RA in chicken PGC. This study elucidated the effects of RA on chicken PGC and provided new insights into the role of RA in germ cell differentiation.

Keywords: ATAC-seq; RNA-seq; chicken primordial germ cell; meiosis; retinoic acid.


Conflict of interest statement

The authors declare no conflicts of interest.

Figures

Figure 1
Figure 1
Cultivation and identification of male and female primordial germ cells (PGC): (A) Male and female PGC after separation of chicken embryos; (B) Identification of PGC marker genes, where DF-1 cells were used as a control; (C) Photomicrograph of male and female PGC stained for alkaline phosphatase activity; DF-1 cells as a negative control result; (D) Photomicrograph of male and female PGC stained with Periodic Acid-Schiff (PAS) reagent; DF-1 cells as a negative control result; (E) SSEA1, DAPI, and merged plots of male and female PGC; Secondary antibodies were used as control. (F) EMA1, DAPI, and merged plots of male and female PGC; Secondary antibodies were used as control.
Figure 2
Figure 2
Cell cycle analysis of primordial germ cells (PGC). (A) The cell cycle of PGC in the female control group; (B) Cell cycle of PGC in the female RA-treated group; (C) Bar chart of the cell cycle distribution of female PGC; (D) The cell cycle of PGC in the male control group; (E) Cell cycle of PGC in the male RA-treated group; (F) Bar chart of the cell cycle distribution of male PGC.
Figure 3
Figure 3
Giemsa-stained image of primordial germ cells (PGC). (A) Morphology of normal PGC; (B) PGC entering the mitotic state; (C) PGC following mitotic; (D) PGC at the leptotene stage of meiosis; (E) PGC at the zygotene stage of meiosis; (F) PGC following meiosis.
Figure 4
Figure 4
Sample relationship analysis in RNA-seq. (A) Principal component analysis plot between samples; (B) principal component analysis plot between samples; (C) heatmap of DEG in control and RA-treated groups in male; (D) heatmap of DEG in control and RA-treated groups in female.
Figure 5
Figure 5
Analyses of the differentially expressed genes (DEG). (A) Volcano plot of DEG. M1 and F1 represent male and female RA treatment groups; M0 and F0 represent control groups of males and females. The screening threshold for DEG was |log2 FC| ≥ 1 and q value < 0.05; (B) Venn diagram showing intersection of DEG in male and female PGC comparison groups; (C) annotation of GO functions in M1vsM0 group DEG; (D) KEGG pathway enrichment analysis in M1vsM0 group DEG; (E) annotation of GO functions in F1vsF0 group DEG; (F) KEGG pathway enrichment analysis in F1vsF0 group DEG.
Figure 6
Figure 6
Analyses of the ATAC-seq. (A) Fragment length distribution map; (B) Principal component analysis plot. FN and MN are female and male control groups; FR and MR represent female and male RA treatment groups; (C) volcano map showing the different peaks between FN and FR; (D) volcano map showing the different peaks between MN and MR; (E) annotation of GO functions in different peaks between FN and FR; (F) KEGG pathway-enrichment analysis in different peaks between FN and FR.
Figure 7
Figure 7
RNA-seq and ATAC-seq for combined analysis; (A) intersection of different mRNAs and different peaks corresponding to the target genes, F and M represent female and male comparison groups; (B) peak plots showing the relationship between genes in open regions of chromatin and gene expression, where the blue peak is the control group and the red peak is the RA treatment group; (C) validation of RNA-seq data by qRT-PCR. The left axis represents the relative expression levels determined by qRT-PCR and the right axis represents the FPKM values determined by RNA-seq. All data represent the mean of three biological replicates. The error line represents the standard error of the three replicates, and all data were normalized. ** p < 0.01, *** p < 0.001, **** p < 0.001.

Similar articles

References

    1. Ginsburg M., Snow M.H., McLaren A. Primordial Germ Cells of the Young Chick Blastoderm Originate from the Central Zone of the Area Pellucida Irrespective of the Embryo-Forming Process. Development. 1987;101:209–219. doi: 10.1242/dev.101.2.209. - DOI - PubMed
    1. Hamburger V., Hamilton H.L. A Series of Normal Stages in the Development of the Chick Embryo. J. Morphol. 1951;88:49–92. doi: 10.1002/jmor.1050880104. - DOI - PubMed
    1. Nakamura Y., Yamamoto Y., Usui F., Mushika T., Ono T., Setioko A.R., Takeda K., Nirasawa K., Kagami H., Tagami T. Migration and Proliferation of Primordial Germ Cells in the Early Chicken Embryo. Poult. Sci. 2007;86:2182–2193. doi: 10.1093/ps/86.10.2182. - DOI - PubMed
    1. Tsunekawa N., Naito M., Sakai Y., Nishida T., Noce T. Isolation of Chicken Vasa Homolog Gene and Tracing the Origin of Primordial Germ Cells. Development. 2000;127:2741–2750. doi: 10.1242/dev.127.12.2741. - DOI - PubMed
    1. Bowles J., Knight D., Smith C., Wilhelm D., Richman J., Mamiya S., Yashiro K., Chawengsaksophak K., Wilson M.J., Rossant J., et al. Retinoid Signaling Determines Germ Cell Fate in Mice. Science. 2006;312:596–600. doi: 10.1126/science.1125691. - DOI - PubMed

LinkOut - more resources