

Comparative Metagenomic Analysis of the Gut Microbiota of Captive Pangolins: A Case Study of Two Species
- PMID: 39795000
- PMCID: PMC11718824
- DOI: 10.3390/ani15010057
Comparative Metagenomic Analysis of the Gut Microbiota of Captive Pangolins: A Case Study of Two Species
Abstract
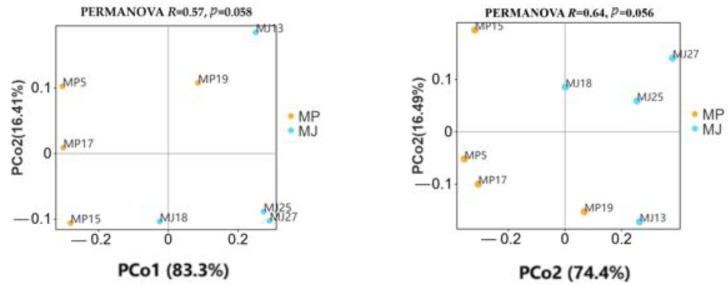
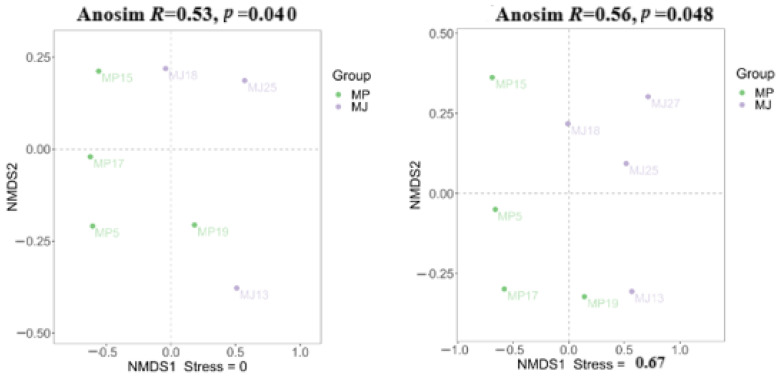
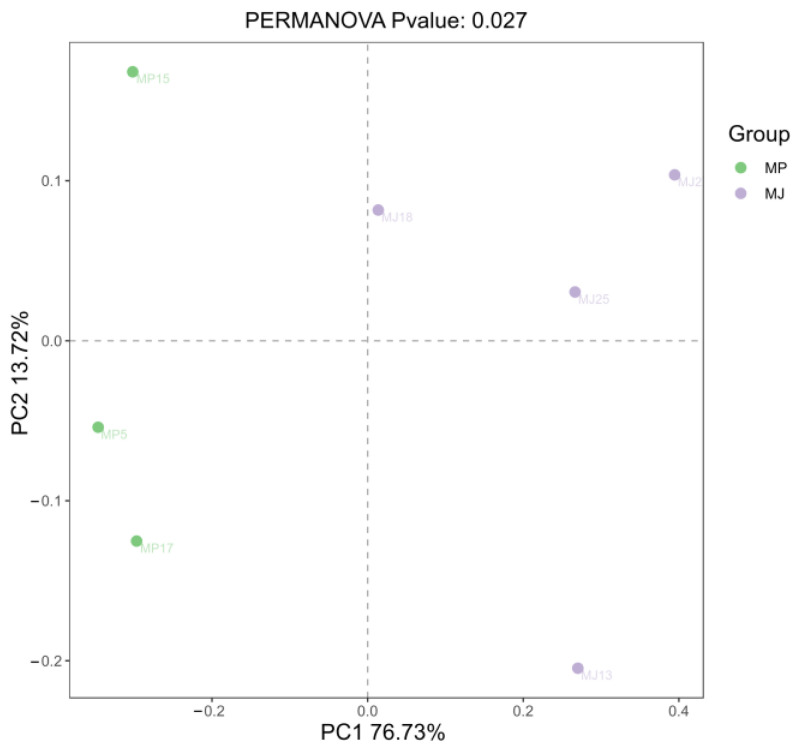
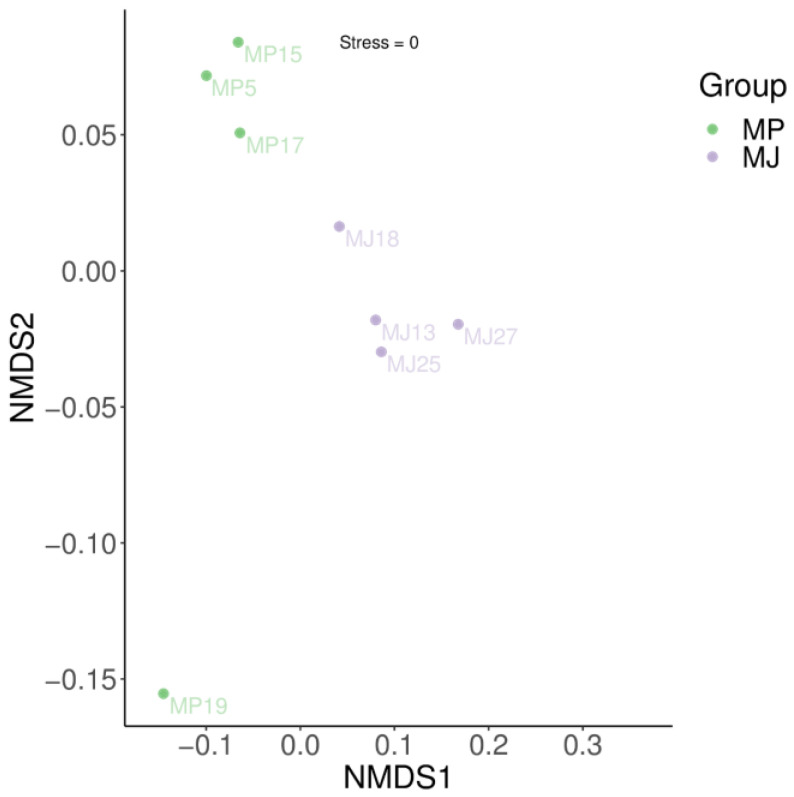
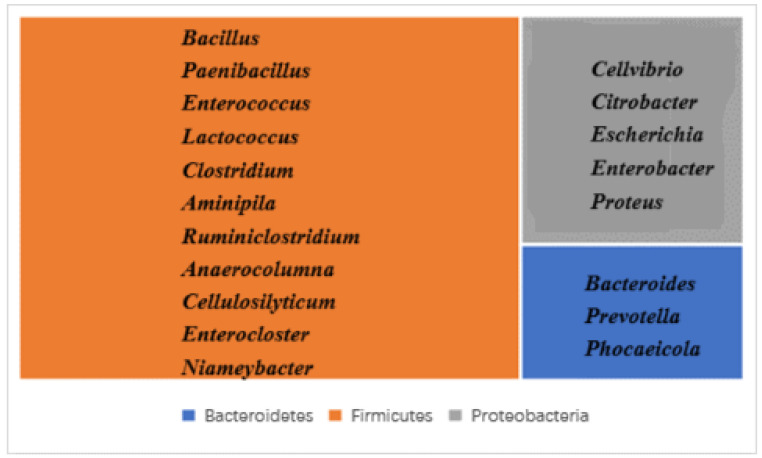
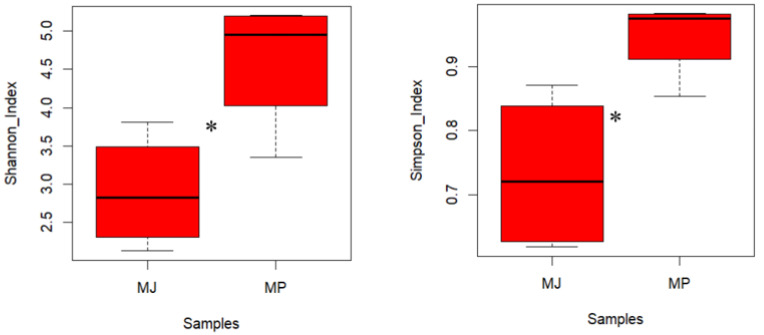
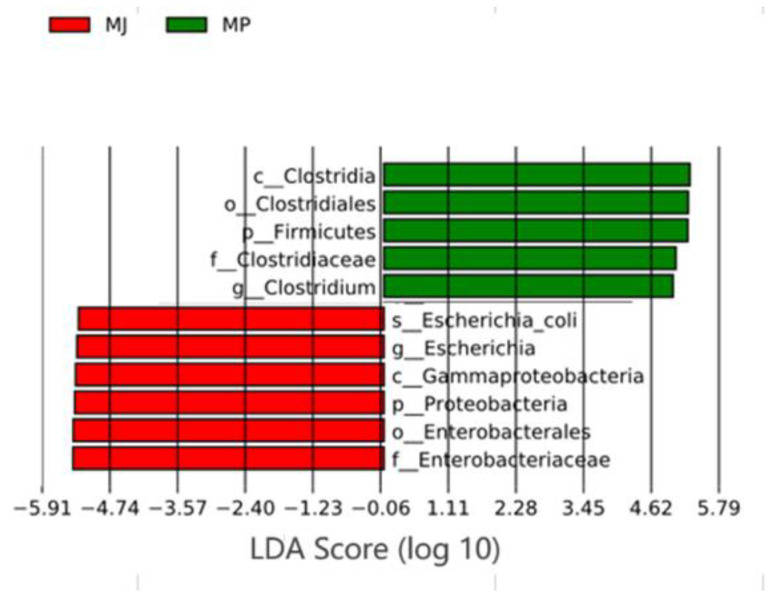
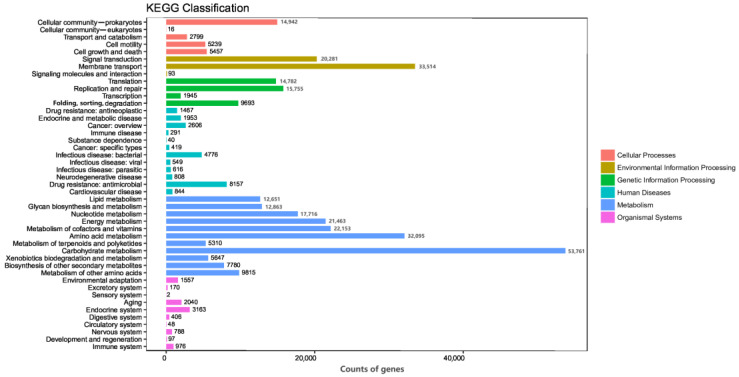
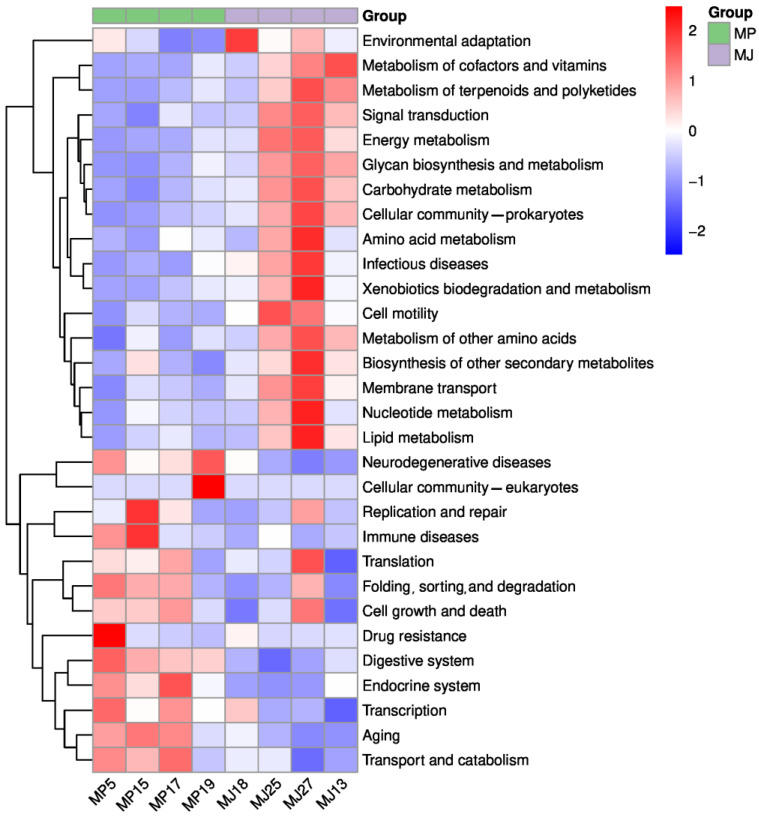
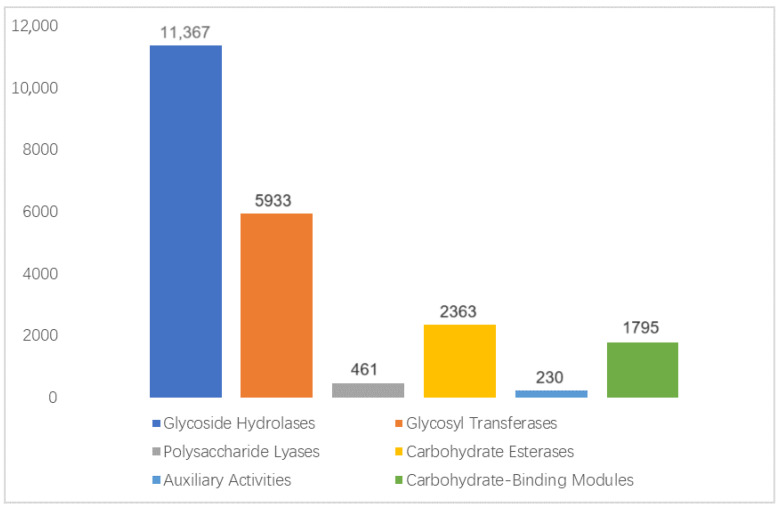
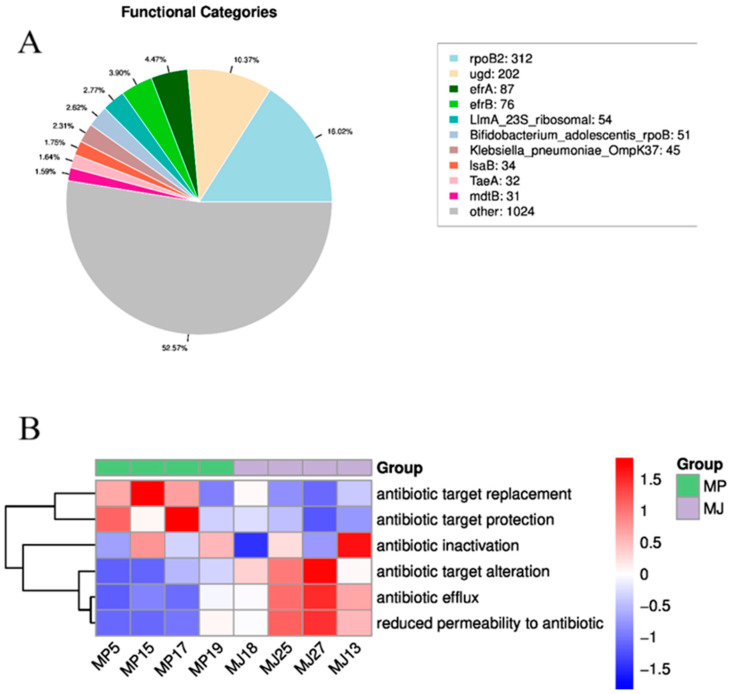
Pangolins, one of the most trafficked mammals, face significant health challenges in captivity, including digestive disorders and immune dysfunctions. These issues are closely linked to alterations in their gut microbiota, which play vital roles in the host metabolism, immunity, and overall health. This study investigated the differences in the gut microbiota composition and function between two pangolin species, Chinese pangolins (Manis pentadactyla) and Malayan pangolins (Manis javanica), under identical captive conditions to better understand their ecological adaptability and health implications. Using metagenomic sequencing, fecal samples from eight adult captive pangolins were analyzed, including four male Malayan pangolins and three male and one female Chinese pangolins. Comparative analyses of the alpha and beta diversities, microbial community structure, and functional profiles were performed. Both species harbored gut microbiota dominated by Firmicutes, Bacteroidetes, and Proteobacteria. However, the Chinese pangolins exhibited higher microbial diversity (Shannon index, p = 0.042; Simpson index, p = 0.037) and lower relative abundance of Proteobacteria compared with the Malayan pangolins. A functional analysis revealed significant differences in the metabolic pathways, where the Chinese pangolins demonstrated a higher potential for fiber degradation, whereas the Malayan pangolins exhibited elevated levels of antibiotic resistance genes and pathogenic taxa, such as Escherichia coli. These findings suggest that captivity duration and environmental stress likely contribute to the observed differences, with the Malayan pangolins experiencing greater dysbiosis due to longer captivity periods. This study provides valuable insights into the role of gut microbiota in pangolin health and offers a foundation for improving conservation strategies and captive care protocols.
Keywords: Manis javanica; Manis pentadactyla; gut microbiota; metabolic pathways; metagenomics.
Conflict of interest statement
The authors declare no conflicts of interest.
Figures
Similar articles
-
Comparative analysis of gut microbiota and metabolome in captive Chinese and Malayan pangolins.Front Microbiol. 2025 Jun 18;16:1599588. doi: 10.3389/fmicb.2025.1599588. eCollection 2025. Front Microbiol. 2025. PMID: 40606159 Free PMC article.
-
Differences in gut microbes in captive pangolins and the effects of captive breeding.Front Microbiol. 2022 Dec 6;13:1053925. doi: 10.3389/fmicb.2022.1053925. eCollection 2022. Front Microbiol. 2022. PMID: 36560954 Free PMC article.
-
Effects of Chronic Stress on the Fecal Microbiome of Malayan Pangolins (Manis javanica) Rescued from the Illegal Wildlife Trade.Curr Microbiol. 2021 Mar;78(3):1017-1025. doi: 10.1007/s00284-021-02357-4. Epub 2021 Feb 3. Curr Microbiol. 2021. PMID: 33537884
-
[Allometry of scales in Chinese pangolins (Manis pentadactyla) and Malayan pangolins (Manis javanica) and application in judicial expertise].Dongwuxue Yanjiu. 2012 Jun;33(3):271-5. doi: 10.3724/SP.J.1141.2012.03271. Dongwuxue Yanjiu. 2012. PMID: 22653854 Chinese.
-
To Save Pangolins: A Nutritional Perspective.Animals (Basel). 2022 Nov 14;12(22):3137. doi: 10.3390/ani12223137. Animals (Basel). 2022. PMID: 36428365 Free PMC article. Review.
Cited by
-
FACdb: a comprehensive resource for genes, gut microbiota, and metabolites in farm animals.Front Microbiol. 2025 Mar 21;16:1557285. doi: 10.3389/fmicb.2025.1557285. eCollection 2025. Front Microbiol. 2025. PMID: 40190740 Free PMC article.
-
Comparative analysis of gut microbiota and metabolome in captive Chinese and Malayan pangolins.Front Microbiol. 2025 Jun 18;16:1599588. doi: 10.3389/fmicb.2025.1599588. eCollection 2025. Front Microbiol. 2025. PMID: 40606159 Free PMC article.
References
-
- Challender D.W.S., Harrop S.R., MacMillan D.C. Understanding Markets to Conserve Trade-Threatened Species in CITES. Biol. Conserv. 2015;187:249–259. doi: 10.1016/j.biocon.2015.04.015. - DOI
-
- Challender D.W.S., Helen C.N., Carly W. Pangolins: Science, Society and Conservation. Academic Press; New York, NY, USA: 2019.
Grants and funding
LinkOut - more resources
Full Text Sources
