. 2024 Dec 29;14(1):73.
doi: 10.3390/plants14010073.

The Geometric Series Hypothesis of Leaf Area Distribution and Its Link to the Calculation of the Total Leaf Area per Shoot of Sasaella kongosanensis 'Aureostriatus'

Affiliations

The Geometric Series Hypothesis of Leaf Area Distribution and Its Link to the Calculation of the Total Leaf Area per Shoot of Sasaella kongosanensis 'Aureostriatus'

Yong Meng et al. Plants (Basel). .

Abstract

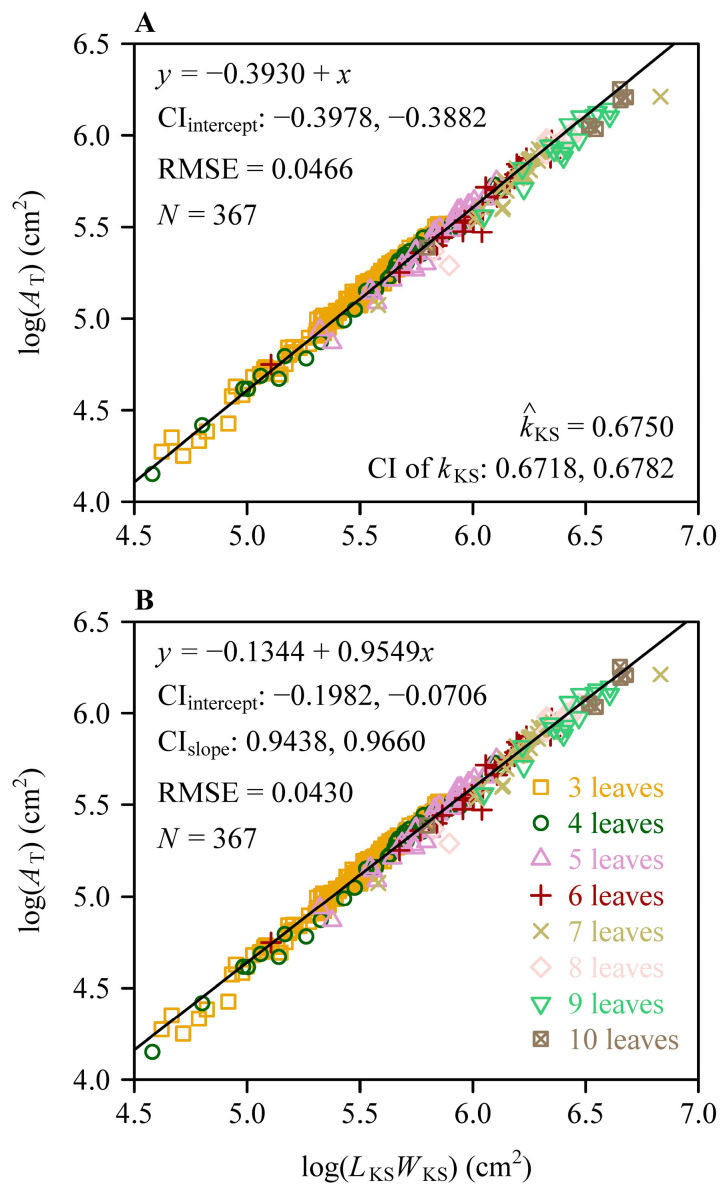
Total leaf area per shoot (AT) can reflect the photosynthetic capacity of a shoot. A prior study hypothesized that AT is proportional to the product of the sum of the individual leaf widths per shoot (LKS) and the maximum individual leaf length per shoot (WKS), referred to as the Montgomery-Koyama-Smith equation (MKSE). However, empirical evidence does not support such a proportional relationship hypothesis, as AT was found to allometrically scale with LKSWKS, i.e., AT∝LKSWKSα, where α≠1, referred to as the power law equation (PLE). Given that there is variation in the total number of leaves per shoot (n), little is known about whether the leaf area distribution has an explicit mathematical link with the sorted leaf area sequence per shoot, and it is unknown whether the mathematical link can affect the prediction accuracy of the MKSE and PLE. In the present study, the leaves of 500 shoots of a dwarf bamboo (Sasaella kongosanensis 'Aureostriatus') were scanned, and the leaf area, length, and width values were obtained by digitizing the leaf images. We selected the shoots with n ranging from 3 to 10, which accounted for 76.6% of the totally sampled shoots (388 out of 500 shoots). We used the formula for the sum of the first j terms (j ranging from 1 to n) of a geometric series (GS), with the mean of the quotients of any adjacent two terms (denoted as q¯A) per shoot as the common ratio of the GS, to fit the cumulative leaf area observations. Mean absolute percentage error (MAPE) was used to measure the goodness of fit of the GS. We found that there were 367 out of 388 shoots (94.6%) where 1 < q¯A < 1.618 and MAPE < 15%, and these 367 shoots were defined as valid samples. The GS hypothesis for leaf area distribution was supported by the result that the MAPE values for most valid samples (349 out of 367, i.e., 95.1%) were smaller than 5%. Here, we provide a theoretical basis using the GS hypothesis to demonstrate the validity of the MKSE and PLE. The MAPE values for the two equations to predict AT were smaller than 5%. This work demonstrates that the leaf area sequence per shoot follows a GS and provides a useful tool for the calculation of total leaf area per shoot, which is helpful to assess the photosynthetic capacity of plants.

Keywords: Montgomery equation; Sasaella kongosanensis ‘Aureostriatus’; allometric relationship; common ratio; proportional relationship; root-mean-square error.


Conflict of interest statement

The authors declare no conflicts of interest.

Figures

Figure 1
Figure 1
The Montgomery equation (ME) and the Montgomery–Koyama–Smith equation (MKSE) illustrated by leaves of a Sasaella kongosanensis ‘Aureostriatus’ shoot. The ME assumes that individual leaf area (A) is proportional to the product of individual leaf length (L) and width (W); the MKSE assumes that the total leaf area per shoot (AT) is proportional to the product of the sum of leaf widths per shoot (LKS) and the maximum leaf length per shoot (WKS). There are three leaves in the shoot example, i.e., n = 3.
Figure 2
Figure 2
Comparison between gn (red curve) and hn (blue 45° straight line). The distribution of the leaf length sequence of a shoot is assumed to follow a geometric series with the common ratio q = 1.15; a represents the scaling exponent of individual leaf width vs. individual leaf length; the numerical value of n ranges from 1 to 10, and the corresponding gn and hn values are the endpoints of the vertical segments from the left to the right. It is apparent that gn/hn<1 is a decreasing function of n.
Figure 3
Figure 3
Comparison of the mean common ratios among the eight Sasaella kongosanensis ‘Aureostriatus’ shoot groups, and the correlation between the mean of the mean common ratios for each shoot group (y) and the number of leaves per shoot (x). Here, the horizontal solid lines in each box represent the medians; the asterisks near the medians represent the means; the whiskers extend to the most extreme data point, which is no more than 1.5 times the interquartile range from the box; the blue straight line is the regression line for the mean of the mean common ratios of each shoot group vs. the number of leaves per shoot. The p-value is for Pearson’s product moment correlation coefficient between x and y.
Figure 4
Figure 4
Fitted results of the geometric series to the observed cumulative leaf area sequences of eight shoot examples corresponding to the eight Sasaella kongosanensis ‘Aureostriatus’ shoot groups ranging from 3 to 10 (see Table 1 for details). Panels (AH) represent different shoot groups. In each panel, q¯A represents the mean common ratio of the leaf area geometric series for each shoot; MAPE is the mean absolute percentage error between the observed and predicted cumulative leaf area sequences for each shoot; n is the number of leaves for each shoot.
Figure 5
Figure 5
Fitted results for the proportional relationship between leaf area and the product of leaf length and leaf width (A), and the scaling relationship between leaf width and leaf length on a log-log scale for Sasaella kongosanensis ‘Aureostriatus’ (B). The open circles represent the observations, and the straight lines represent the regression lines; different colors represent different shoots; N represents the number of shoots; and Nall represents the total number of leaves for the 367 shoots.
Figure 6
Figure 6
Results of fitting the Montgomery–Koyama–Smith equation (A) and the power law equation (B) between the total leaf area per shoot (AT) and the product of the sum of leaf widths and the maximum leaf length per shoot (LKSWKS) on a log-log scale for the eight Sasaella kongosanensis ‘Aureostriatus’ shoot groups with 3 to 10 leaves per shoot. Different symbols are the observations of different shoot groups converted on a log-log scale; CIintercept is the 95% confidence interval of the intercept; CIslope is the 95% confidence interval of the slope; RMSE is the root-mean-square error of the linear fitting; and N is the total number of shoots of the eight shoot groups. In panel (A), k^KS represents the estimated value of the proportionality coefficient of the MKSE, and CI of kKS represents the 95% confidence interval of the proportionality coefficient of the MKSE.

References

    1. Poorter H., Niinemets Ü., Poorter L., Wright I.J., Villar R. Causes and consequences of variation in leaf mass per area (LMA): A meta-analysis. N. Phytol. 2009;182:565–588. doi: 10.1111/j.1469-8137.2009.02830.x. - DOI - PubMed
    1. De la Riva E.G., Olmo M., Poorter H., Ubera J.L., Villar R. Leaf mass per area (LMA) and its relationship with leaf structure and anatomy in 34 Mediterranean woody species along a water availability gradient. PLoS ONE. 2016;11:e0148788. doi: 10.1371/journal.pone.0148788. - DOI - PMC - PubMed
    1. Shi P., Deng L., Miao Q., Chen L., Yu H., Zhu F., Niklas K.J. Scaling relationships of lamina mass per unit area, mean thickness, and leaf bulk tissue density across nine diverse species. Am. J. Bot. 2024;111:e16442. doi: 10.1002/ajb2.16442. - DOI - PubMed
    1. Smith D.D., Sperry J.S., Adler F.R. Convergence in leaf size versus twig leaf area scaling: Do plants optimize leaf area partitioning? Ann. Bot. 2017;119:447–456. doi: 10.1093/aob/mcw231. - DOI - PMC - PubMed
    1. Koyama K., Smith D.D. Scaling the leaf length-times-width equation to predict total leaf area of shoots. Ann. Bot. 2022;130:215–230. doi: 10.1093/aob/mcac043. - DOI - PMC - PubMed

LinkOut - more resources