. 2024 Dec 24;26(1):1.
doi: 10.3390/ijms26010001.

Adropin/Tirzepatide Combination Mitigates Cardiac Metabolic Aberrations in a Rat Model of Polycystic Ovarian Syndrome, Implicating the Role of the AKT/GSK3β/NF-κB/NLRP3 Pathway

Affiliations

Adropin/Tirzepatide Combination Mitigates Cardiac Metabolic Aberrations in a Rat Model of Polycystic Ovarian Syndrome, Implicating the Role of the AKT/GSK3β/NF-κB/NLRP3 Pathway

Islam Ibrahim Hegab et al. Int J Mol Sci. .

Abstract

Polycystic ovarian syndrome (PCOS) is a multifaceted metabolic and hormonal disorder in females of reproductive age, frequently associated with cardiac disturbances. This research aimed to explore the protective potential of adropin and/or tirzepatide (Tirze) on cardiometabolic aberrations in the letrozole-induced PCOS model. Female Wistar non-pregnant rats were allotted into five groups: CON; PCOS; PCOS + adropin; PCOS + Tirze; and PCOS + adropin+ Tirze. The serum sex hormones, glucose, and lipid profiles were securitized. Cardiac phosphorylated levels of AKT(pAKT), glycogen synthase kinase-3 beta (pGSK-3β), NOD-like receptor family pyrin domain containing 3 (NLPR3), IL-1β and IL-18 were assayed. The cardiac redox status and endoplasmic reticulum stress (ER) parameters including relative glucose-regulated protein 78 (GRP78) and C/EBP homologous protein (CHOP) gene expressions were detected. Finally, the immunoreactivity of cardiac NF-κB, Bcl2, and BAX were assessed. Our results displayed that adropin and/or Tirze intervention successfully alleviated the PCOS-provoked cardiometabolic derangements with better results recorded for the combination treatment. The synergistic effect of adropin and Tirze is mostly mediated via activating the cardiac Akt, which dampens the GSK3β/NF-κB/NLRP3 signaling pathway, with a sequel of alleviating oxidative damage, inflammatory response, ER stress, and related apoptosis, making them alluring desirable therapeutic targets in PCOS-associated cardiac complications.

Keywords: adropin; apoptosis; cardiovascular; inflammation; polycystic ovarian syndrome; tirzepatide.


Conflict of interest statement

The authors declare no conflicts of interest.

Figures
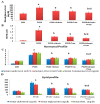
Figure 1
Figure 1
Impact of adropin and/or Tirze on blood glucose, serum insulin, HOMA/IR, and both hormonal and lipid profiles. (A) Blood glucose level (mg/dL), (B) HOMA-IR, (C) Hormonal profile and (D) Lipid profile. Data are represented as mean ± standard deviation. Statistical analysis was performed using one-way ANOVA with Tukey’s post hoc test, SPSS computer program. CON: control; Trize: tirzepatide; HOMA/IR: homeostasis model assessment of insulin resistance; LH: luteinizing hormone; HDL: High-density lipoprotein. a Significance versus CON group (p < 0.05), b Significance versus PCOS group (p < 0.05), c Significance versus PCOS + adropin group (p < 0.05) and d Significance versus PCOS + Tirze group (p < 0.05). n = 6 rats/each group.
Figure 2
Figure 2
Impact of adropin and/or Tirze on cardiac levels of p-AKT, p-GSK-3β, IL-1β, and IL-18 and relative NLRP3 expression. (A); Cardiac AKT level (ng/mg protein), (B): Cardiac p-GSK-3β (pg/mg protein), (C): Cardiac relative NLRP3 expression and (D) Cardiac IL-1β and IL-18 levels (pg/mg protein). Data are represented as mean ± standard deviation. Statistical analysis was performed using one-way ANOVA with Tukey’s post hoc test, SPSS computer program. CON: control; Trize:tirzepatide; p-AKT: phosphorylated protein kinase B; p-GSK-3β: phosphorylated glycogen synthase kinase-3β; NLRP3: NOD-like receptor family pyrin domain containing 3; IL-1β: interleukin-1β; IL-18: interleukin-18. a Significance versus CON group (p < 0.05), b Significance versus PCOS group (p < 0.05), c Significance versus PCOS + adropin group (p < 0.05) and d Significance versus PCOS + Tirze group (p < 0.05). n = 6 rats/each group.
Figure 3
Figure 3
Impact of adropin and/or Tirze on cardiac TAC, MDA, and nitrite. (A) Cardia TAC (nmol/mg protein), (B) Cardiac MDA level (nmol/g tissue) and (C) Cardiac nitrite level (nmol/g tissue). Data are represented as mean ± standard deviation. Statistical analysis was performed using one-way ANOVA with Tukey’s post hoc test, SPSS computer program. CON: control; Trize: tirzepatide; TAC: total antioxidant capacity; MDA: Malondialdehyde. a Significance versus CON group (p < 0.05), b Significance versus PCOS group (p < 0.05), c Significance versus PCOS + adropin group (p < 0.05), and d Significance versus PCOS + Tirze group (p < 0.05). n = 6 rats/each group.
Figure 4
Figure 4
Impact of adropin and/or Tirze on cardiac levels of GRP78, CHOP, and cleaved caspase-3 and relative expression of GRP78 and CHOP. (A) Cardiac GRP78 level (μg/mg protein), (B) Cardiac CHOP level (pg/mg protein), (C) Cardiac relative GRP78 & CHOP expression and (D) Cardiac cleaved caspase-3 level (U/mg protein)Data are represented as mean ± standard deviation. Statistical analysis was performed using one-way ANOVA with Tukey’s post hoc test, SPSS computer program. CON: control; Trize: tirzepatide; GRP78: glucose-regulated protein 78; CHOP: C/EBP homologous protein. a Significance versus CON group (p < 0.05), b Significance versus PCOS group (p < 0.05), c Significance versus PCOS + adropin group (p < 0.05) and d Significance versus PCOS + Tirze group (p < 0.05). n = 6 rats/each group.
Figure 5
Figure 5
Sections of ovaries stained with H&E. (A) CON Group displaying normal ovarian architecture. The cortex reveals multiple primary follicles (PF), secondary follicles (SF), antral follicles (AF), Graafian follicles (GF), and average-sized corpora lutea (CL). Small blood vessels (BV) could be seen in the ovarian medium. (B) PCOS group showing multiple cystic follicles (CF), few growing follicles (arrows), one corpus luteum (CL), atretic follicles (AT), and degenerated follicles (DF). Hemorrhage (Hg) is seen between the follicles. (C) The PCOS + Adropin group showing a few cystic follicles (CF), many growing follicles (arrows), and corpora lutea (CL). However, degenerated follicles (DF) and hemorrhage (Hg) are noticeable. (D) PCOS + Tirze Group demonstrating an increased number of corpora lutea (CL), developing follicles (arrows), and fewer cystic follicles (CF). However, hemorrhage (Hg) and degeneration follicles (DF) are detected. (E) PCOS + Adropin + Tirze Group has several mature Graafian follicles (GF), developing follicles (arrows), and corpora lutea (CL). There are very few cystic (CF) and atretic follicles (AF). [Magnification ×40 scale bar = 500 µm]. (F) A column graph showing the mean number of growing follicles in the studied groups. a Significance versus CON group (p < 0.05), b Significance versus PCOS group (p < 0.05), c Significance versus PCOS + adropin group (p < 0.05) and d Significance versus PCOS + Tirze group (p < 0.05). n = 6 rats/each group.
Figure 6
Figure 6
At a higher magnification. (A) CON Group showing a mature Graafian follicle (GF) with an oocyte (O) surrounded by a thick granulosa layer (star) and thin theca cell layer (arrow). Several secondary follicles (SF) and corpora lutea (CL) could be seen. (B) PCOS Group showing multiple cystic follicles (CF) that are lined by a thin granulosa layer (star) and a thick theca cell layer (arrows). Intraluminal desquamated granulosa cells (dotted arrow), degenerated corpus luteum (DF), and hemorrhage (Hg) between follicles are detected. (C) PCOS + Adropin Group depicting one cystic follicle (CF) with detached granulosa cells (dotted arrows) inside its lumen and bordered by theca (arrow) and partially thick granulosa (star) cell layers. Congested blood vessels (BV) and atretic follicles (AF) are notable. (D) PCOS + Tirze Group showing multiple corpora lutea (CL), secondary follicles (SF), and one cystic follicle (CF) surrounded by thick granulosa cell (star) and thick theca cell (arrow) layers. Congested blood vessels (BV) and atretic follicles (AF) could be seen. (E) PCOS + Adropin + Tirze Group showing multiple corpora lutea (CL) mature Graafian follicles (GF) bordered with an outside thin theca cell layer (arrow) and an inner thick granulosa cell layer (star). Yet, few degenerated follicles (DF) and mild congested blood vessels (BV) are still present. [Magnification ×100 scale bar = 200 µm]. (F) A column graph showing the mean thickness of the granulosa and theca cell layer in the studied groups. a Significance versus CON group (p < 0.05), b Significance versus PCOS group (p < 0.05), c Significance versus PCOS + adropin group (p < 0.05) and d Significance versus PCOS + Tirze group (p < 0.05). n = 6 rats/each group.
Figure 7
Figure 7
Sections of hearts stained with H&E. (A) CON group displaying longitudinally striated branching cardiomyocytes (arrows) with central oval vesicular nuclei (N) and acidophilic sarcoplasm as well as central oval vesicular nuclei (N). Blood capillaries (BV) and intercalated discs (dashed arrows) could be seen. (B) The PCOS group displaying disruption of some cardiac muscle fibers (thick arrows) that are widely separated from each other (stars). While some nuclei are pyknotic (yellow arrows), others are karyolitic (thin arrows). Many sarcoplasmic vacuolations (V). The blood vessels were dilated and congested (BV), and inflammatory cells (IN) were detected. (C) PCOS + Adropin group (thick arrow) demonstrating some atrophic and degraded fibers. In particular, the perivascular region exhibits cellular infiltration (IN) and congested blood vessels (BV). Observe the areas of localized sarcoplasmic vacuolations (V) and the karyolitic (thin arrow) and pyknotic (yellow arrow) nuclei. (D) PCOS + Tirze group demonstrating apparent normal cardiac muscles (thick arrows). Nevertheless, localized areas of sarcoplasmic vacuolations (V), slight congestion of blood vessels (BV), and a small number of mononuclear inflammatory cells (IN) are still observed. (E) PCOS + Adropin + Tirze Group displaying the maintenance of the heart muscles’ typical architecture, with almost regular cardiomyocytes (arrow) and an oval vesicular nucleus (N). [Magnification: 50 µm = ×400 scale bar]. (F) A column graph showing the mean diameter of cardiomyocytes in the studied groups. a Significance versus CON group (p < 0.05), b Significance versus PCOS group (p < 0.05), c Significance versus PCOS + adropin group (p < 0.05) and d Significance versus PCOS + Tirze group (p < 0.05). n = 6 rats/each group.
Figure 8
Figure 8
NF-κB immunohistochemical stained myocardial sections from the studied groups. (A) CON Group demonstrating a small number of cardiomyocytes with a moderately positive nuclear NF-κB immunoexpression (arrows). (B) PCOS Group showing that a large number of cardiomyocytes had nuclei with strong NF-κB nuclear immunoexpression (arrows). (C) PCOS + Adropin Group: has few cardiomyocytes with strong positive NF-κB immunoexpression (arrows). (D) PCOS + Tirze Group: had some cardiomyocytes with moderately positive NF-κB nuclear immunoexpression (arrows). (E) PCOS + Adropin + Tirze group depicting a small number of cardiomyocytes with moderately positive NF-κB nuclear immunoexpression (arrows). [Magnification: 50 µm = ×400 scale bar]. The intensity of the NF-κB nuclear immunoexpression is shown in higher magnification in the insert. (F) A column graph showing the mean color intensity of NF-κB immunostaining and its cardiac levels in the studied groups.a Significance versus CON group (p < 0.05), b Significance versus PCOS group (p < 0.05), c Significance versus PCOS + adropin group (p < 0.05) and d Significance versus PCOS + Tirze group (p < 0.05). n = 6 rats/each group.
Figure 9
Figure 9
Bcl2 immunohistochemical stained myocardial sections. (A) CON Group displaying several cardiomyocytes with significant positive Bcl2 cytoplasmic immunoexpression (arrows). (B) PCOS group displaying cardiomyocytes with slightly positive Bcl2 cytoplasmic immunoexpression (arrows). (C) PCOS + Adropin Group depicting some cardiomyocytes with faint Bcl2 positive cytoplasmic immunoexpression (arrows). (D) PCOS + Tirze group demonstrating some cardiomyocytes with moderately Bcl2 positive cytoplasmic immunoexpression (arrows). (E) PCOS + Adropin + Tirze Group revealing several cardiomyocytes with moderately positive cytoplasmic Bcl2 immunoexpression (arrows). [Magnification: 50 µm = ×400 scale bar]. The intensity of the Bcl2 immunoexpression is shown at higher magnification in the insert. (F) A column graph showing the mean area percentage of Bcl2 immunostaining and its cardiac levels in the studied groups. a Significance versus CON group (p < 0.05), b Significance versus PCOS group (p < 0.05), c Significance versus PCOS + adropin group (p < 0.05) and d Significance versus PCOS + Tirze group (p < 0.05). n = 6 rats/each group.
Figure 10
Figure 10
Bax immunostaining. (A) CON group: has a small number of cardiomyocytes with faint positive cytoplasmic Bax immunoexpression (arrows). (B) PCOS Group showing many cardiomyocytes with strongly positive Bax cytoplasmic immunoexpression (arrows). (C) PCOS + Adropin Group illustrating some cardiomyocytes with a somewhat strong Bax cytoplasmic immunoexpression (arrows). (D) PCOS + Tirze Group showing few cardiomyocytes with moderately positive Bax cytoplasmic immunoexpression (arrows). (E) PCOS + Adropin + Tirze Group displaying cardiomyocytes with weak positive Bax cytoplasmic immunoreaction (arrows). [Magnification: 50 µm = ×400 scale bar]. The intensity of the Bax immunoexpression is shown at higher magnification in the insert. (F) A column graph showing the mean area percentage of Bax immunostaining and its cardiac levels in the studied groups. a Significance versus CON group (p < 0.05), b Significance versus PCOS group (p < 0.05), c Significance versus PCOS + adropin group (p < 0.05) and d Significance versus PCOS + Tirze group (p < 0.05). n = 6 rats/each group.
Figure 11
Figure 11
Electron micrographs of rat myocardium. (A) CON Group displaying a solitary euchromatic nucleus in a cardiomyocyte (N). Typical transverse myofibril striations consisting of dark (A) and light (I) bands divided by Z lines. Sarcomeres (S) are visible in the space between two consecutive Z-lines. Rows of mitochondria are located between the myofibrils and in the perinuclear region and, (M). (B) PCOS Group displaying a cardiomyocyte with a bizarre indented nucleus (N). Sarcomeres (S) lack their regular orientation. Swollen irregularly arranged mitochondria (M) as well as focal sarcoplasmic and perinuclear vacuolations (V) are noticeable. (C) The PCOS + Adropin group depicts a small nucleus in a cardiomyocyte (N) and regular transverse myofibril striations (thin arrows). However, focal lysis of cardiac myofibrils (thick arrow), few ruptured mitochondria (M), and focal sarcoplasmic vacuoles (V) are seen. (D) PCOS + Tirze Group demonstrates a euchromatic nucleus in cardiomyocyte (N) and focal lysis of cardiac myofibrils (thick arrows). (E) PCOS + Adropin + Tirze Group displays a cardiomyocyte with what seems to be regular transverse striations (thin arrows) and a sizable solitary euchromatic nucleus (N). Nevertheless, few myofibrils still depict focal areas of destruction (thick arrows). [Magnifications ×2500 scale bar =2 µm].
Figure 12
Figure 12
At a higher magnification. (A) CON group presentation step-like appearance of the three components of the intercalated discs, namely the desmosomes (thick arrow), fascia adherents (dashed arrow), and gap junction (double arrows), in between the myofibrils. (B) PCOS Group showing markedly interrupted and disfigured intercalated discs (arrows). (C) PCOS + Adropin group depicting step-like intercalated discs (arrows) with areas of dilatations (thick arrows). (D) PCOS + Tirze Group revealing step-like intercalated discs (arrows) with areas of interruption (thick arrows). (E) PCOS + Adropin + Tirze Group showing a normal step-like appearance of the three components of the intercalated discs (arrows). [Magnifications ×6000 scale bar = 1 µm].

References

    1. Gao L., Zhao Y., Wu H., Lin X., Guo F., Li J., Long Y., Zhou B., She J., Zhang C., et al. Polycystic Ovary Syndrome Fuels Cardiovascular Inflammation and Aggravates Ischemic Cardiac Injury. Circulation. 2023;148:1958–1973. doi: 10.1161/CIRCULATIONAHA.123.065827. - DOI - PMC - PubMed
    1. Mousa M., Al-Jefout M., Alsafar H., Kirtley S., Lindgren C.M., Missmer S.A., Becker C.M., Zondervan K.T., Rahmioglu N. Prevalence of common gynecological conditions in the middle east: Systematic review and meta-analysis. Front. Reprod. Health. 2021;3:661360. doi: 10.3389/frph.2021.661360. - DOI - PMC - PubMed
    1. Kauffman A.S., Thackray V.G., Ryan G.E., Tolson K.P., Glidewell-Kenney C.A., Semaan S.J., Poling M.C., Iwata N., Breen K.M., Duleba A.J., et al. A Novel Letrozole Model Recapitulates Both the Reproductive and Metabolic Phenotypes of Polycystic Ovary Syndrome in Female Mice. Biol. Reprod. 2015;93:69. doi: 10.1095/biolreprod.115.131631. - DOI - PMC - PubMed
    1. Ollila M.-M., Arffman R.K., Korhonen E., Morin-Papunen L., Franks S., Junttila J., Piltonen T.T. Women with PCOS have an increased risk for cardiovascular disease regardless of diagnostic criteria—A prospective population-based cohort study. Eur. J. Endocrinol. 2023;189:96–105. doi: 10.1093/ejendo/lvad077. - DOI - PubMed
    1. Zore T., Joshi N.V., Lizneva D., Azziz R. Polycystic Ovarian Syndrome: Long-Term Health Consequences. Semin. Reprod. Med. 2017;35:271–281. doi: 10.1055/s-0037-1603096. - DOI - PubMed

MeSH terms