Comparative Study
. 2024 Dec 24;26(1):39.
doi: 10.3390/ijms26010039.

Compare Analysis of Codon Usage Bias of Nuclear Genome in Eight Sapindaceae Species

Affiliations
Comparative Study

Compare Analysis of Codon Usage Bias of Nuclear Genome in Eight Sapindaceae Species

Yuxuan Song et al. Int J Mol Sci. .

Abstract

Codon usage bias (CUB) refers to the different frequencies with which various codons are utilized within a genome. Examining CUB is essential for understanding genome structure, function, and evolution. However, little was known about codon usage patterns and the factors influencing the nuclear genomes of eight ecologically significant Sapindaceae species widely utilized for food and medicine. In this study, an analysis of nucleotide composition revealed a higher A/T content and showed a preference for A/T at the third codon position in the eight species of Sapindaceae. A correspondence analysis of relative synonymous codon usage explained only part of the variation, suggesting that not only natural selection but also various other factors contribute to selective constraints on codon bias in the nuclear genomes of the eight Sapindaceae species. Additionally, ENC-GC3 plot, PR2-Bias, and neutrality plot analyses indicated that natural selection exerted a greater influence than mutation pressure across these eight species. Among the eight Sapindaceae species, 16 to 26 optimal codons were identified, with two common high-frequency codons: AGA (encoding Arg) and GCU (encoding Ala). The clustering heat map, which included the 8 Sapindaceae species and 13 other species, revealed two distinct clusters corresponding to monocots and dicots. This finding suggested that CUB analysis was particularly effective in elucidating evolutionary relationships at the family level. Collectively, our results emphasized the distinct codon usage characteristics and unique evolutionary traits of the eight Sapindaceae species.

Keywords: Sapindaceae; codon usage bias; evolution; mutation; nature selection.


Conflict of interest statement

The authors declare no conflicts of interest.

Figures
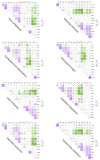
Figure 1
Figure 1
Correlation analysis is conducted among different indices across eight Sapindaceae species. Correlations are represented by the intensity of the colors, ranging from low to high. Purple indicates a positive correlation, while green indicates a negative correlation. Higher values represent stronger correlations. A3s, T3s, C3s, GC3s: composition of third synonymous codons. CAI: codon adaptation index. CBI: codon bias index. Fop: frequency of optimal codons. Nc: effective number of codons. L_sym: number of synonymous codons. L_aa: length of amino acids. Gravy: grand average of hydropathicity. Aromo: aromaticity.
Figure 2
Figure 2
The ENC plot analysis is conducted on CDSs across the eight Sapindaceae species. The purple solid line in the plot represents the expected curve of positions of genes when the codon usage is only determined by the GC3s composition.
Figure 3
Figure 3
The PR2 plot analysis is performed on CDSs across eight Sapindaceae species. The purple solid line represents the regression line.
Figure 4
Figure 4
The neutrality plot analysis is conducted on the GC12 and GC3 of CDSs in eight Sapindaceae species. The purple line represents the regression line.
Figure 5
Figure 5
Correspondence analysis using the RSCU values of CDSs in eight Sapindaceae species. Purple, green, and red denote CDSs with GC content below 45%, between 45% and 60%, and above 60%, respectively.
Figure 6
Figure 6
The RSCU value of NCG and NTA in eight Sapindaceae species.
Figure 7
Figure 7
The heat map of RSCU, based on 59 codons from 21 species, is generated using Euclidean distance. The pink and orange color circles represent monocots and dicots, respectively. The eight Sapindaceae species are marked with a green font. Correlations are represented by the intensity of the colors, ranging from low to high. Green indicates a low correlation, while purple represents a positive correlation.

Similar articles

Cited by

References

    1. Parvathy S.T., Udayasuriyan V., Bhadana V. Codon usage bias. Mol. Biol. Rep. 2022;49:539–565. doi: 10.1007/s11033-021-06749-4. - DOI - PMC - PubMed
    1. Iriarte A., Lamolle G., Musto H. Codon usage bias: An endless tale. J. Mol. Evol. 2021;89:589–593. doi: 10.1007/s00239-021-10027-z. - DOI - PubMed
    1. de Oliveira J.L., Morales A.C., Hurst L.D., Urrutia A.O., Thompson C.R.L., Wolf J.B. Inferring adaptive codon preference to understand sources of selection shaping codon usage bias. Mol. Biol. Evol. 2021;38:3247–3266. doi: 10.1093/molbev/msab099. - DOI - PMC - PubMed
    1. Yang Z., Nielsen R. Mutation-selection models of codon substitution and their use to estimate selective strengths on codon usage. Mol. Biol. Evol. 2008;25:568–579. doi: 10.1093/molbev/msm284. - DOI - PubMed
    1. Novembre J.A. Accounting for background nucleotide composition when measuring codon usage bias. Mol. Biol. Evol. 2002;19:1390–1394. doi: 10.1093/oxfordjournals.molbev.a004201. - DOI - PubMed

Publication types

LinkOut - more resources