. 2024 Dec 25;26(1):78.
doi: 10.3390/ijms26010078.

Effective Targeting of Glutamine Synthetase with Amino Acid Analogs as a Novel Therapeutic Approach in Breast Cancer

Affiliations

Effective Targeting of Glutamine Synthetase with Amino Acid Analogs as a Novel Therapeutic Approach in Breast Cancer

Shimaa Abdelsattar et al. Int J Mol Sci. .

Abstract

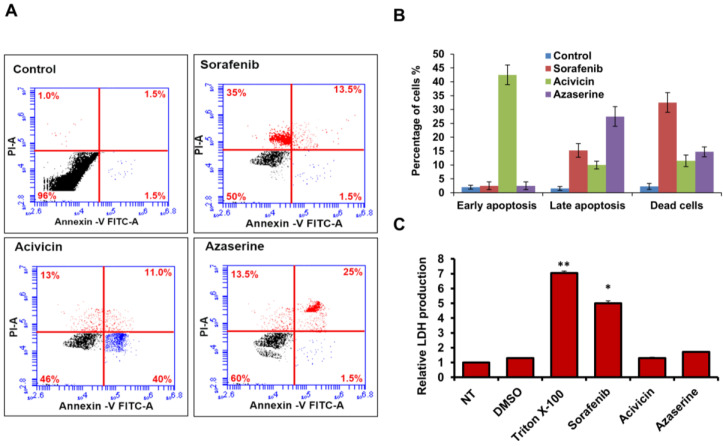
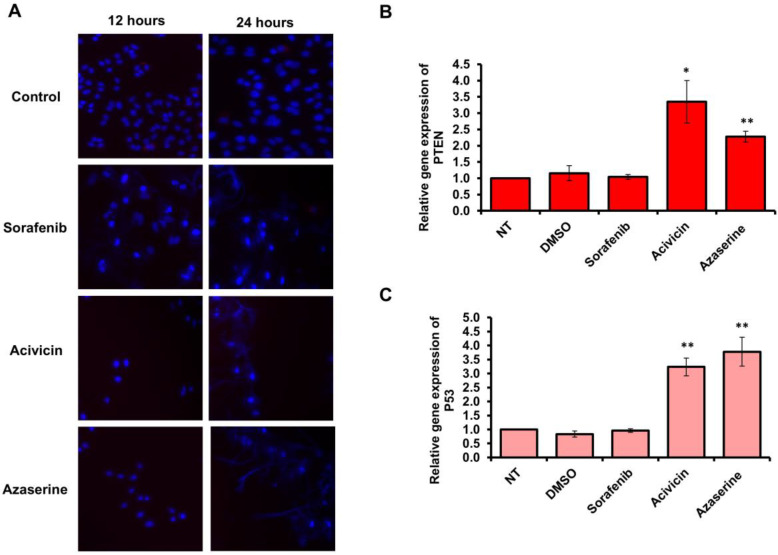
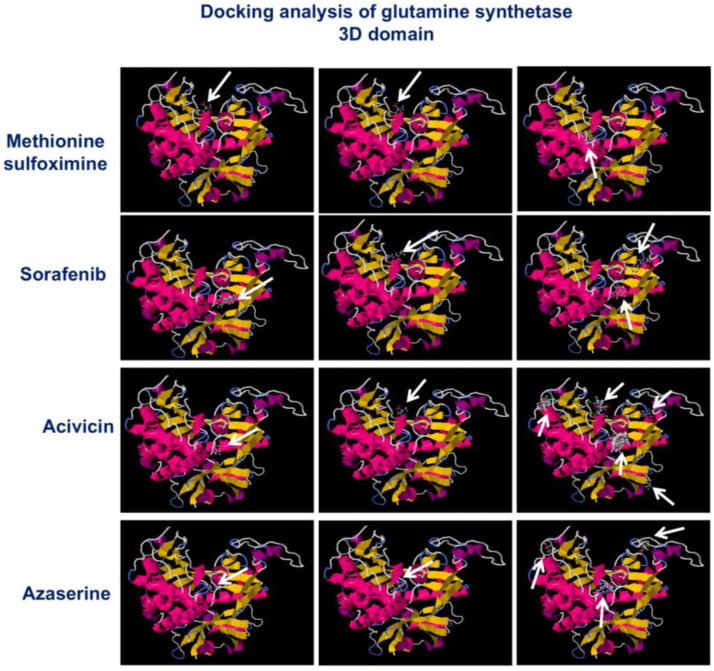
Cancer cells undergo metabolic rewiring to support rapid proliferation and survival in challenging environments. Glutamine is a preferred resource for cancer metabolism, as it provides both carbon and nitrogen for cellular biogenesis. Recent studies suggest the potential anticancer activity of amino acid analogs. Some of these analogs disrupt cellular nucleotide synthesis, thereby inhibiting the formation of DNA and RNA in cancer cells. In the present study, we investigated the anticancer properties of Acivicin and Azaserine in the breast cancer MCF-7 cell line, comparing their effects to those on the non-tumorigenic MCF-10 epithelial cell line in vitro. Interestingly, at lower concentrations, both Acivicin and Azaserine showed potent inhibition of MCF-7 cell proliferation, as assessed by the MTT assay, without detectable toxicity to normal cells. In contrast, Sorafenib (Nexavar), a commonly used drug for solid tumors, showed harmful effects on normal cells, as indicated by increased lactate dehydrogenase (LDH) production in treated cells. Furthermore, unlike Sorafenib, treatment with Acivicin and Azaserine significantly affected apoptotic signaling in treated cells, indicating the role of both amino acid analogs in activating programmed cell death (PCD), as assessed by the Annexin-V assay, DAPI staining, and the relative expression of tumor suppressor genes PTEN and P53. ELISA analysis of MCF-7 cells revealed that both Acivicin and Azaserine treatments promoted the production of anti-inflammatory cytokines, including IL-4 and IL-10, while significantly reducing the production of tumor necrosis factor alpha (TNF-α). Mechanistically, both Acivicin and Azaserine treatment led to a significant reduction in the expression of glutamine synthetase (GS) at both the RNA and protein levels, resulting in a decrease in intracellular glutamine concentrations over time. Additionally, both treatments showed comparable effects on Raf-1 gene expression and protein phosphorylation when compared with Sorafenib, a Raf-1 inhibitor. Moreover, docking studies confirmed the strong binding affinity between Acivicin, Azaserine, and glutamine synthetase, as evidenced by their docking scores and binding interactions with the enzyme crystal. Collectively, these findings provide evidence for the anticancer activity of the two amino acid analogs Acivicin and Azaserine as antagonists of glutamine synthetase, offering novel insights into potential therapeutic strategies for breast cancer.

Keywords: acivicin; amino acid analogs; azaserine; breast cancer; glutamine synthetase.


Conflict of interest statement

The authors declare no conflicts of interest.

Figures

Figure 1
Figure 1
Cell viability and cytotoxicity of Acivicin and Azaserine in breast cancer and normal breast cell lines. (A) Cell viability rate of the indicated amino acid analog treatment on MCF-7 cells in response to different concentrations of Acivicin and Azaserine compared to the same concentrations of Sorafenib and DMSO treatment. Error bars indicate the standard deviation (SD) of four different replicates. (B) Cell viability rate of the indicated amino acid analog treatment of MCF-10 cells in response to different concentrations of Acivicin and Azaserine compared to the same concentrations of Sorafenib and DMSO treatment. (C) MCF-7 and MCF-10 cell morphology presented by inverted microscope (10× magnification) upon 24 h treatment with 6.25 μM of each indicated analog of amino acids compared with the treatment with the same concentration of Sorafenib and DMSO treatment.
Figure 2
Figure 2
Apoptotic response and LDH production in response to amino acid analog treatment. (A) MCF-7 cells were treated with 6.25 μM of each indicated amino acid analog and then cells were stained with (Annexin V+/Propidium Iodide (PI)). The early and late apoptotic singling and dead cells were monitored using flow cytometry. The cells in early apoptosis were identified in the lower right quadrant, marked by blue dots, while cells in late apoptosis were located in the upper right quadrant, indicated by red dots. Dead cells were found in the upper left quadrant, also marked by red dots. (B) The percentage of treated cells with positive signals for early or late apoptosis and the percentage of dead cells indicated by flow cytometric assay. (C) Relative LDH production of treated cells with the indicated amino acid analogs in comparison with control-treated cells, Triton X-100, and DMSO-treated cells. Error bars indicate the SD of three independent experiments. Student’s two-tailed t-test used for statistical analysis; (*) indicates p-values ≤ 0.05, (**) indicates p ≤ 0.01.
Figure 3
Figure 3
Cell survival and expression of tumor suppresser genes. (A) Fluorescent microscope images (40× magnification) of treated MCF-7 cells showing DNA staining with DAPI, used as an indicator of live cells, at 12 and 24 h after drug treatment. (B,C) Quantitative analysis of PTEN and p53 gene expression levels in treated cells was performed using fold changes from qRT-PCR. Error bars represent the SD. Statistical significance of the cycle threshold (Ct) values was assessed using a two-tailed Student’s t-test, with (*) indicates p-values ≤ 0.05 and (**) indicating a p-value of <0.01, denoting high significance. Data are representative of three independent experiments.
Figure 4
Figure 4
Levels of produced cytokines IL-4, IL6, IL10, and TNF-α in treated MCF-7 cells. (A,B) The concentrations of IL-6 and TNF-α (pm/mL) produced over time in the fluid media of MCF-7 cells that were pretreated with 6.25 μM Acivicin or Azaserine compared to cells treated with the same concentration of Sorafenib and control-treated cells. Error bars represent the SD of four different replicates. (C,D) The concentrations of IL-4 and IL-10 (pm/mL) produced over time in the fluid media of MCF-7 cells that were pretreated with 6.25 μM Acivicin or Azaserine, compared to cells treated with the same concentration of Sorafenib and control-treated cells. Error bars represent the SD of four different replicates.
Figure 5
Figure 5
Quantification of GS and Raf-1 expression profiles in treated MCF-7 cells. (A,B) Steady-state mRNA levels of Raf-1 and GS, quantified as fold changes, were measured in MCF-7 cells treated with 6.25 μM of various drugs, compared to DMSO and control-treated cells. Error bars represent the SD from two independent experiments. A Student’s two-tailed t-test was used for significance analysis of cycle threshold (Ct) values, with (**) indicating p < 0.01, considered highly significant. (C) Protein levels of phospho-Raf-1 and GS were quantified in treated MCF-7 cells through immunoblotting analysis and compared to DMSO and control-treated cells. β-actin served as the internal control. (D) The total concentrations of glutamine over time in MCF-7 cells treated with 6.25 μM Acivicin or Azaserine were measured and compared to the respective concentrations in cells treated with Sorafenib, DMSO, and control treatments. Error bars represent the SD from four independent replicates. Data are representative of three independent experiments.
Figure 6
Figure 6
Docking analysis. The figure illustrates a typical output from SwissDock, showing the docking positions of GS with MS, Sorafenib, Acivicin, and Azaserine. Visual analysis was conducted using the ViewDock plugin of UCSF Chimera. The predicted BM of GS (represented by magenta sticks) is overlaid with the X-ray BM (shown as ball and sticks). As indicated by the white arrows, this particular predicted BM demonstrates the most favorable energy. Binding affinities of Acivicin, Azaserine, and GS crystal structures obtained through docking analysis using SwissDock software (http://old.swissdock.ch/docking/view/swissdockd_Cq1lhe_K7JARBW1YPTXICSDE1KQ accessed on 1 November 2024) indicates the potential binding affinities of the ligands MS to the GS protein structure compared with the original binding affinity of Sorafenib and MS, the standard GS inhibitor.

References

    1. Feng Y., Spezia M., Huang S., Yuan C., Zeng Z., Zhang L., Ji X., Liu W., Huang B., Luo W., et al. Breast Cancer Development and Progression: Risk Factors, Cancer Stem Cells, Signaling Pathways, Genomics, and Molecular Pathogenesis. Genes Dis. 2018;5:77–106. doi: 10.1016/j.gendis.2018.05.001. - DOI - PMC - PubMed
    1. Castaneda M., den Hollander P., Kuburich N.A., Rosen J.M., Mani S.A. Mechanisms of Cancer Metastasis. Semin. Cancer Biol. 2022;87:17–31. doi: 10.1016/j.semcancer.2022.10.006. - DOI - PubMed
    1. Merckens A., Sieler M., Keil S., Dittmar T. Altered Phenotypes of Breast Epithelial × Breast Cancer Hybrids after ZEB1 Knock-Out. Int. J. Mol. Sci. 2023;24:17310. doi: 10.3390/ijms242417310. - DOI - PMC - PubMed
    1. Tai Y.C., Domchek S., Parmigiani G., Chen S. Breast Cancer Risk Among Male BRCA1 and BRCA2 Mutation Carriers. JNCI J. Natl. Cancer Inst. 2007;99:1811–1814. doi: 10.1093/jnci/djm203. - DOI - PMC - PubMed
    1. Antoniou A., Pharoah P.D.P., Narod S., Risch H.A., Eyfjord J.E., Hopper J.L., Loman N., Olsson H., Johannsson O., Borg Å., et al. Average Risks of Breast and Ovarian Cancer Associated with BRCA1 or BRCA2 Mutations Detected in Case Series Unselected for Family History: A Combined Analysis of 22 Studies. Am. J. Hum. Genet. 2003;72:1117–1130. doi: 10.1086/375033. - DOI - PMC - PubMed

MeSH terms