. 2024 Dec 30;26(1):218.
doi: 10.3390/ijms26010218.

Prolonged Hypoxia in Rat Living Myocardial Slices Affects Function, Expression, and Structure

Affiliations

Prolonged Hypoxia in Rat Living Myocardial Slices Affects Function, Expression, and Structure

Florian J G Waleczek et al. Int J Mol Sci. .

Abstract

Ischemic heart disease is the leading cause of death worldwide. Reduced oxygen supply and myocardial hypoxia lead to tissue damage and impairment of the heart function. To the best of our knowledge, the primary functional effects of hypoxia in the multicellular model of living myocardial slices (LMSs) have not been investigated so far. In this study, we analyzed force generation, ultrastructure, gene expression, and proteome changes in rat LMS after 24 h of ex vivo culture in normal and reduced levels of oxygen (O2). We observed a significant reduction in absolute force and a slowdown of force kinetics as well as an increase in cardiomyocyte apoptosis and myofibrillar and mitochondrial damage, as well as transcriptomic changes. Proteome analysis revealed the deregulation of proteins involved in metabolic processes, hypoxic response, and neutralizing of reactive oxygen species. Our results indicate that hypoxia induces substantial primary changes in heart tissue, which are independent of perfusion and immune responses. Our new LMS model could serve as a screening system for drug development and new mechanistic insights.

Keywords: force generation; gene expression; hypoxia; proteome; rat living myocardial slices; tissue model.


Conflict of interest statement

T.T. filed and licensed patents in the field of RNA-based therapeutics. T.T. is the founder and CSO/CMO of Cardior Pharmaceuticals Gmbh, a wholly-owned subsidiary of Novo Nordisk A/S Europe (outside of this MS). All other authors declare no conflicts of interest.

Figures

Figure 1
Figure 1
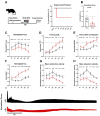
(A) Experimental protocol. X-axis: time; y-axis: O2 concentration (%). The control LMS (18% O2, black) were kept at 18% for the whole experiment. O2 concentration of the hypoxic LMS (9% O2, red) was lowered every three hours by 3% until it reached 3%, and then it was lowered to 1% and 0.2%. The stepwise decrease in O2 took from 30 sec (18–15%) up to 15 min (3–0.2%). During nitrogen insufflation, the lowest achieved CO2 concentration was 4.2%. (B) Normalized force was measured 1.5 h after the respective decrease in O2 concentration. X-axis: time; y-axis: force normalized to the force at 15 min (dotted line). Data are shown as mean ± SEM. Significance was tested with two-way pairwise ANOVA with Sidak post hoc test. N = 3 rats, n = 5 and 7 LMS for normoxic (black) and hypoxic (red) conditions, respectively. p-values are stated above data points. (C) Representative recordings of force of control LMS (top, black) and hypoxic LMS (bottom, red). X-axis: time; y-axis: force normalized to the force at 15 min.
Figure 2
Figure 2
(A) Scheme showing experimental protocol. Diagram with x-axis: time; y-axis: O2 concentration (%) in normoxic (18% O2, black) or hypoxic (9% O2, red) LMS. O2 concentration of hypoxic LMSs was reduced after 1 h from 18% O2 to 9% O2. The decrease in O2 from 18% to 9% lasted 2 to 3.5 min. During nitrogen insufflation, the lowest achieved CO2 concentration was 4.2%. (B) Normalized force at 24 h (18% O2, black vs. 9% O2, red). Y-axis: relative force generation normalized to the force at 15 min (dotted line). Data are shown as mean ± SEM. Significance was tested with paired Student’s t-test; each dot represents the mean of the LMS generated from each rat; (N = 10 rats, n = 15 and 19 for normoxic and hypoxic LMS, respectively). (CH) Contraction parameters of LMSs analyzed at indicated time points. X-axis: time, y-axis: parameter normalized to the value at 15 min (dotted line). Data are shown as mean ± SEM. Significance was tested with 2-way pairwise ANOVA with Sidak post hoc test. N = 9–10 rats, n = 15 and 19 for normoxic (black) and hypoxic (red) LMS, respectively. For absolute values refer to Supplementary Table S1. p-values are stated above the data points. (C) Normalized force, (D) time to peak (TTP), (E) time to 90% of relaxation (RT90), (F) decay constant of the relaxation (τ), (G) mean contraction velocity, and (H) mean relaxation velocity. (I) Representative force recordings of normoxic LMS (black, top) and hypoxic LMS (red, bottom). X-axis: time, y-axis: force normalized to force at 15 min (dotted line).
Figure 3
Figure 3
(A) Hematoxylin and eosin (HE) staining, (B) Picrosirius Red (PSR) staining, (C) TUNEL staining of rat LMSs. Vital nuclei are stained in blue, and apoptotic nuclei are stained in green; actin filaments are stained with phalloidin in red. Top row: normoxic LMSs, bottom row: hypoxic LMS. Scale bar 100 µm. (D) PSR-positive area as percentage of total area (mean ± SD, significance was tested with paired Student’s t-test, N = 3), (E) TUNEL-positive nuclei as percentage of all nuclei (mean ± SD, significance was tested with paired Student’s t-test, N = 8). Each dot represents the mean of two LMS generated from each rat (N = 3) in (D) and one LMS generated from each rat (N = 9) in (E).
Figure 4
Figure 4
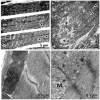
Transmission electron microscopy of LMS. Left: normoxic LMS; right: hypoxic LMS. LMS were cultured for 24 h and then fixated under pre-stretch to 2.1 µm sarcomere length. After embedding, sectioning was performed longitudinally to the cardiomyocyte alignment of the tissue, and the central region was analyzed. Note the aligned and uninterrupted myofibrils in the normoxic sample (top left, arrowheads), compared with the disconnected ones in the hypoxic sample (top right, arrowheads, disruptions marked by asterisks). Mitochondria profiles (M) in the normoxic sample appear more electron-dense than the rest of the tissue, with clearly visible and parallel continuous cristae (bottom left). In contrast, in the hypoxic sample, mitochondria appear less electron-dense and mostly swollen, with irregular cristae (bottom right).
Figure 5
Figure 5
(A) Ranking of stability for housekeeper gene expressions determined by RefFinder, with ARBP being the most stable gene. (BM) Normalized gene expressions in normoxic (black) and hypoxic (red) LMS. Gene expressions were normalized to the reference gene ARBP and the normoxic LMS (2−ΔΔCT method). Hypoxia markers (HIF1a, ADM, HMOX, VEGFa, SOD2; (BF)), fibrosis-associated/stromal cell markers (COL3A1, a-SMA, VIM; (GI)), genes encoding for sodium/calcium exchanger NCX1 (SLC8A1) and SERCA2A (ATP2A2) and gap junction protein alpha 1 (GJA1; (JL)) and hypoxia-related miR-210 (normalized to snRNA U6; M) were quantified between the groups. Data are shown as mean ± SD. Significance was tested with paired Student’s t-test. N = 4 rats, n = 8 and 8 for normoxic and hypoxic LMS, respectively; each dot represents one LMS. p-values stated above data points.
Figure 6
Figure 6
(A) Volcano plot of proteins in hypoxic LMS compared with normoxic LMS quantified with mass spectrometry (in total, 126 deregulated proteins). N = 4 rats, n = 4 and 4 normoxic and hypoxic LMS, respectively. (B) Component plot of PLSDA differentiating both conditions with confidence ellipses. (C) Bubble plot presenting the proteins contained in component 1 of the PLSDA. X-axis: log2(FC). Bubble color: contribution to the PLSDA component 1, bubble size: −log(p). Colored arrows: proteins in STRING clusters in (E). (D) Heatmap of the PLSDA model using 78 proteins. X-axis: proteins. Y-axis: normoxic (black) and hypoxic (red) LMS. (E) STRING network of upregulated proteins in component 1. Proteins enriched in the GO cluster “response to hypoxia” marked in red and those enriched in “aerobic respiration” marked in blue.

References

    1. Kolwicz S.C., Purohit S., Tian R. Cardiac Metabolism and Its Interactions With Contraction, Growth, and Survival of Cardiomyocytes. Circ. Res. 2013;113:603–616. doi: 10.1161/CIRCRESAHA.113.302095. - DOI - PMC - PubMed
    1. Khan M.A., Hashim M.J., Mustafa H., Baniyas M.Y., Al Suwaidi S.K.B.M., AlKatheeri R., Alblooshi F.M.K., Almatrooshi M.E.A.H., Alzaabi M.E.H., Al Darmaki R.S., et al. Global Epidemiology of Ischemic Heart Disease: Results from the Global Burden of Disease Study. Cureus. 2020;12:e9349. doi: 10.7759/cureus.9349. - DOI - PMC - PubMed
    1. Su Z., Liu Y., Zhang H. Adaptive Cardiac Metabolism Under Chronic Hypoxia: Mechanism and Clinical Implications. Front. Cell Dev. Biol. 2021;9:625524. doi: 10.3389/fcell.2021.625524. - DOI - PMC - PubMed
    1. Cohen M.V., Downey J.M. Signalling Pathways and Mechanisms of Protection in Pre- and Postconditioning: Historical Perspective and Lessons for the Future. Br. J. Pharmacol. 2015;172:1913–1932. doi: 10.1111/bph.12903. - DOI - PMC - PubMed
    1. Cavadas M.A.S., Cheong A., Taylor C.T. The Regulation of Transcriptional Repression in Hypoxia. Exp. Cell Res. 2017;356:173–181. doi: 10.1016/j.yexcr.2017.02.024. - DOI - PubMed

LinkOut - more resources