Metabolomic and Transcriptomic Analyses of Flavonoid Biosynthesis in Different Colors of Soybean Seed Coats
- PMID: 39796145
- PMCID: PMC11720147
- DOI: 10.3390/ijms26010294
Metabolomic and Transcriptomic Analyses of Flavonoid Biosynthesis in Different Colors of Soybean Seed Coats
Abstract
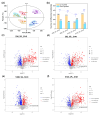
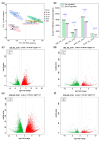
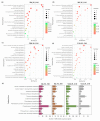
Soybean has outstanding nutritional and medicinal value because of its abundant protein, oil, and flavonoid contents. This crop has rich seed coat colors, such as yellow, green, black, brown, and red, as well as bicolor variants. However, there are limited reports on the synthesis of flavonoids in the soybean seed coats of different colors. Thus, the seed coat metabolomes and transcriptomes of five soybean germplasms with yellow (S141), red (S26), brown (S62), green (S100), and black (S124) seed coats were measured. In this study, 1645 metabolites were detected in the soybean seed coat, including 426 flavonoid compounds. The flavonoids differed among the different-colored seed coats of soybean germplasms, and flavonoids were distributed in all varieties. Procyanidins A1, B1, B6, C1, and B2, cyanidin 3-O-(6″-malonyl-arabinoside), petunidin 3-(6″-p-coumaryl-glucoside) 5-glucoside, and malvidin 3-laminaribioside were significantly upregulated in S26_vs._S141, S62_vs._S141, S100_vs._S141, and S124_vs._S141 groups, with a variation of 1.43-2.97 × 10¹³ in terms of fold. The differences in the contents of cyanidin 3-O-(6″-malonyl-arabinoside) and proanthocyanidin A1 relate to the seed coat color differences of red soybean. Malvidin 3-laminaribioside, petunidin 3-(6″-p-coumaryl-glucoside) 5-glucoside, cyanidin 3-O-(6″-malonyl-arabinoside), and proanthocyanidin A1 affect the color of black soybean. The difference in the contents of procyanidin B1 and malvidin 3-glucoside-4-vinylphenol might be related to the seed coat color differences of brown soybeans. Cyanidin 3-gentiobioside affects the color of green soybean. The metabolomic-transcriptomic combined analysis showed that flavonoid biosynthesis is the key synthesis pathway for soybean seed color formation. Transcriptome analysis revealed that the upregulation of most flavonoid biosynthesis genes was observed in all groups, except for S62_vs._S141, and promoted flavonoid accumulation. Furthermore, CHS, CHI, DFR, FG3, ANR, FLS, LAR, and UGT88F4 exhibited differential expression in all groups. This study broadens our understanding of the metabolic and transcriptomic changes in soybean seed coats of different colors and provides new insights into developing bioactive substances from soybean seed coats.
Keywords: flavonoid; metabolome; seed coat color; soybean; transcriptome.
Conflict of interest statement
The authors declare that they have no competing interests.
Figures


Similar articles
-
Identifying Candidate Genes Related to Soybean (Glycine max) Seed Coat Color via RNA-Seq and Coexpression Network Analysis.Genes (Basel). 2025 Jan 1;16(1):44. doi: 10.3390/genes16010044. Genes (Basel). 2025. PMID: 39858589 Free PMC article.
-
Combined analysis of transcriptome and metabolite data reveals extensive differences between black and brown nearly-isogenic soybean (Glycine max) seed coats enabling the identification of pigment isogenes.BMC Genomics. 2011 Jul 29;12:381. doi: 10.1186/1471-2164-12-381. BMC Genomics. 2011. PMID: 21801362 Free PMC article.
-
Integrated metabolomic and transcriptomic analysis of the anthocyanin and proanthocyanidin regulatory networks in red walnut natural hybrid progeny leaves.PeerJ. 2022 Oct 20;10:e14262. doi: 10.7717/peerj.14262. eCollection 2022. PeerJ. 2022. PMID: 36285329 Free PMC article.
-
Metabolomic analysis of flavonoid diversity and biosynthetic pathways in whole grains.Food Res Int. 2025 Jun;211:116359. doi: 10.1016/j.foodres.2025.116359. Epub 2025 Apr 22. Food Res Int. 2025. PMID: 40356159 Review.
-
A review of how colors clue us into gross diagnosis in domestic animals.Vet Pathol. 2025 Sep;62(5):646-658. doi: 10.1177/03009858251322738. Epub 2025 Mar 12. Vet Pathol. 2025. PMID: 40071649 Review.
References
-
- Whipps J.M., Davies K.G. Success in Biological Control of Plant Pathogens and Nematodes by Microorganisms. Springer; Amsterdam, The Netherlands: 2000.
-
- Desta K.T., Hur O.S., Lee S., Yoon H., Shin M.J., Yi J., Lee Y., Ro N.Y., Wang X., Choi Y.M. Origin and seed coat color differently affect the concentrations of metabolites and antioxidant activities in soybean (Glycine max (L.) Merrill) seeds. Food Chem. 2022;381:132249. doi: 10.1016/j.foodchem.2022.132249. - DOI - PubMed
-
- Kim Y.J., Lee S.J., Lee H.M., Lee B.W., Ha T.J., Bae D.W., Son B.Y., Kim Y.H., Baek S.B., Kim Y.C., et al. Comparative proteomics analysis of seed coat from two black colored soybean cultivars during seed development. Plant Omics. 2013;6:456–463.
MeSH terms
Substances
Grants and funding
- 111821301354052034/The Third National Campaign of Crop Germplasm Census and Collection
- 2023NSFSC1176/Natural Science Foundation of Sichuan
- 1+9KJGG001/Sichuan Academy of Agricultural Sciences project "1-9 unveiling the list"
- 1+3 ZYGG001/The Accurate Identification Project of Crop Germplasm from Sichuan Provincial Finance De-partment
- 51000023T000009852064/Crop Germplasm Census
LinkOut - more resources
Full Text Sources
Miscellaneous

