. 2024 Dec 25;14(1):22.
doi: 10.3390/foods14010022.

A Survey on the Evaluation of Monosodium Glutamate (MSG) Taste in Austria

Affiliations

A Survey on the Evaluation of Monosodium Glutamate (MSG) Taste in Austria

Emilia Iannilli et al. Foods. .

Abstract

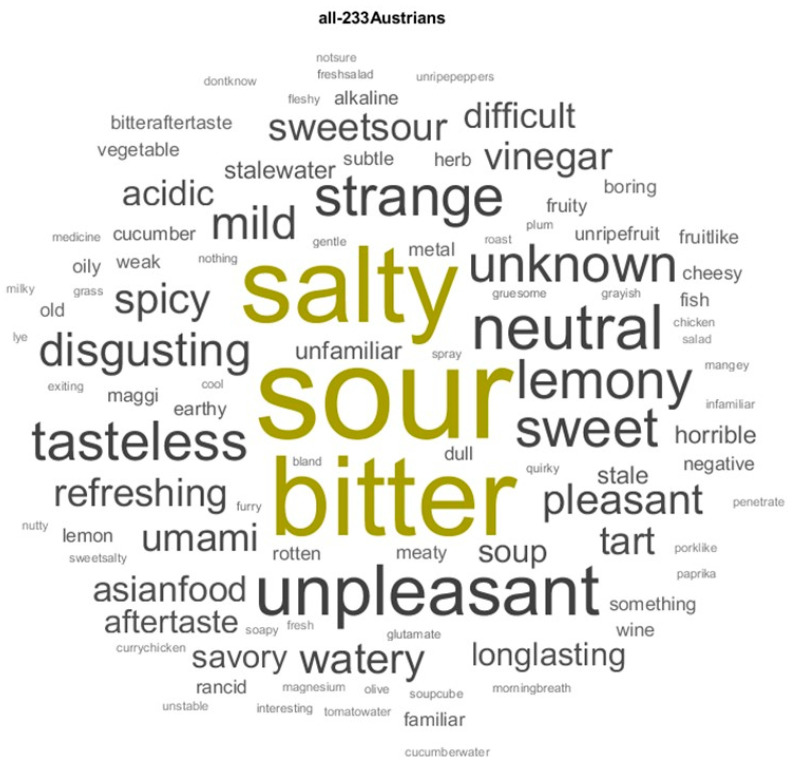
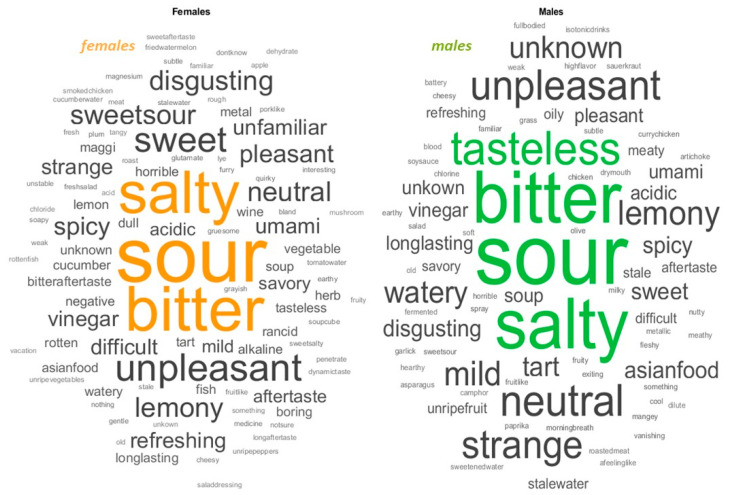
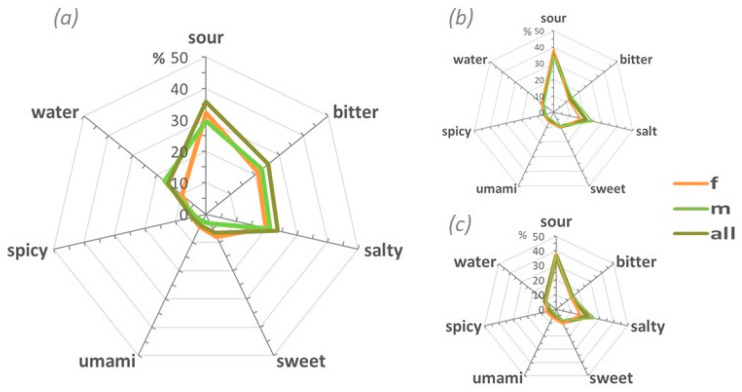
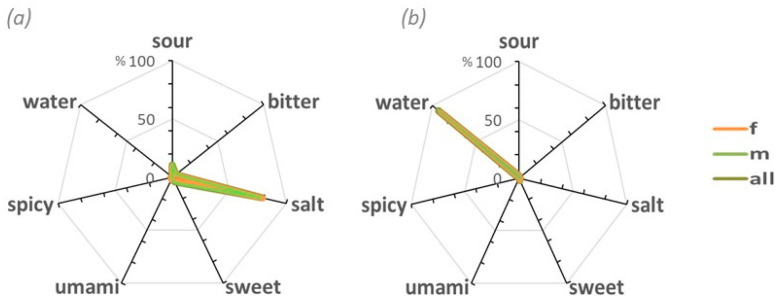
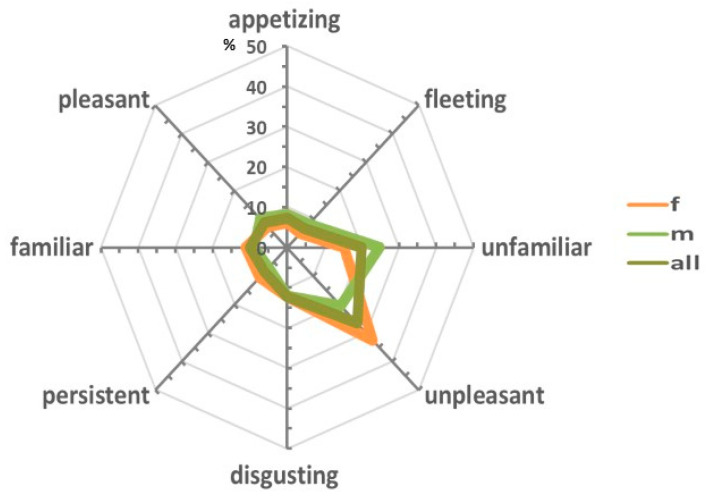
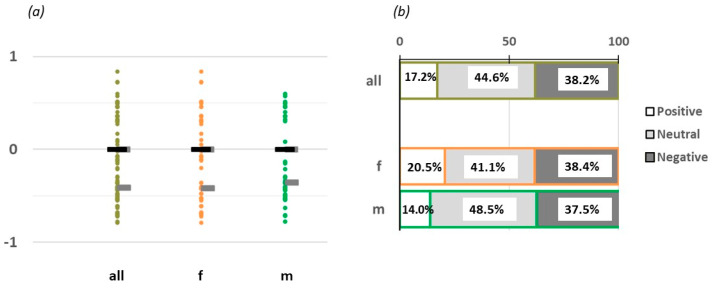
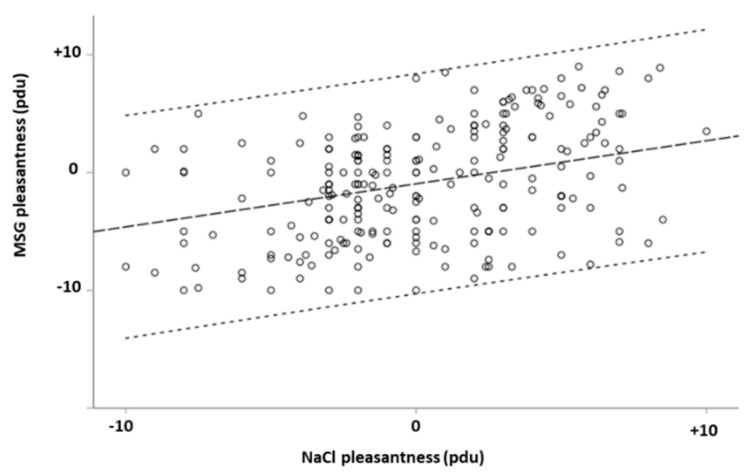
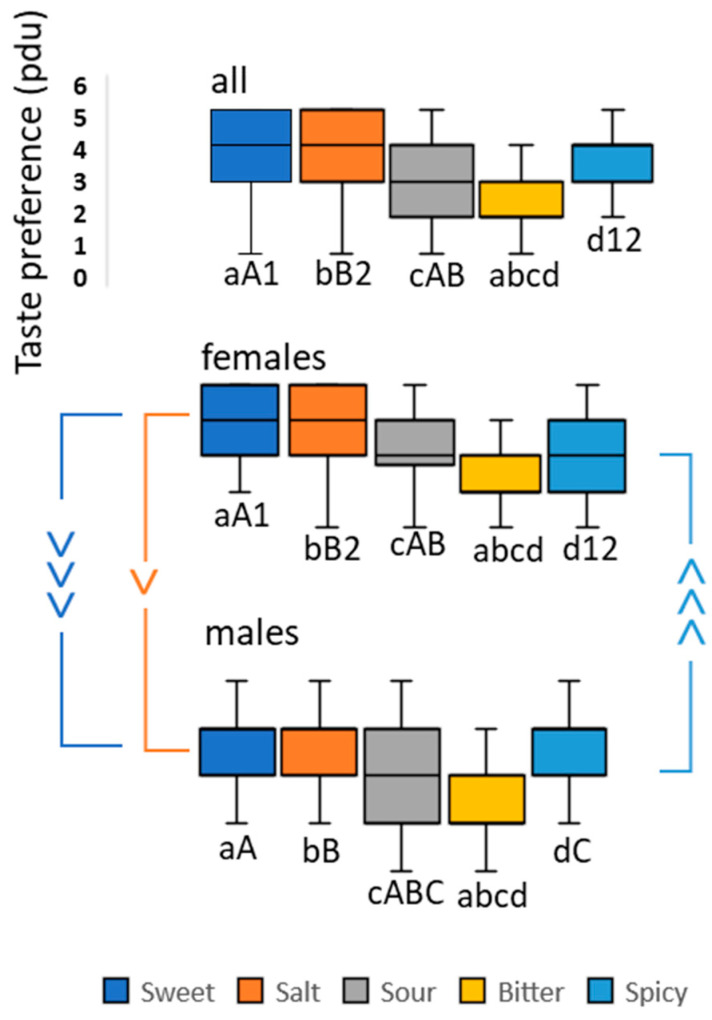
The umami taste is well validated in Asian culture but remains less recognized and accepted in European cultures despite its presence in natural local products. This study explored the sensory and emotional perceptions of umami in 233 Austrian participants who had lived in Austria for most of their lives. Using blind tasting, participants evaluated monosodium glutamate (MSG) dissolved in water, providing open-ended verbal descriptions, pleasantness ratings, and comparisons to a sodium chloride (NaCl) solution. Discrimination tests excluded MSG ageusia, and basic demographic data were collected. A text semantic-based analysis (TSA) was employed to analyze the emotional valence and descriptive content of participants' responses. The results showed that MSG was predominantly associated with neutral sentiments across the group, including both female and male subgroups. "Sour" was the most frequent taste descriptor, while "unfamiliar" characterized the perceptual experience. Pleasantness ratings for MSG and NaCl were positively correlated, suggesting that overcoming the unfamiliarity of umami could enhance its acceptance and align it with the pleasantness of salt. These findings advance the understanding of umami sensory perception and its emotional and cultural acceptance in European contexts, offering valuable insights for integrating umami into Western dietary and sensory frameworks.

Keywords: cultural acceptance; perception; sensory analysis; text sentiment analysis.


Conflict of interest statement

The authors declare no conflict of interest.

Figures

Figure 1
Figure 1
Word cloud based on the term-frequency counter of the text mining analysis for the entire group. The more a specific word appears in a source of textual data, the bigger and bolder it appears in the word cloud. The descriptors with a frequency of appearance of more than 40 are portrayed in olive.
Figure 2
Figure 2
Word cloud based on the term-frequency counter of the text mining analysis separately for the male (orange) and female (green) subgroups. The more often a specific word appears in a source of textual data, the bigger and bolder it appears in the word cloud. The highlighted words have a minimum frequency of appearance of 10.
Figure 3
Figure 3
Radar charts of MSG taste profiles. Radar charts representing the taste perception described by the samples in the study. The umami taste description, whether extracted by the open-answer descriptors (a) or obtained in a test in comparison to a salt (b) or simple water solution (c), shows a consistent pattern across the whole group (all), subgroups (m, f), and tests (b,c). This consistency indicates that the umami taste was described as a complex combination of primary tastes with a predominancy of sour, bitter, and salty flavors, while umami itself remained unidentified. The scale, in percentage, refers to the total number of subjects in the group.
Figure 4
Figure 4
Radar charts of (a) NaCl solution and (b) tasteless solution taste profiles. The sample clearly identified the respective tastes for salt (90%) and water (97%), with no differences between females and males. The scale, in percentage, refers to the total number of subjects in the group.
Figure 5
Figure 5
Radar charts of MSG hedonic perception described by the samples in the study. The umami perceptual profile is reported in four dimensions—appetizing (disgusting), pleasant (unpleasant), familiar (unfamiliar), and persistent (fleeting)—with opposite valence on the extremities of the axis. The categories were based on the open-answer descriptors. Overall, the entire group described the MSG taste as unpleasant and unfamiliar. In the charts, the entire group is depicted in olive green (all), while the female and male subgroups are shown in orange (f) and green (m), respectively. In the chart, the entire population is depicted in olive green, while the female and male subgroups are shown in orange (f) and green (m), respectively. The scale, in percentage, refers to the total number of subjects in the group.
Figure 6
Figure 6
Text sentiment analysis (TSA) results. (a) TSA of the phrases pronounced in the open-answer description of the MSG solution. The median (black bar) and IRQ (grey bars) report on the point distribution. (b) TSA percentage of the hedonic components: positive (white), neutral (grey), and negative (black). All: entire group, f: females, m: male.
Figure 7
Figure 7
Linear regression analysis of MSG pleasantness as a function of NaCl pleasantness. The dashed line represents the best-fit linear regression model. The area around the regression line delineated by the dotted lines indicates the 95% confidence interval of the predicted MSG pleasantness values based on NaCl pleasantness ratings. The model explains 9.5% of the variance in MSG pleasantness (R2 = 0.095), indicating a statistically significant linear relationship (p < 0.001) with coefficient β = 0.37. pdu: procedure defined unit.
Figure 8
Figure 8
Box plots (median, IQR) of taste preference expressed as recalled experience on the Likert scale (0–6) for sweet, salty, sour, bitter, and spicy, organized in rows by group (all: entire group), and gender, and in columns by taste (sweet, salty, sour, bitter, and spicy). The statistical significance levels between groups are highlighted with “>“, where the angle bracket’s opening is in the greater value’s direction. Also: “>>>“, and “>” indicate p < 0.001, p < 0.01, and p < 0.05, respectively. Statistical differences within groups are highlighted by letters/numbers; the same letter/number indicates statistically significant differences.

Similar articles

Cited by

References

    1. Ikeda K. On a new seasoning. J. Tokyo Chem. Soc. 1909;30:820–836. doi: 10.1093/chemse/27.9.847. - DOI
    1. Nelson G., Chandrashekar J., Hoon M.A., Feng L., Zhao G., Ryba N.J., Zuker C.S. An amino-acid taste receptor. Nature. 2002;416:199–202. doi: 10.1038/nature726. - DOI - PubMed
    1. Yamaguchi S., Ninomiya K. Umami and food palatability. J. Nutr. 2000;130((Suppl. S4)):921S–926S. doi: 10.1093/jn/130.4.921S. - DOI - PubMed
    1. Zhang Z., Adelman A.S., Rai D., Boettcher J., Lonnerdal B. Amino acid profiles in term and preterm human milk through lactation: A systematic review. Nutrients. 2013;5:4800–4821. doi: 10.3390/nu5124800. - DOI - PMC - PubMed
    1. Steiner J.E. In: What the Infant Can Tell Us About Umami in Umami: A Basic Taste. Kawamura Y., Kare M.R., editors. Marcel Dekker; New York, NY, USA: 1987. pp. 97–123.

LinkOut - more resources