. 2024 Dec 28;17(1):72.
doi: 10.3390/nu17010072.

Role of Increasing Body Mass Index in Gut Barrier Dysfunction, Systemic Inflammation, and Metabolic Dysregulation in Obesity

Affiliations

Role of Increasing Body Mass Index in Gut Barrier Dysfunction, Systemic Inflammation, and Metabolic Dysregulation in Obesity

Fatima Maqoud et al. Nutrients. .

Abstract

Aims: This study explores the link between body mass index (BMI), intestinal permeability, and associated changes in anthropometric and impedance parameters, lipid profiles, inflammatory markers, fecal metabolites, and gut microbiota taxa composition in participants having excessive body mass.

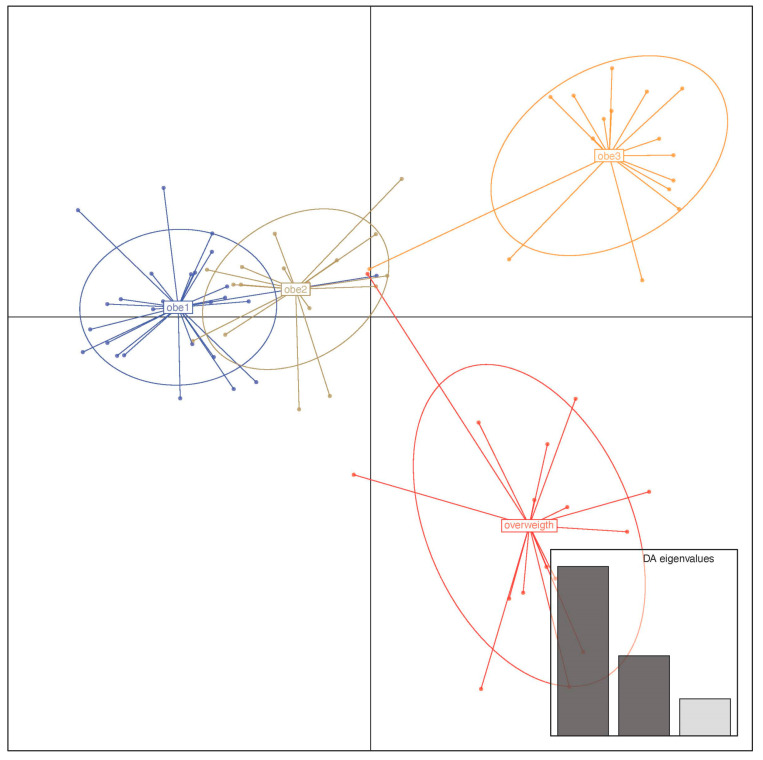
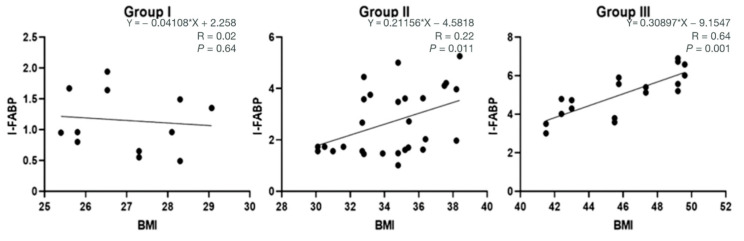
Methods: A cohort of 58 obese individuals with comparable diet, age, and height was divided into three groups based on a priori clustering analyses that fit with BMI class ranges: Group I (25-29.9), Group II (30-39.9), and Group III (>40). Anthropometric and clinical parameters were assessed, including plasma C-reactive protein and cytokine profiles as inflammation markers. Intestinal permeability was measured using a multisaccharide assay, with fecal/serum zonulin and serum claudin-5 and claudin-15 levels. Fecal microbiota composition and metabolomic profiles were analyzed using a phylogenetic microarray and GC-MS techniques.

Results: The statistical analyses of the clinical parameters were based on the full sample set, whereas a subset composed of 37 randomized patients was inspected for the GC/MS metabolite profiling of fecal specimens. An increase in potentially pro-inflammatory bacterial genera (e.g., Slackia, Dorea, Granulicatella) and a reduction in beneficial genera (e.g., Adlercreutzia, Clostridia UCG-014, Roseburia) were measured. The gas chromatography/mass spectrometry analysis of urine samples evidenced a statistically significant increase in m-cymen-8-ol, 1,3,5-Undecatriene, (E, Z) and a decreased concentration of p-cresol, carvone, p-cresol, and nonane.

Conclusions: Together, these data demonstrated how an increased BMI led to significant changes in inflammatory markers, intestinal barrier metabolites, glucose metabolism, endocrine indicators, and fecal metabolomic profiles that can indicate a different metabolite production from gut microbiota. Our findings suggest that targeting intestinal permeability may offer a therapeutic approach to prevent and manage obesity and related metabolic complications, reinforcing the link between gut barrier function and obesity.

Keywords: body mass index (BMI); fecal metabolomics; fecal microbiota; inflammatory markers; intestinal permeability; obesity; zonulin.


Conflict of interest statement

The authors declare that the research was performed without any financial relationships that could represent a possible conflict of interest.

Figures

Figure 1
Figure 1
A priori group stratification resulting from the DAPC analysis run using the clinical/biochemical and anthropometric complete parameter matrix obtained from the 58-patient set. Used eigen values have been colored in dark grey.
Figure 2
Figure 2
Clinical/anthropometric a posterior sample stratification in the DAPC analysis. The a posterior group assignment was based on BMI grouping, such as overweight, type 1, 2, and type 3 obesity.
Figure 3
Figure 3
DAPC loading and assignment plot based on the 58-patient sample’s clinical/biochemical and anthropometric parameters. (A) DAPC loading plot reporting the clinical/anthropometric variables that most impacted cluster separation. An arbitrary 0.02 threshold is used to show the above threshold variables. (B) The cell matrix reports the fitting between the “a priori” and the “a posterior” assignments.
Figure 4
Figure 4
Comparison of glucose metabolism and endocrine indicators based on DAPC BMI stratification in overweight and obese subjects. Data are expressed as the mean ± standard deviation, and statistical analyses were performed using an ANOVA followed by a Tukey’s post hoc test. Statistically significant comparisons (p < 0.05) are highlighted by a bold line and marked with an asterisk. Path coefficients and significance: * p < 0.05, ** p < 0.01. Measured parameters include (a) fasting plasma glucose, (b) fasting insulin, (c) HOMA-IR, (d) fasting obestatin, (e) fasting ghrelin.
Figure 5
Figure 5
Levels of inflammatory markers in the 58 overweight and obese individuals grouped according to BMI categories. Data are expressed as the mean ± standard deviation, and statistical analyses were performed using an ANOVA followed by a Tukey’s post hoc test. Statistically significant comparisons (p < 0.05) are highlighted by a bold line and marked with an asterisk. Path coefficients and significance: * p < 0.05, ** p < 0.01. Inflammatory marker sub-panels include (a) PCR, (b) IL-6, (c) IL-8, (d) IL-10, (e) TNF-alpha.
Figure 6
Figure 6
Levels of biomarkers related to intestinal barrier function and integrity measured in the set composed of 58 patients. Data are expressed as the mean ± standard deviation, and statistical analyses were performed using an ANOVA followed by a Tukey’s post hoc test. Statistically significant comparisons (p < 0.05) are highlighted by a bold line and marked with an asterisk. Path coefficients and significance: * p < 0.05, ** p < 0.01, **** p < 0.0001. Sub-panels include (a) lac/man ration, IFAB-2 (b), (c) serum claudin 5.
Figure 7
Figure 7
Linear regression analysis assessing the relationship between BMI and the intestinal permeability marker I-FABP.
Figure 8
Figure 8
Levels of urinary indole, urinary skatole, and serum lipopolysaccharide (LPS) in the study cohort where the 58 patients have been grouped based on the DAPC BMI clusters. Data are expressed as the mean ± standard deviation, and statistical analyses were performed using an ANOVA followed by a Tukey’s post hoc test. p-values indicating significant differences (p < 0.05) are highlighted by a bold line and marked with an asterisk. Path coefficients and significance: * p < 0.05, ** p < 0.01. The cut-off levels indicating dysbiosis were set at 20 mg/L for indican and 20 μg/L for skatole. Sub-panels of urinary markers include (a) indican, (b) skatole and, (c) LPS.
Figure 9
Figure 9
Statistically significant urinary VOCs detected by metabolomic (GC/MS) analyses on 37 patient samples. Fold change analysis was joined with a Welch’s corrected test (BH multiple correction) based on taxa at the genus level. A dot size increase is representative of lower p-values. Log2(FC) values range from gray (lower) to red (higher). Increased and decreased VOC concentrations are relative to the first comparison member, i.e., Group II versus Group I (A). (B) Pairwise comparison between Group III and Group I samples.
Figure 10
Figure 10
Statistically significant taxa volcano plot. Fold change analysis was joined with a Welch’s corrected test (BH multiple correction) based on taxa at the genus level. A dot size increase is representative of lower p-values. Log2(FC) values range from gray (lower) to red (higher). Increased and decreased VOC concentrations are relative to the first comparison member, i.e., Group II (A) versus Group I (B) pairwise comparison between Group III and Group II samples. (C) Comparison between Group II and Group I samples.
Figure 11
Figure 11
Pearson’s correlations among the VOC, taxa, and clinical variables. Statistically significant VOC (black), clinical/anthropometrical (dark orange), and taxa (dark green) variable sets have been correlated via a Pearson’s test. Only inter-group variable correlations with a p-value equal/lower than 0.05 have been shown, and only correlations greater than 0.6 were flagged in bold black font. Positive and negative correlations were reported as red and blue bubbles, respectively. Based on inter- and intra-group variable comparison (taxa, VOC, and clinical variables), bubbles were placed on a light aqua or yellow background.

References

    1. Tremmel M., Gerdtham U.G., Nilsson P.M., Saha S. Economic Burden of Obesity: A Systematic Literature Review. Int. J. Environ. Res. Public Health. 2017;14:435. doi: 10.3390/ijerph14040435. - DOI - PMC - PubMed
    1. Hebebrand J., Volckmar A.L., Knoll N., Hinney A. Chipping away the ‘missing heritability’: GIANT steps forward in the molecular elucidation of obesity—But still lots to go. Obes. Facts. 2010;3:294–303. doi: 10.1159/000321537. - DOI - PMC - PubMed
    1. Albuquerque D., Nobrega C., Manco L., Padez C. The contribution of genetics and environment to obesity. Br. Med. Bull. 2017;123:159–173. doi: 10.1093/bmb/ldx022. - DOI - PubMed
    1. Ellulu M.S., Patimah I., Khaza’ai H., Rahmat A., Abed Y. Obesity and inflammation: The linking mechanism and the complications. Arch. Med. Sci. 2017;13:851–863. doi: 10.5114/aoms.2016.58928. - DOI - PMC - PubMed
    1. Kolb H. Obese visceral fat tissue inflammation: From protective to detrimental? BMC Med. 2022;20:494. doi: 10.1186/s12916-022-02672-y. - DOI - PMC - PubMed