. 2024 Dec 28;17(1):82.
doi: 10.3390/nu17010082.

Folic Acid and Methyltetrahydrofolate Supplementation in the Mthfr677C>T Mouse Model with Hepatic Steatosis

Affiliations

Folic Acid and Methyltetrahydrofolate Supplementation in the Mthfr677C>T Mouse Model with Hepatic Steatosis

Karen E Christensen et al. Nutrients. .

Abstract

Background/objectives: The MTHFR677C>T gene variant results in a thermolabile MTHFR enzyme associated with elevated plasma homocysteine in TT individuals. Health risks associated with the TT genotype may be modified by dietary and supplemental folate intake. Supplementation with methyltetrahydrofolate (methylTHF) may be preferable to folic acid because it is the MTHFR product, and does not require reduction by DHFR to enter one-carbon folate metabolism. In the Mthfr677C>T mouse model for this variant, female 677TT (TT) mice have an increased incidence of hepatic steatosis. The objective of this study was to compare the effects of methylTHF and folic acid supplementation on hepatic steatosis and one-carbon metabolism in this model.

Methods: Male and female C57BL/6J 677CC (CC) and TT mice were fed control (CD), 5xmethylTHF-supplemented (MFSD), or 5xfolic-acid-supplemented (FASD) diets for 4 months. Liver sections were assessed for steatosis by Oil Red O staining. One-carbon metabolites were measured in the liver and plasma. MTHFR protein expression was evaluated in the liver.

Results: MFSD had no significant effect on plasma homocysteine, liver SAM/SAH ratios, or hepatic steatosis in males or females as compared to CD. MTHFR protein increased in MFSD TT female liver, but remained <50% of the CC. FASD had no effect on plasma homocysteine but it decreased the liver MTHFR protein and SAM/SAH ratios, and increased hepatic steatosis in CC females.

Conclusions: MethylTHF and folic acid supplementation had limited benefits for TT mice, while folic acid supplementation had negative effects on CC females. Further investigation is required to determine if these effects are relevant in humans.

Keywords: MTHFR; folic acid; hepatic steatosis; methyltetrahydrofolate; mouse model; supplementation.


Conflict of interest statement

The authors declare no conflicts of interest.

Figures

Figure 1
Figure 1
Mthfr677C>T mouse TT protein is stabilized by FAD and folates. Activity after heating, expressed as percent activity of CC samples at 0 μM, after pre-incubation with (A) FAD (pFAD = 0.043, pTT = 0.0004, pinteraction = 0.0055), (B) methylTHF (pmethylTHF = 0.0017, pTT < 0.0001, pinteraction = 0.079), and (C) THF (pTHF = 0.038, pTT = 0.0002, pinteraction = 0.045). 3-4 biological replicates per group, assayed in duplicate; 2-way repeated-measures ANOVA, Šidák post hoc * p < 0.05, ** p < 0.005, *** p < 0.001.
Figure 2
Figure 2
Effects of diet and genotype on plasma folates and total homocysteine (tHcy). In females: (A) methylTHF (pTT = 0.0004, pdiet < 0.0001, pinteraction = 0.82), (B) unmetabolized folic acid (pTT = 0.46, pdiet < 0.0001, pinteraction = 0.23), (C) tHcy (pTT = 0.0006, pdiet = 0.71, pinteraction = 0.26). In males: (D) 5-methyltetrahydrofolate (methylTHF; pTT < 0.0001, pdiet < 0.0001, pinteraction = 0.067), (E) unmetabolized folic acid (pTT = 0.57, pdiet < 0.0001, pinteraction = 0.18), and (F) total homocysteine (tHcy; pTT < 0.0001, pdiet = 0.86, pinteraction = 0.77). n = 5–6/group; 2-way ANOVA, Tukey post hoc: * CC vs. TT: * p < 0.05, ** p < 0.005, **** p < 0.0001; # diet comparison: # p < 0.05, ## p < 0.005, ### p < 0.001, #### p < 0.0001. Control diet (CD): white bars; methylfolate-supplemented diet (MFSD): light grey bars; folic-acid-supplemented diet (FASD): dark grey bars.
Figure 3
Figure 3
Steatosis in female mice is affected by folate intake and 677TT genotype. (A) Degree of steatosis was scored as % area affected of Oil-Red-O-fixed-frozen sections by 2 blinded observers. Representative sections are shown (scale bar: 300 μm). (B) Effect of genotype and diet on steatosis in female mice. pTT = 0.050, pMFSD = 0.56, pFASD = 0.013, pTT x MFSD = 0.78, pTT x FASD = 0.015. n = 7–10/group; ordinal logistic regression, post hoc by mvt. * CC vs. TT, p < 0.05; # diet comparison, p < 0.05. (C) Steatosis scoring in female mice was confirmed by liver triglyceride content. n = 7–10 per diet–genotype group; p = 0.0012, 1-way ANOVA. CD: control diet; MFSD: methylfolate-supplemented diet; FASD: folic-acid-supplemented diet.
Figure 4
Figure 4
Effects of diets and genotype on MTHFR protein expression in female liver. The more active unphosphorylated 70 kDa isoform is indicated by 70, and the phosphorylated form by P-70. (A) MTHFR expression normalized to actin, in CD and MFSD females (pTT < 0.0001, pMFSD = 0.14, pinteraction = 0.31). (B) % unphosphorylated 70 kDa isoform in total MTHFR in CD and MFSD females (pTT = 0.0009, pMFSD = 0.0005, pinteraction = 0.59). (C) Representative blot for panels a and b. (D) MTHFR expression normalized to actin, in CD and FASD females (pTT < 0.0001, pFASD < 0.0001, pinteraction < 0.0001). (E) % unphosphorylated 70 kDa isoform in total MTHFR in CD and FASD females (pTT =0.008, pFASD = 0.0071, pinteraction = 0.049). (F) Representative blot for panels D and E. n = 8–9/group; 2-way ANOVA, Tukey post hoc: * CC vs. TT: * p < 0.05, ** p < 0.005, **** p < 0.0001. # diet: # p < 0.05, ## p < 0.005, #### p < 0.0001. Control diet (CD): white bars; methylfolate-supplemented diet (MFSD): light grey bars; folic-acid-supplemented diet (FASD): dark grey bars.
Figure 5
Figure 5
Effects of diet and genotype on MTHFR protein expression in male liver. The more active unphosphorylated 70 kDa isoform is indicated by 70, and the phosphorylated form by P-70. (A) MTHFR expression normalized to actin, in CD and MFSD males (pTT < 0.0001, pMFSD = 0.41, pinteraction = 0.31). (B) % unphosphorylated 70 kDa isoform in total MTHFR in CD and MFSD males (pTT < 0.0001, pMFSD = 0.0037, pinteraction = 0.51). (C) Representative blot for panels a and b. (D) MTHFR expression normalized to actin, in CD and FASD males (pTT < 0.0001, pMFSD = 0.21, pinteraction = 0.81). (E) % unphosphorylated 70 kDa isoform in total MTHFR in CD and FASD males (pTT =0.0040, pFASD = 0.23, pinteraction = 0.032). (F) Representative blot for panels D and E. n = 8–9/group; 2-way ANOVA, Tukey post hoc: * CC vs. TT: * p < 0.05, ** p < 0.005. # diet: # p < 0.05. Control diet (CD): white bars; methylfolate- supplemented diet (MFSD): light grey bars; folic-acid-supplemented diet (FASD): dark grey bars.
Figure 6
Figure 6
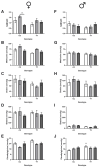
Effects of diet and genotype on methylation metabolites in liver. In females: (A) S-adenosylmethionine/S-adenosylhomocysteine (SAM/SAH, a measure of methylation potential; pTT = 0.27, pdiet = 0.022, pinteraction = 0.086), (B) methionine (product of Hcy remethylation, used to make SAM; pTT = 0.029, pdiet = 0.0062, pinteraction = 0.66), (C) choline (methyl donor for Hcy remethylation via betaine; pTT = 0.063, pdiet = 0.74, pinteraction = 0.71), (D) betaine (methyl donor derived from choline; pTT = 0.93, pdiet =0.43, pinteraction = 0.79), (E) dimethylglycine (product of Hcy remethylation by betaine; pTT = 0.054, pdiet =0.021, pinteraction = 0.48). In males: (F) SAM/SAH (pTT = 0.32, pdiet = 0.92, pinteraction = 0.19), (G) methionine (pTT = 0.054, pdiet =0.55, pinteraction = 0.75), (H) choline (pTT = 0.032, pdiet =0.97, pinteraction = 0.43), (I) betaine (pTT = 0.029, pdiet =0.51, pinteraction = 0.34), and (J) dimethylglycine (pTT = 0.031, pdiet =0.67, pinteraction = 0.056). n = 5–6/group; 2-way ANOVA, Tukey post hoc: * CC vs. TT, p < 0.05; # MFSD vs. FASD, p < 0.05. Control diet (CD): white bars; methylfolate-supplemented diet (MFSD): light grey bars; folic-acid-supplemented diet (FASD): dark grey bars.

Similar articles

Cited by

References

    1. Trimmer E.E. Methylenetetrahydrofolate reductase: Biochemical characterization and medical significance. Curr. Pharm. Des. 2013;19:2574–2593. doi: 10.2174/1381612811319140008. - DOI - PubMed
    1. Molloy A.M., Pangilinan F., Brody L.C. Genetic Risk Factors for Folate-Responsive Neural Tube Defects. Annu. Rev. Nutr. 2017;37:269–291. doi: 10.1146/annurev-nutr-071714-034235. - DOI - PubMed
    1. Luo Z., Lu Z., Muhammad I., Chen Y., Chen Q., Zhang J., Song Y. Associations of the MTHFR rs1801133 polymorphism with coronary artery disease and lipid levels: A systematic review and updated meta-analysis. Lipids Health Dis. 2018;17:191. doi: 10.1186/s12944-018-0837-y. - DOI - PMC - PubMed
    1. Zhao L., Li T., Dang M., Li Y., Fan H., Hao Q., Song D., Lu J., Lu Z., Jian Y., et al. Association of methylenetetrahydrofolate reductase (MTHFR) rs1801133 (677C>T) gene polymorphism with ischemic stroke risk in different populations: An updated meta-analysis. Front. Genet. 2022;13:1021423. doi: 10.3389/fgene.2022.1021423. - DOI - PMC - PubMed
    1. Liew S.C., Gupta E.D. Methylenetetrahydrofolate reductase (MTHFR) C677T polymorphism: Epidemiology, metabolism and the associated diseases. Eur. J. Med. Genet. 2015;58:1–10. doi: 10.1016/j.ejmg.2014.10.004. - DOI - PubMed

MeSH terms

LinkOut - more resources