. 2024 Dec 31;17(1):150.
doi: 10.3390/nu17010150.

Cell Membrane Fatty Acids and PIPs Modulate the Etiology of Pancreatic Cancer by Regulating AKT

Affiliations

Cell Membrane Fatty Acids and PIPs Modulate the Etiology of Pancreatic Cancer by Regulating AKT

Carolina Torres et al. Nutrients. .

Abstract

Background: Pancreatic ductal adenocarcinoma (PDAC) is one of the worst solid malignancies in regard to outcomes and metabolic dysfunction leading to cachexia. It is alarming that PDAC incidence rates continue to increase and warrant the need for innovative approaches to combat this disease. Due to its relatively slow progression (10-20 years), prevention strategies represent an effective means to improve outcomes. One of the risk factors for many cancers and for pancreatic cancer in particular is diet. Hence, our objective is to understand how a diet rich in ω3 and ω6 polyunsaturated fatty acids affects the progression of this disease. Methods: We investigated polyunsaturated fatty acid (PUFA) effects on disease progression employing both in vitro (PDAC cell lines) and in vivo (EL-Kras and KC mice) approaches. Also, we gathered data from the National Health and Nutrition Examination Survey (NHANES) and the National Cancer Institute (NCI) from 1999 to 2017 for a retrospective observational study. Results: The consumption of PUFAs in a patient population correlates with increased PDAC incidence, particularly when the ω3 intake increases to a lesser extent than ω6. Our data demonstrate dietary PUFAs can be incorporated into plasma membrane lipids affecting PI3K/AKT signaling and support the emergence of membrane-targeted therapies. Moreover, we show that the phospholipid composition of a lipid nanoparticle (LNP) can impact the cell membrane integrity and, ultimately, cell viability after administration of these LNPs. Conclusions: Cancer prevention is impactful particularly for those with very poor prognosis, including pancreatic cancer. Our results point to the importance of dietary intervention in this disease when detected early and the potential to improve the antiproliferative effect of drug efficacy when combined with these regimens in later stages of pancreatic cancer.

Keywords: PDAC; PI3K/AKT; PIP2 (phosphatidylinositol 4,5-bisphosphate); PIP3 (phosphatidylinositol (3,4,5)-trisphosphate); diet; polyunsaturated fatty acids; prevention.


Conflict of interest statement

All authors certify that they have NO affiliations with or involvement in any organization or entity with any financial interest or nonfinancial interest in the subject matter or materials discussed in this manuscript.

Figures
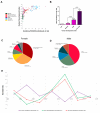
Figure 1
Figure 1
PDAC incidence correlates with ω6 PUFA consumption. (A) Pancreatic cancer incidence (crude rate) as a function of the Human Development Index (HDI). For a specific tumor in a given population, crude rates are calculated simply by dividing the number of new cancers or cancer deaths observed during a given time period by the corresponding number of individuals in the population at risk. For cancer, the result is commonly expressed as an annual rate per 100,000 individuals at risk. (B) PDAC incidence (crude rate) is rated by the 4-tier Human Development Index (HDI Low (<0.550); Medium (0.550–0.699); High (0.700–0.799); Very high (>0.800)) based on the United Nation’s 2019 Human Development Report. Cancer cases (at all anatomical sites) among females (C) and males (D) worldwide attributable to excess body mass index are shown by anatomical site as a percentage of the total number of all such attributable cases at all anatomical sites in the studied population. (E) Incidence of PDAC in relation to the consumption of PUFAs in the period of time from 1998 to 2018. Grams of both fats consumed were summed and averaged per year. Data show the percentage of increase for both the consumption of PUFAs (2 years before) and incidence. Asterisks in the graphs above a group define significance against the SD control: ** p < 0.005; *** p < 0.0005. Bars indicate significant differences between two groups. Results are expresses as mean ± standard deviation (SD).
Figure 2
Figure 2
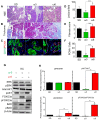
Dietary PUFAs influence the progression of pancreatic neoplasm. KC mice were fed with the standard diet (SD), ω3 (menhaden)-, or ω6 (safflower)-enriched diets (n = 5) for 9 months. (A) Representative H&E images of each diet group and the number of lesions were counted per high power field of 5 different fields of view and averaged (10×). (B) Representative images of trichrome staining for each diet group and corresponding fibrosis score (5 different fields of view, 20×)). (C) Representative images of PCNA and CK-19 double staining with quantitation of the number of positive PCNA nuclei per high power field (5 different fields of view, 40×). (DF) The pancreata from KC mice were evaluated by H&E and scored by two independent investigators (CT and GM) for the total number of PanIN lesions (D), fibrosis (E), and proliferation (F), counted per high power field of 5 different fields of view and averaged. (G) Western blot images of KC mice pancreata on each diet probing for total and phosphorylated ERK and AKT proteins. Downstream regulators of the AKT pathway were also probed, including total and phosphorylated Foxo3a and BAD proteins. B-actin used as a loading control. (H) Averaged quantification of the replicates performed by immunoblotting, relative to the β-actin expression level. The bar graphs represent the ratio of phosphorylated protein to its non-phosphorylated form, which serves as an indicator of activation. Quantification was done using the ImageJ (NIH) software. All the images are representative of the averaged results of the scoring of KC (n = 5). Asterisks in the graphs above a group define significance against the SD control: * p < 0.05; ** p < 0.005; *** p < 0.0005. Bars indicate significant differences between two groups. Results are expressed as the mean ± standard deviation (SD).
Figure 3
Figure 3
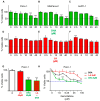
Exogenous supplementation of PUFAs in vitro modulates the viability of pancreatic cancer cells. Pancreatic cancer cell lines Panc-1 (A), MiaPaca-2 (B), and AsPC-1 (C) were incubated for 48 h with increasing doses of DHA, and cell viability was determined by MTT assay. Pancreatic cancer cell lines Panc-1 (D), MiaPaca-2 (E), and AsPC-1 (F) were incubated for 48 h with increasing doses of LA, and cell viability was determined by MTT assay. All the assays were performed in triplicate and averaged. (G) The Panc-1 cell line was cultured with the same amount of DHA and LA (1:1 ratio) for 48 h, and viability was determined by MTT. (H) The Panc-1 cell line was cultured with increasing concentrations of the drug gemcitabine (0–100 µM) with or without the addition of one of the fatty acids (5 µM). The treatment was maintained for 48 h, and the viability was determined by MTT. Asterisks above a group define significance against the corresponding untreated control: * p < 0.05; ** p < 0.005; *** p < 0.0005. Results are expressed as the mean ± standard deviation (SD).
Figure 4
Figure 4
Exogenous supplementation of PUFAs in vitro modulates the AKT pathway in pancreatic cancer cells. pAKT/AKT Western blot analysis of Panc-1 (A), MiaPaca-2 (B), and AsPC-1 (C) incubated for 48 h with increasing concentrations of DHA and Panc-1 (D), MiaPaca-2 (E), and AsPC-1 (F) incubated for 48 h with increasing concentrations of LA. (GI) Averaged ratio of phosphorylated AKT (pAKT) to total AKT (pAKT/AKT) for each cell line and treatment, representing the level of AKT activation under the specified conditions. Western blot images of Panc-1 (J), MiaPaca-2 (K), and AsPC-1 (L) cells treated with 40 μM of DHA or LA probing for pAKT/AKT and key regulators of AKT, including PI3 K, PTEN, PDK1, and BAD. Quantification of the replicates performed by immunoblotting, relative to the GAPDH expression level. Quantification was done using ImageJ (NIH) software. All the images are representative of the averaged results of the scoring (n = 3). Asterisks above a group define significance against the corresponding untreated control: * p < 0.05. Results are expressed as the mean ± standard deviation (SD).
Figure 5
Figure 5
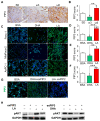
Dietary PUFAs modify the PIP2/PIP3 ratio in the membrane affecting AKT signaling. (A) Representative PIP3 IHC images of EK mice pancreata fed normal, ω3-, or ω6-enriched diets (n = 4). (B) PIP3 expression score from 0 to 3+, with 0 as no detectable immunostaining, 1 as 10–30% immunostaining, 2 as 30–60%, and 3 as >60%. The numerical score represents the average of 2 independent investigators. (C) Representative images of PIP3 immunocytochemical staining of PDAC cell lines incubated with DHA or LA at 40 µM for 48 h. PIP3 immunostaining score of (D) Panc-1, (E) MiaPaca-2, and (F) AsPC-1 cells. Staining was scored from 0 to 3+, with 0 as no detectable immunostaining, 1 as 10–30% immunostaining, 2 as 30–60%, and 3 as >60%. (G) Representative images of PIP3 immunocytochemical staining of the Panc-1 cell line incubated with BSA (left image), DHA 40 µM combined with 1 µM of exogenous PIP3 (middle image), and LA 40 µM combined with 1 µM of exogenous PIP2 (n = 3). (H) Western blot images of the Panc-1 pAKT levels after the exogenous supplementation of PIP2 and PIP3 to the PUFAs treatment. Results are expressed as the mean ± standard deviation (SD). Asterisks above a group define significance against the corresponding untreated control: * p < 0.05; ** p < 0.005; *** p < 0.0005. Results are expressed as mean ± standard deviation (SD).
Figure 6
Figure 6
Dietary PUFAs modify PIP3 localization in the membrane, affecting AKT signaling, and exogenous PUFA administration by lipid nanoparticles (LNPs) improves PUFA delivery to the membranes. (A) Representative images of Panc-1 cells expressing the PH-BtK-EGF fusion protein (PIP3 biosensor) and incubated with 40 µM of DHA and LA. GFP (PIP3) expression was assessed with a confocal microscope. White arrows point to GFP-enriched spots at the plasma membrane. (B) Percentage of cells with membrane-positive staining relative to the total number of green cells (4 different fields of view, 20×). (C) Panc-1 cells transfected with GFP-C1-PLCdelta-PH were incubated with DHA and LA 40 µM for 48 h and subjected to immunoprecipitation. Western blot images of PI3k-alpha pulled down with GFP antibody to assess the binding of PI3K to PIP3. (D) Quantification of the replicates performed by immunoblotting. Quantification was done using ImageJ (NIH) software. All the images are representative of the averaged results of the scoring (n = 2). (E) The Panc-1 cell line was incubated with a lipid nanoparticle formulation (LNP) consisting of 90% GMO and 10% cholesterol with 40 µM DHA. The BSA group represents the control group treated with DHA bound to BSA (BSA.DHA) as a carrier. The LNP group represents the group treated with DHA encapsulated in LNP (LNP-DHA). Western blot images probing for total and phosphorylated AKT proteins. GAPDH was used as a loading control. (F) Quantification of the replicates performed by immunoblotting relative to the GAPDH expression level. (G) Representative images of confocal microscopy of Panc-1 cells treated with the complex BSA-DHA and with the complex LNP-DHA. Fatty acids are shown in red, LNP are shown in green, and the nucleus in blue. Asterisks in the graphs above a group define significance against the normal diet control: * p < 0.05; *** p < 0.0005. Bars indicate significant differences between two groups. Results are expressed as the mean ± standard deviation (SD).

References

    1. Abdilleh K., Khalid O., Ladnier D., Wan W., Seepo S., Rupp G., Corelj V., Worman Z.F., Sain D., DiGiovanna J., et al. Pancreatic Cancer Action Network’s SPARK: A Cloud-Based Patient Health Data and Analytics Platform for Pancreatic Cancer. JCO Clin. Cancer Inform. 2024;8:e2300119. doi: 10.1200/CCI.23.00119. - DOI - PMC - PubMed
    1. Rahib L., Smith B.D., Aizenberg R., Rosenzweig A.B., Fleshman J.M., Matrisian L.M. Projecting Cancer Incidence and Deaths to 2030: The Unexpected Burden of Thyroid, Liver, and Pancreas Cancers in the United States. Cancer Res. 2014;74:2913–2921. doi: 10.1158/0008-5472.CAN-14-0155. - DOI - PubMed
    1. Kleeff J., Korc M., Apte M., La Vecchia C., Johnson C.D., Biankin A.V., Neale R.E., Tempero M., Tuveson D.A., Hruban R.H., et al. Pancreatic Cancer. Nat. Rev. Dis. Primers. 2016;2:16022. doi: 10.1038/nrdp.2016.22. - DOI - PubMed
    1. Maitra A., Hruban R.H. Pancreatic Cancer. Annu. Rev. Pathol. 2008;3:157–188. doi: 10.1146/annurev.pathmechdis.3.121806.154305. - DOI - PMC - PubMed
    1. Yachida S., Jones S., Bozic I., Antal T., Leary R., Fu B., Kamiyama M., Hruban R.H., Eshleman J.R., Nowak M.A., et al. Distant Metastasis Occurs Late during the Genetic Evolution of Pancreatic Cancer. Nature. 2010;467:1114–1117. doi: 10.1038/nature09515. - DOI - PMC - PubMed

MeSH terms

Substances

LinkOut - more resources