Exploring the Role of Glycine Metabolism in Coronary Artery Disease: Insights from Human Genetics and Mouse Models
- PMID: 39796632
- PMCID: PMC11723402
- DOI: 10.3390/nu17010198
Exploring the Role of Glycine Metabolism in Coronary Artery Disease: Insights from Human Genetics and Mouse Models
Abstract
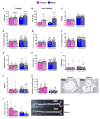
Background: Circulating glycine levels have been associated with reduced risk of coronary artery disease (CAD) in humans but these associations have not been observed in all studies. We evaluated whether the relationship between glycine levels and atherosclerosis was causal using genetic analyses in humans and feeding studies in mice. Methods: Serum glycine levels were evaluated for association with risk of CAD in the UK Biobank. Genetic determinants of glycine levels were identified through a genome-wide association study (GWAS) and used to evaluate the causal relationship between glycine and risk of CAD by Mendelian randomization (MR). A dietary supplementation study was carried out with atherosclerosis-prone apolipoprotein E deficient (ApoE-/-) mice to determine the effects of increased circulating glycine levels on cardiometabolic traits and aortic lesion formation. Results: Among 105,718 UK Biobank subjects, elevated serum glycine levels were associated with significantly reduced risk of prevalent CAD (Quintile 5 vs. Quintile 1 OR = 0.76, 95% CI 0.67-0.87; p < 0.0001) and incident CAD (Quintile 5 vs. Quintile 1 HR = 0.70, 95% CI 0.65-0.77; p < 0.0001) after adjustment for age, sex, ethnicity, anti-hypertensive and lipid-lowering medications, blood pressure, kidney function, and diabetes. A GWAS meta-analysis with 230,947 subjects identified 61 loci for glycine levels, of which 26 were novel. MR analyses provided modest evidence that genetically elevated glycine levels were causally associated with reduced systolic blood pressure and risk of type 2 diabetes, but did not provide significant evidence for an association with decreased risk of CAD. Glycine supplementation in mice had no effects on cardiometabolic traits or atherosclerotic lesion development. Conclusions: While expanding the genetic architecture of glycine metabolism, MR analyses and in vivo feeding studies did not provide evidence that the clinical association of this amino acid with atherosclerosis represents a causal relationship.
Keywords: Mendelian randomization; atherosclerosis; coronary artery disease; dietary supplementation; genome-wide association study; glycine; mice.
Conflict of interest statement
The authors declare that they have no known competing financial interests or personal relationships that could have appeared to influence the work reported in this paper. Z.W. and S.L.H. are named as coinventors on pending and issued patents held by the Cleveland Clinic relating to cardiovascular diagnostics and therapeutics and have the right to receive royalty payment for inventions or discoveries related to cardiovascular diagnostics or therapeutics from Cleveland Heart Lab, Quest Diagnostics, and Procter & Gamble Company. S.L.H. also reports having been paid as a consultant from Procter & Gamble Company and having received research funds from Procter & Gamble Company and Roche. All other authors report no conflicts.
Figures


References
-
- Aragam K.G., Jiang T., Goel A., Kanoni S., Wolford B.N., Atri D.S., Weeks E.M., Wang M., Hindy G., Zhou W., et al. Discovery and systematic characterization of risk variants and genes for coronary artery disease in over a million participants. Nat. Genet. 2022;54:1803–1815. doi: 10.1038/s41588-022-01233-6. - DOI - PMC - PubMed
-
- Tcheandjieu C., Zhu X., Hilliard A.T., Clarke S.L., Napolioni V., Ma S., Lee K.M., Fang H., Chen F., Lu Y., et al. Large-scale genome-wide association study of coronary artery disease in genetically diverse populations. Nat. Med. 2022;28:1679–1692. doi: 10.1038/s41591-022-01891-3. - DOI - PMC - PubMed
MeSH terms
Substances
Grants and funding
- R01HL133169/GF/NIH HHS/United States
- P30 ES007048/ES/NIEHS NIH HHS/United States
- R01 HL103931/HL/NHLBI NIH HHS/United States
- U54 DK120342/DK/NIDDK NIH HHS/United States
- R01 HL133169/HL/NHLBI NIH HHS/United States
- R01HL168493/GF/NIH HHS/United States
- R01 HL148110/HL/NHLBI NIH HHS/United States
- U54HL170326/GF/NIH HHS/United States
- U54 HL170326/HL/NHLBI NIH HHS/United States
- R01HL14811/GF/NIH HHS/United States
- P01 HL147823/HL/NHLBI NIH HHS/United States
- P30ES007048/GF/NIH HHS/United States
- P01 HL076491/HL/NHLBI NIH HHS/United States
- P01 HL098055/HL/NHLBI NIH HHS/United States
- R01 HL168493/HL/NHLBI NIH HHS/United States
LinkOut - more resources
Full Text Sources
Medical
Miscellaneous

