

Characterization of Hazelnut Trees in Open Field Through High-Resolution UAV-Based Imagery and Vegetation Indices
- PMID: 39797079
- PMCID: PMC11723464
- DOI: 10.3390/s25010288
Characterization of Hazelnut Trees in Open Field Through High-Resolution UAV-Based Imagery and Vegetation Indices
Abstract
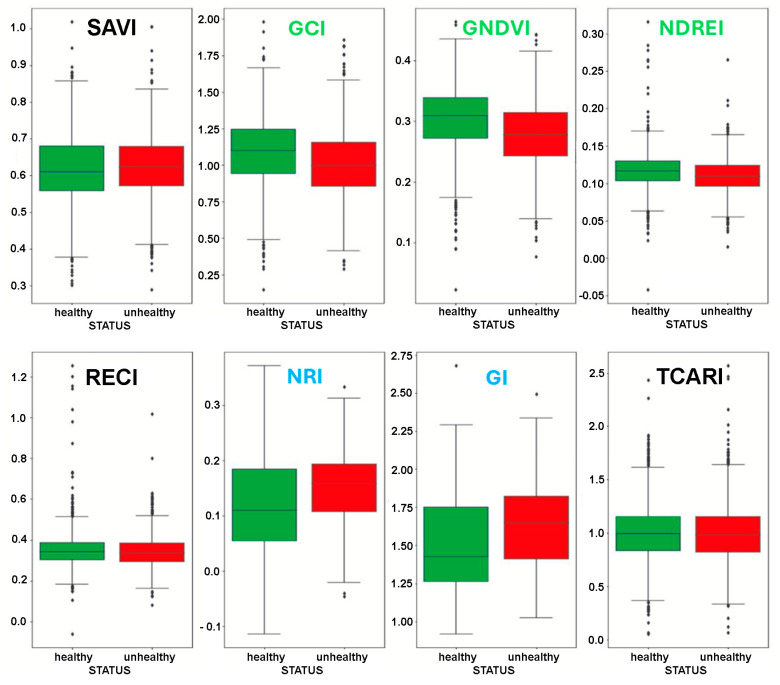
The increasing demand for hazelnut kernels is favoring an upsurge in hazelnut cultivation worldwide, but ongoing climate change threatens this crop, affecting yield decreases and subject to uncontrolled pathogen and parasite attacks. Technical advances in precision agriculture are expected to support farmers to more efficiently control the physio-pathological status of crops. Here, we report a straightforward approach to monitoring hazelnut trees in an open field, using aerial multispectral pictures taken by drones. A dataset of 4112 images, each having 2Mpixel resolution per tree and covering RGB, Red Edge, and near-infrared frequencies, was obtained from 185 hazelnut trees located in two different orchards of the Piedmont region (northern Italy). To increase accuracy, and especially to reduce false negatives, the image of each tree was divided into nine quadrants. For each quadrant, nine different vegetation indices (VIs) were computed, and in parallel, each tree quadrant was tagged as "healthy/unhealthy" by visual inspection. Three supervised binary classification algorithms were used to build models capable of predicting the status of the tree quadrant, using the VIs as predictors. Out of the nine VIs considered, only five (GNDVI, GCI, NDREI, NRI, and GI) were good predictors, while NDVI SAVI, RECI, and TCARI were not. Using them, a model accuracy of about 65%, with 13% false negatives was reached in a way that was rather independent of the algorithms, demonstrating that some VIs allow inferring the physio-pathological condition of these trees. These achievements support the use of drone-captured images for performing a rapid, non-destructive physiological characterization of hazelnut trees. This approach offers a sustainable strategy for supporting farmers in their decision-making process during agricultural practices.
Keywords: Corylus avellana; UAV; aerial photos; non-destructive analyses; phenotyping; vegetation indices.
Conflict of interest statement
The authors declare no conflicts of interest.
Figures


References
-
- Primicerio J., Caruso G., Comba L., Crisci A., Gay P., Guidoni S., Genesio L., Aimonino D.R., Vaccari F.P. Individual Plant Definition and Missing Plant Characterization in vineyards from High-Resolution UAV Imagery. Eur. J. Remote Sens. 2017;50:179–186. doi: 10.1080/22797254.2017.1308234. - DOI
-
- Comba L., Biglia A., Ricauda Aimonino D., Barge P., Tortia C., Gay P. Enhanced vineyard descriptors combining UAV 2D and 3D crop models; Proceedings of the AgEng 2018—New Engineering Concepts for Valued Agriculture; Wageningen, The Netherlands. 8–10 July 2018; [(accessed on 20 August 2022)]. pp. 49–56. Available online: https://hdl.handle.net/2318/1670903.
-
- Velusamy P., Rajendran S., Mahendran R.K., Naseer S., Shafiq M., Choi J.-G. Unmanned Aerial Vehicles (UAV) in Precision Agriculture: Applications and Challenges. Energies. 2022;15:217. doi: 10.3390/en15010217. - DOI
-
- Liu J., Xiang J., Jin Y., Liu R., Yan J., Wang L. Boost Precision Agriculture with Unmanned Aerial Vehicle Remote Sensing and Edge Intelligence: A Survey. Remote Sens. 2021;13:4387. doi: 10.3390/rs13214387. - DOI
-
- Xue J., Su B. Significant Remote Sensing Vegetation Indices: A Review of Developments and Applications. J. Sensors. 2017;2017:353691. doi: 10.1155/2017/1353691. - DOI
MeSH terms
Grants and funding
LinkOut - more resources
Full Text Sources
Research Materials
