Longitudinal analysis of anthropometric measures over 5 years in patients with Friedreich ataxia in the EFACTS natural history study
- PMID: 39797559
- PMCID: PMC11724196
- DOI: 10.1111/ene.70011
Longitudinal analysis of anthropometric measures over 5 years in patients with Friedreich ataxia in the EFACTS natural history study
Abstract
Background: Friedreich ataxia is a rare neurodegenerative disorder caused by frataxin deficiency. Both underweight and overweight occur in mitochondrial disorders, each with adverse health outcomes. We investigated the longitudinal evolution of anthropometric abnormalities in Friedreich ataxia and the hypothesis that both weight loss and weight gain are associated with faster disease progression.
Methods: Participants were drawn from the European Friedreich's Ataxia Consortium for Translational Studies (EFACTS). Age- and sex-specific BMI and height scores were calculated using the KIGGS-BMI percentiles for children. Height correction was applied for scoliosis. Longitudinal data were analysed using linear mixed effects models and incremental standard deviation scores and growth mixture models identified subclasses with varying BMI trajectories.
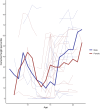
Results: Five hundred and forty-three adults and fifty-nine children were assessed for up to 5 years. In children, severe underweight (26%), underweight (7%), severe short stature (16%) and short stature (23%) were common. The corrected BMI percentile was stable in children, although 48% had negative incremental BMI scores over 1 year and 63% over 3 years versus 10%/year in a normal reference cohort. Overweight was common in adults (19%), with a slight increase in BMI over time. Longer GAA repeat size was linked to lower BMI in adults. Weight trajectory was not associated with ataxia progression in adults.
Conclusion: Significant anthropometric abnormalities were identified, with underweight and short stature prevalent in children and overweight in adults. These findings highlight the need for regular nutritional monitoring and interventions to manage underweight in children and promote healthy weight in adults.
Keywords: Friedreich ataxia; body height; body mass index; natural history; underweight.
© 2025 The Author(s). European Journal of Neurology published by John Wiley & Sons Ltd on behalf of European Academy of Neurology.
Conflict of interest statement
S.A. Lischewski has received speaker honoraria from Biogen. W. Nachbauer has received speaker and advisory honoraria from Biogen and Reata Pharmaceuticals. S. Boesch reports consultancies from VICO Therapeutics, Reata pharmaceuticals and Biogen, honoria from Ipsen, Merz, Abbvie and Reata and advisory boards for Biogen and Reata. L. Schöls received consultancies from VICO Therapeutics, Vigil Neuroscience and Novartis unrelated to this work. K. Konrad, C. Didszun, A. S. Costa, I. Dogan, S. A. Schawohl, P. Giunti, M. H. Parkinson, C. Mariotti, A. Durr, L. Nanetti, T. Klopstock, C. Ewenczyk, C. Stendel, F. J. Rodríguez de Rivera Garrido, Z. Fleszar, T. Klockgether, M. Grobe‐Einsler, I. Giordano, M. Rai, M. Pandolfo, J. B. Schulz and K. Reetz report no disclosures relevant to the manuscript.
Figures


References
MeSH terms
Grants and funding
LinkOut - more resources
Full Text Sources
Medical
Miscellaneous

