. 2025 Jan 23;129(3):762-773.
doi: 10.1021/acs.jpca.4c07439. Epub 2025 Jan 11.

Evaporation Kinetics and Final Particle Morphology of Multicomponent Salt Solution Droplets

Affiliations

Evaporation Kinetics and Final Particle Morphology of Multicomponent Salt Solution Droplets

Barnaby E A Miles et al. J Phys Chem A. .

Abstract

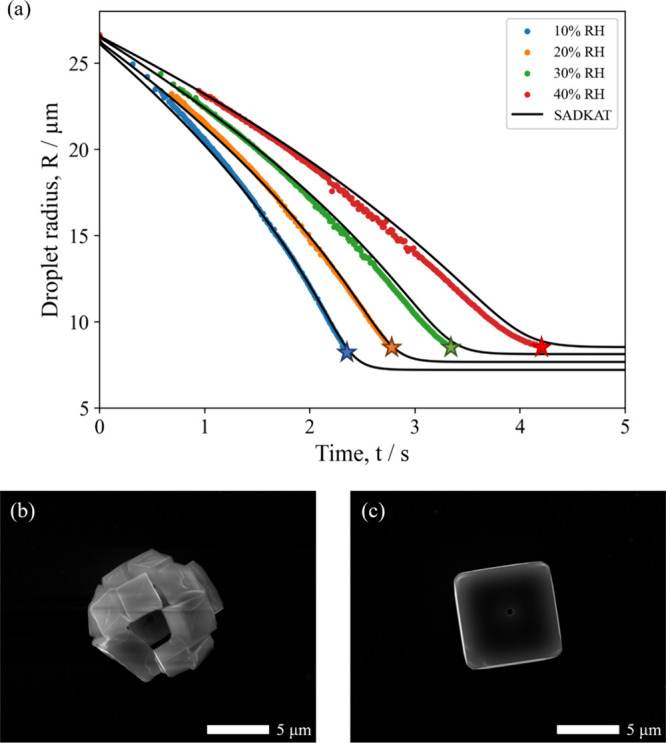
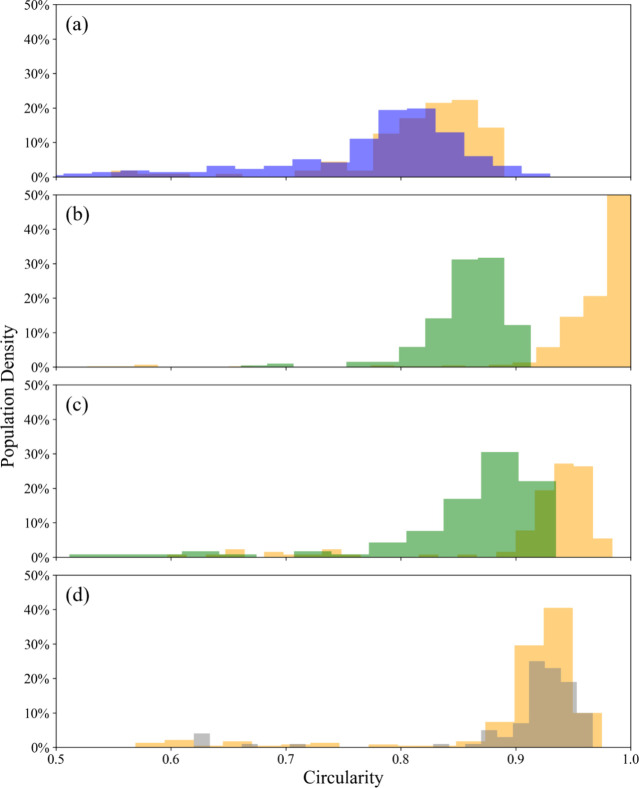
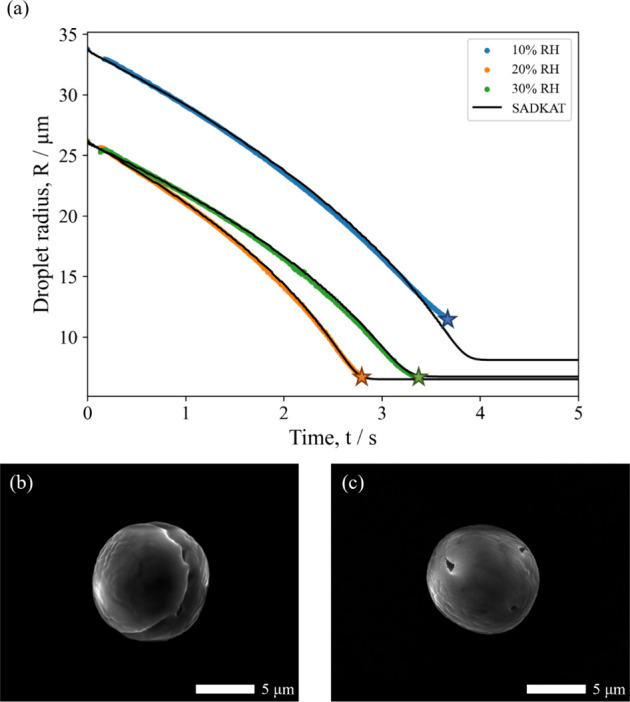
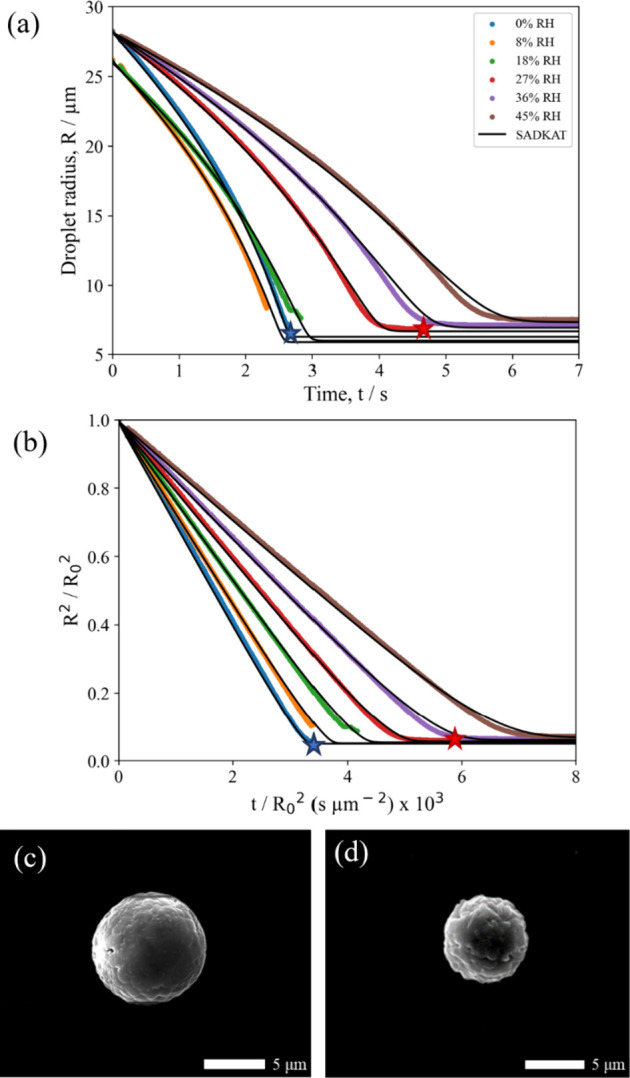
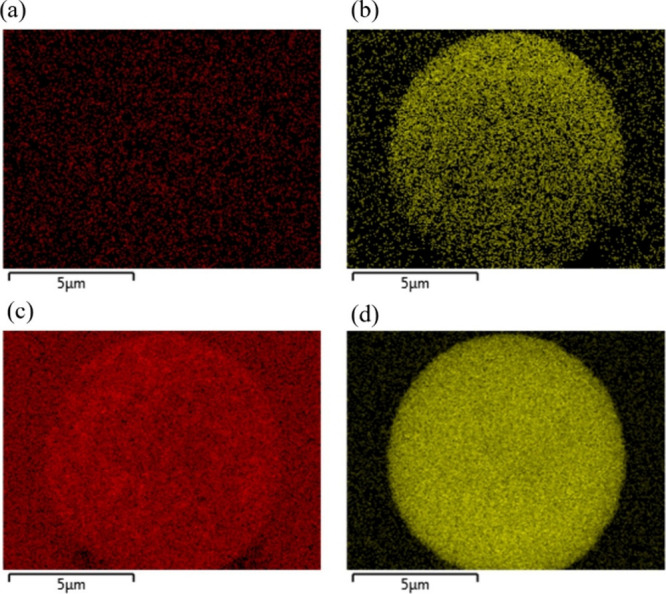
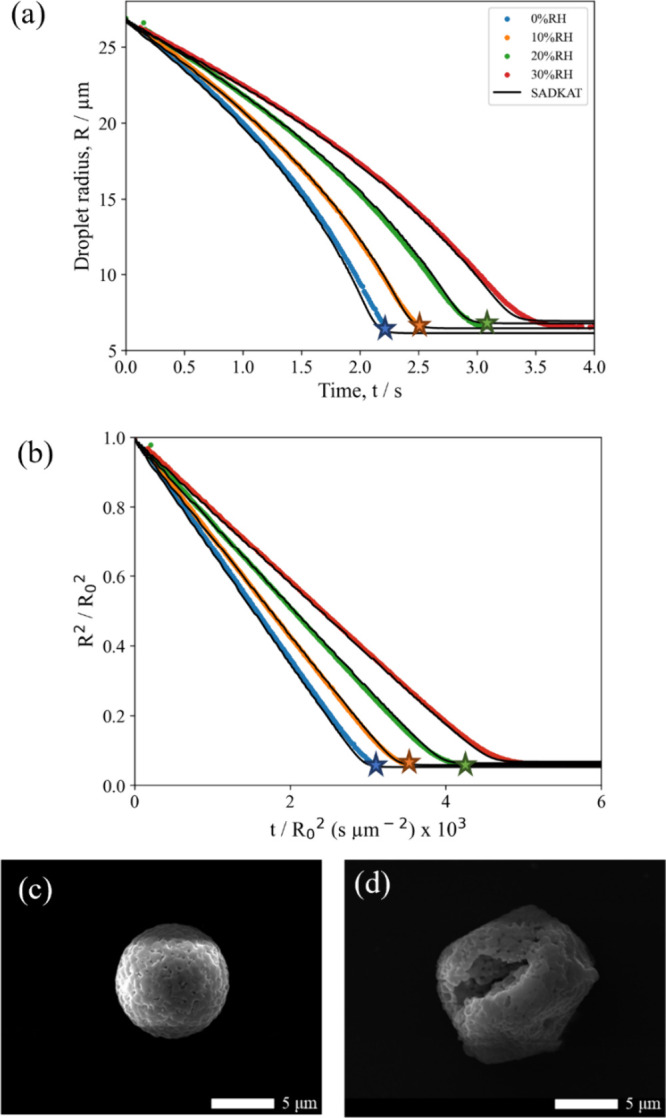
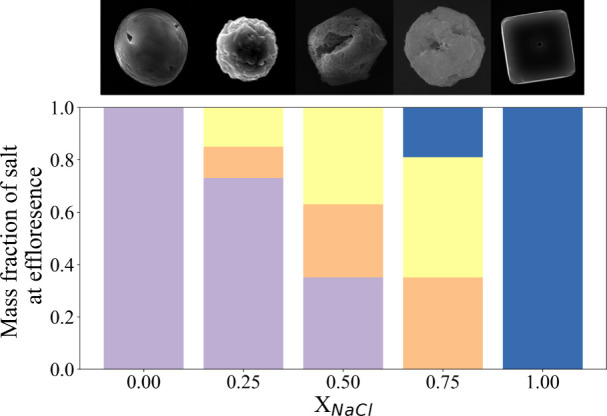
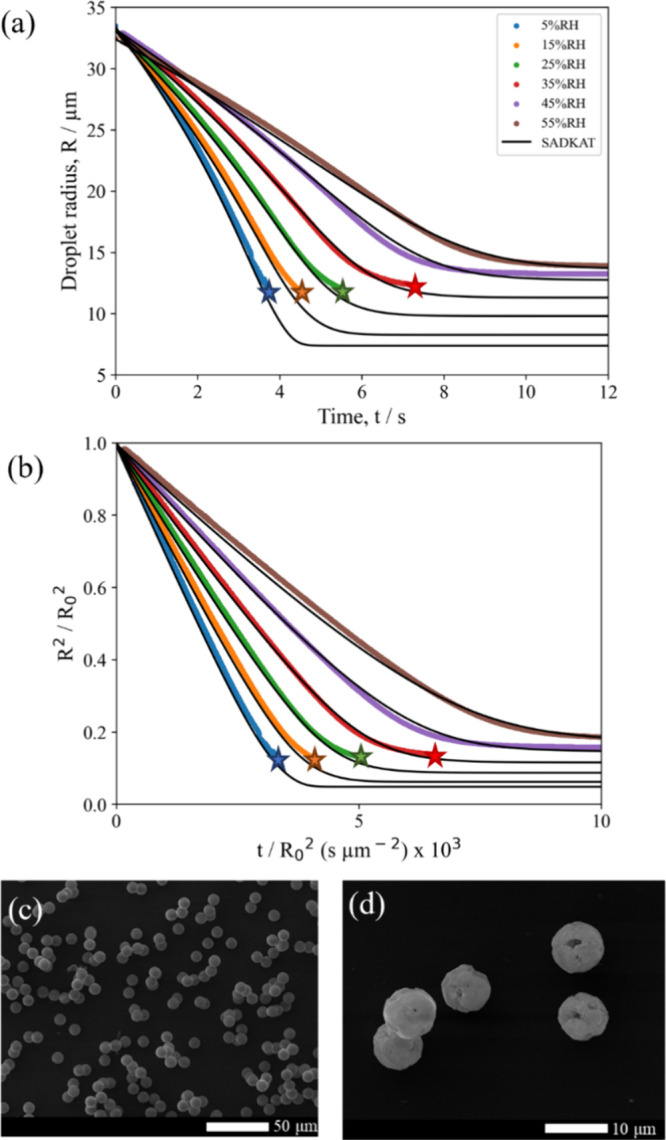
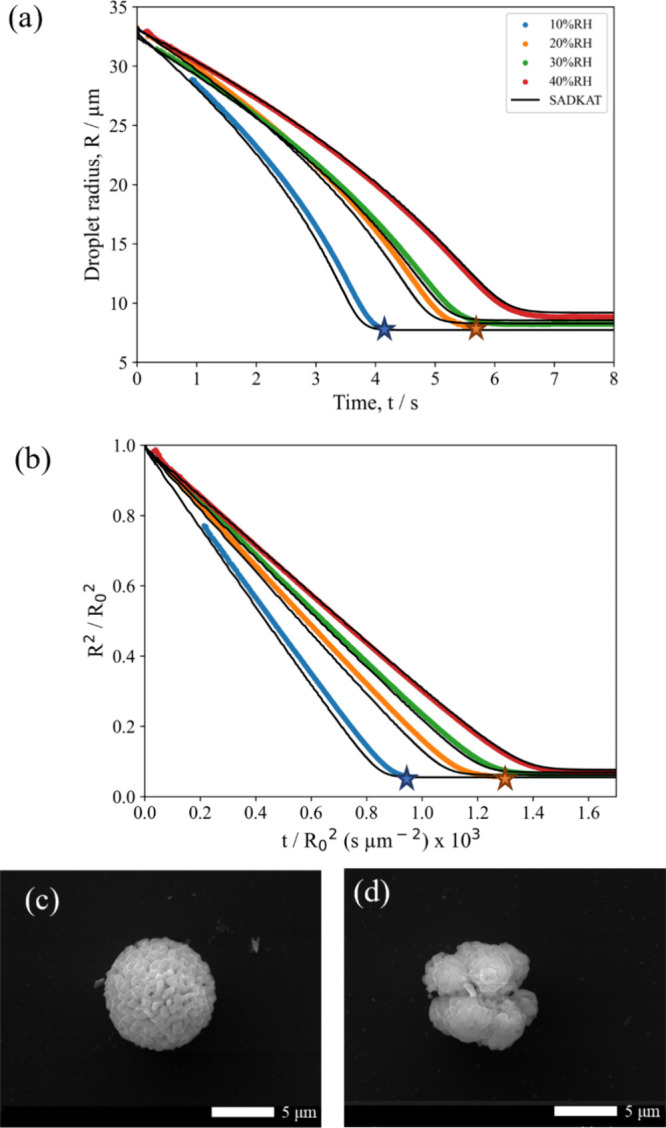
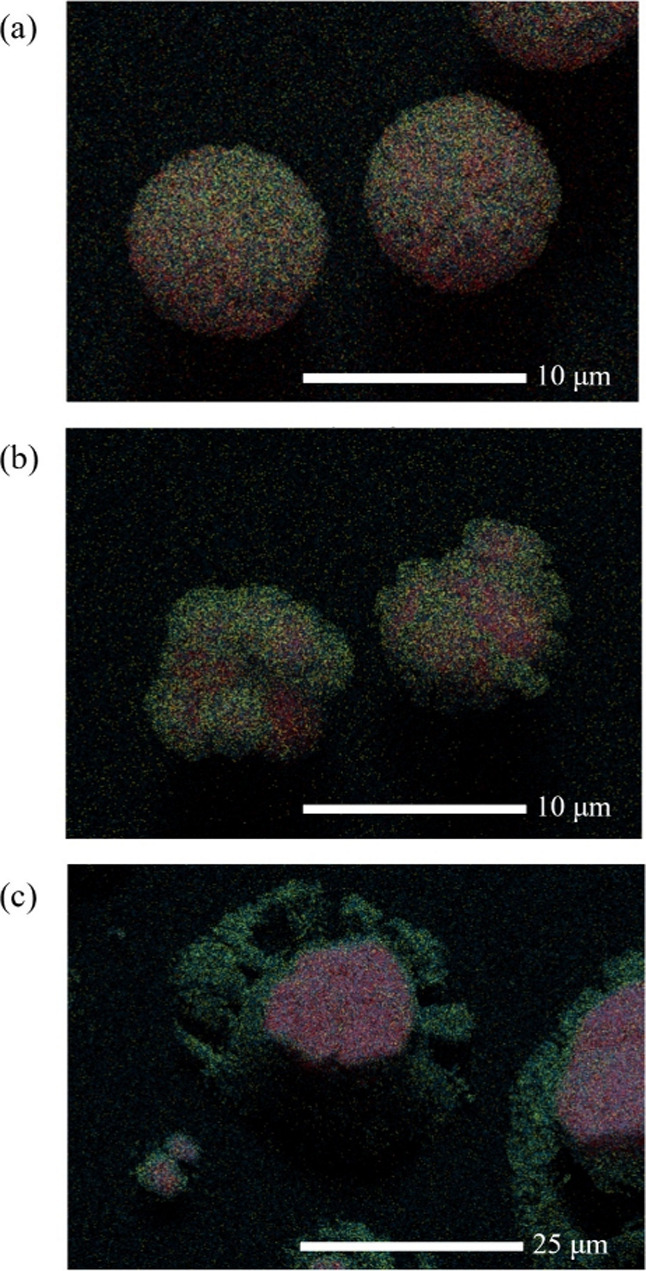
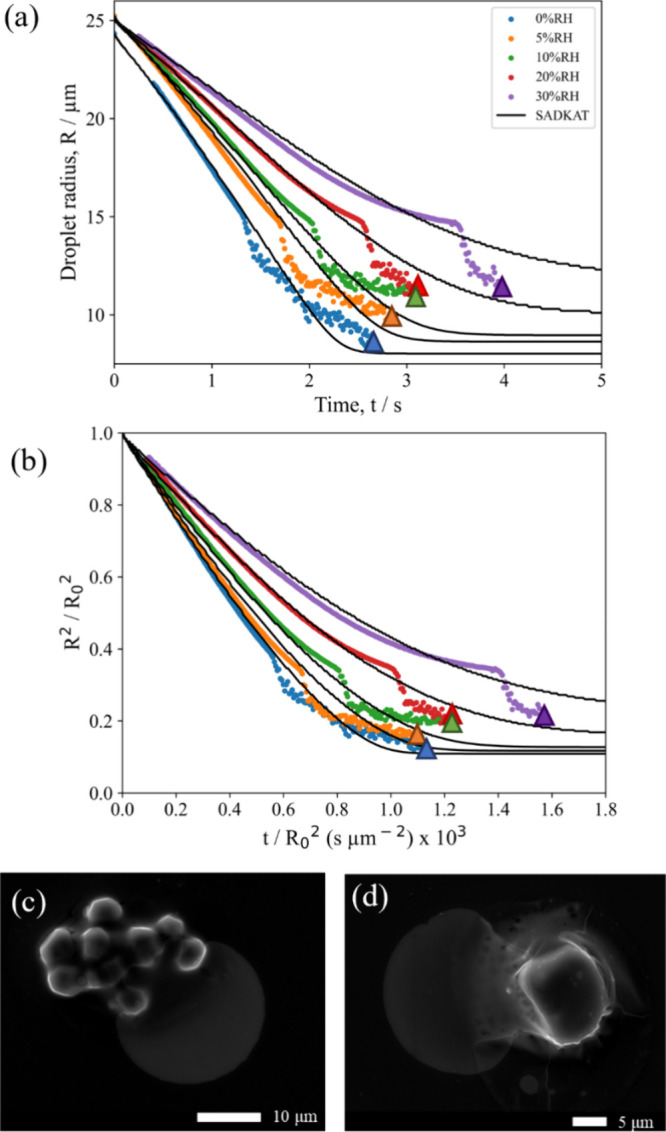
In both nature and industry, aerosol droplets contain complex mixtures of solutes, which in many cases include multiple inorganic components. Understanding the drying kinetics of these droplets and the impact on resultant particle morphology is essential for a variety of applications including improving inhalable drugs, mitigating disease transmission, and developing more accurate climate models. However, the previous literature has only focused on the relationship between drying kinetics and particle morphology for aerosol droplets containing a single nonvolatile component. Here we investigate the drying kinetics of NaCl-(NH4)2SO4, NaCl-NH4NO3, and NaCl-CaCl2 mixed salt aqueous aerosol droplets (25-35 μm radius) and the resulting morphology and composition of the dried microparticles. A comparative kinetics electrodynamic balance was used to measure evaporation profiles for each mixed salt aerosol at a range of relative humidities (RH) (0-50% RH); measurements of the evaporation kinetics are shown to be consistent with predictions from the "Single Aerosol Drying Kinetics and Trajectories" model. Populations of the mixed salt droplets were dried in a falling droplet column under different RH conditions and imaged using scanning electron microscopy to observe the impact of the drying kinetics on the morphology. Energy dispersive spectroscopy was used in tandem to obtain atomic maps and view the impact of drying kinetics on the composition of the resultant particles. It has been shown that the relationship between drying kinetics and dry particle morphology in mixed salt solution droplets is compositionally dependent and determined by the predominant salts that crystallize (i.e., (NH4)2SO4, Na2SO4, or NaCl). The degree of homogeneity in composition throughout the particle microstructure is dependent on the drying rate.

Keywords: aerosol; chloride; crystallization; drying; single-droplet; sulfate.


Conflict of interest statement

The authors declare no competing financial interest.

Figures

Figure 1
Figure 1
(a) Evaporation profiles for aqueous NaCl (0.02 MFS) droplets at varying RHs and 293.0 K compared with evaporation profiles modeled by SADKAT. Crystallization occurs at the time point indicated by a star, where the average aw was calculated to be 0.381 ± 0.016 and the estimated dry particle size was 5.57 ± 0.04 μm. (b) SEM image of a NaCl microparticle dried at 0% RH, 294 K. (c) SEM image of a NaCl microparticle dried at 40% RH, 294 K.
Figure 2
Figure 2
Degree of circularity for populations of dried particles at varying RHs. 0% RH = orange, 20% RH = green, 30% RH = gray, 40% RH = blue. (a) NaCl, (b) NaCl-(NH4)2SO4 (XNaCl = 0.75), (c) NaCl-(NH4)2SO4 (XNaCl = 0.50), and (d) (NH4)2SO4.
Figure 3
Figure 3
(a) Evaporation profiles for aqueous (NH4)2SO4 (0.02 MFS) droplets at varying RH and 293.2K compared with evaporation profiles modeled by SADKAT. Crystallization occurs at the time point indicated by a star, where the average aw was calculated to be 0.424 ± 0.028% and the estimated dry particle size was 5.51 ± 0.01 μm. (b) SEM image of a (NH4)2SO4 microparticle dried at 0% RH, 294 K. (c) SEM image of a (NH4)2SO4 microparticle dried at 20% RH, 294 K.
Figure 4
Figure 4
(a) Evaporation profiles for aqueous NaCl:(NH4)2SO4 (XNaCl = 0.25, 0.02 MFS) droplets at varying RHs and 291.5 K compared with evaporation profiles modeled by SADKAT. The star points indicate the point of crystallization in the evaporation process, where the average aw was calculated to be 0.360 ± 0.021 and the estimated dry particle size was 6.29 ± 0.01 μm. (b) Normalized radius squared plots for the data shown in panel a. (c) SEM image of a NaCl:(NH4)2SO4 microparticle dried at 0% RH, 294 K. (d) SEM image of a NaCl:(NH4)2SO4 microparticle dried at 20% RH, 294 K.
Figure 5
Figure 5
EDX mapping of a NaCl:(NH4)2SO4 (XNaCl = 0.25, 0.02 MFS) microparticle dried at 0% RH and 294 K. Elements mapped are (a) chlorine, (b) nitrogen, (c) sodium, and (d) sulfur.
Figure 6
Figure 6
(a) Evaporation profiles for aqueous NaCl:(NH4)2SO4 (XNaCl = 0.5, 0.02 MFS) droplets at varying RHs and 293.6 K compared with evaporation profiles modeled by SADKAT. The star points indicate the point of crystallization in the evaporation process, where the average aw was calculated to be 0.356 ± 0.032 and the estimated dry particle size was 5.11 ± 0.04 μm. (b) Normalized radius squared plots for the data shown in panel a. (c) SEM image of a NaCl:(NH4)2SO4 microparticle dried at 0% RH, 294 K. (d) SEM image of a NaCl:(NH4)2SO4 microparticle dried at 20% RH, 294 K.
Figure 7
Figure 7
Mass fraction of the salts predicted by E-AIM to be present in the dried particle at the efflorescence point with SEM images for morphological comparison. Purple = (NH4)2SO4, orange = NH4Cl, yellow = Na2SO4, and blue = NaCl. The RH input for E-AIM was obtained by calculating the aw from the evaporation profiles (see Figures 1, 2, 3, 5, and 7). The change in droplet size from the kinetic data allows for an MFS at the efflorescence point to be calculated; this can be related to an aw using the “aw vs MFS parametrizations” (Table S1).
Figure 8
Figure 8
(a) Evaporation profiles for aqueous NaCl:(NH4)2SO4 (XNaCl = 0.75, 0.02 MFS) droplets at varying RHs and 293.5 K compared with evaporation profiles modeled by SADKAT. The star points indicate the point of crystallization in the evaporation process, where the average aw was calculated to be 0.415 ± 0.010 and the estimated dry particle size was 7.19 ± 0.07 μm. (b) Normalized radius squared plots for the data shown in panel a. (c) SEM image of NaCl:(NH4)2SO4 microparticles dried at 0% RH, 294 K. (d) SEM image of NaCl:(NH4)2SO4 microparticles dried at 30% RH, 294 K.
Figure 9
Figure 9
(a) Evaporation profiles for aqueous NaCl:NH4NO3 (XNaCl = 0.50, 0.02 MFS) droplets at varying RHs and 293.4 K compared with evaporation profiles modeled by SADKAT. The star points indicate the point of crystallization in the evaporation process. (b) Normalized radius squared plots for the data shown in panel a. (c) SEM image of a NaCl:NH4NO3 microparticle dried at 0% RH, 294 K. (d) SEM image of a NaCl:NH4NO3 microparticle dried at 20% RH, 294 K.
Figure 10
Figure 10
EDS mapping of NaCl:NH4NO3 (XNaCl = 0.50, 0.02 MFS) microparticles dried at (a) 0% RH, (b) 20% RH, and (c) 40% RH. Elements mapped are chlorine in red, nitrogen in yellow, and sodium in blue.
Figure 11
Figure 11
(a) Evaporation profiles for aqueous NaCl:CaCl2 (XNaCl = 0.65, 0.1 MFS) droplets at varying RHs and 294.0 K compared with evaporation profiles modeled by SADKAT. The triangle points indicate the equilibration of the particle radius in the evaporation process. (b) Normalized radius squared plots for the data shown in panel a. (c) SEM image of a NaCl:CaCl2 microparticle dried at 0% RH, 294 K. (d) SEM image of a NaCl:CaCl2 microparticle dried at 40% RH, 294 K.

References

    1. Elwardany A. E.; Badra J.; Sim J.; Khurshid M.; Sarathy M.; Im H. G.. Modeling of Heating and Evaporation of FACE I Gasoline Fuel and its Surrogates; SAE International: 2016. DOI: 10.4271/2016-01-0878. - DOI
    1. Masters K.Spray Drying Handbook; George Godwin Ltd.: 1972.
    1. Gharsallaoui A.; Roudaut G.; Chambin O.; Voilley A.; Saurel R. Applications of spray-drying in microencapsulation of food ingredients: An overview. Food Research International 2007, 40 (9), 1107–1121. 10.1016/j.foodres.2007.07.004. - DOI
    1. Cotterell M. I.; Willoughby R. E.; Bzdek B. R.; Orr-Ewing A. J.; Reid J. P. A complete parameterisation of the relative humidity and wavelength dependence of the refractive index of hygroscopic inorganic aerosol particles. Atmos. Chem. Phys. 2017, 17 (16), 9837–9851. 10.5194/acp-17-9837-2017. - DOI
    1. Xie X.; Li Y.; Chwang A. T. Y.; Ho P. L.; Seto W. H. How far droplets can move in indoor environments − revisiting the Wells evaporation−falling curve. Indoor Air 2007, 17 (3), 211–225. 10.1111/j.1600-0668.2007.00469.x. - DOI - PubMed

LinkOut - more resources