. 2025 Jan 21;6(1):101900.
doi: 10.1016/j.xcrm.2024.101900. Epub 2025 Jan 10.

Intestinal Akkermansia muciniphila complements the efficacy of PD1 therapy in MAFLD-related hepatocellular carcinoma

Affiliations

Intestinal Akkermansia muciniphila complements the efficacy of PD1 therapy in MAFLD-related hepatocellular carcinoma

Xue Qian Wu et al. Cell Rep Med. .

Abstract

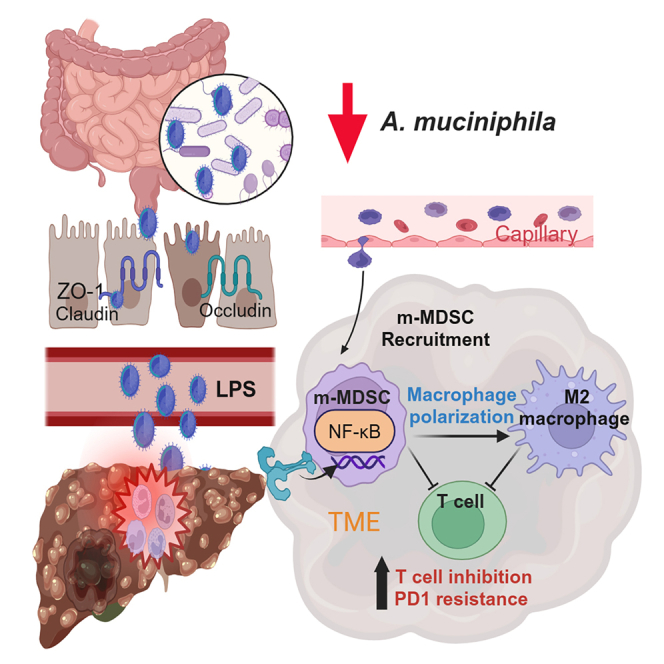
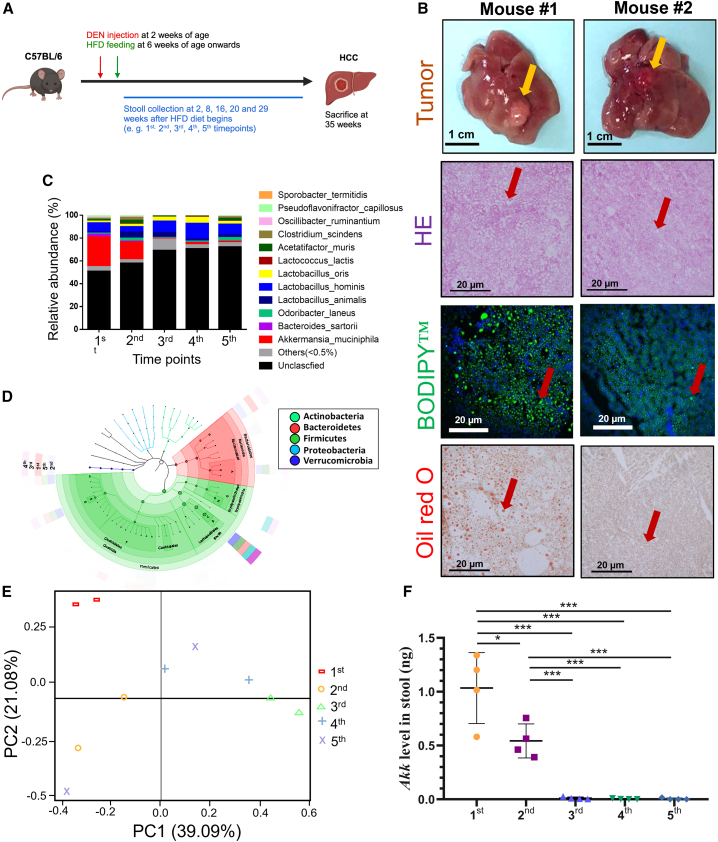
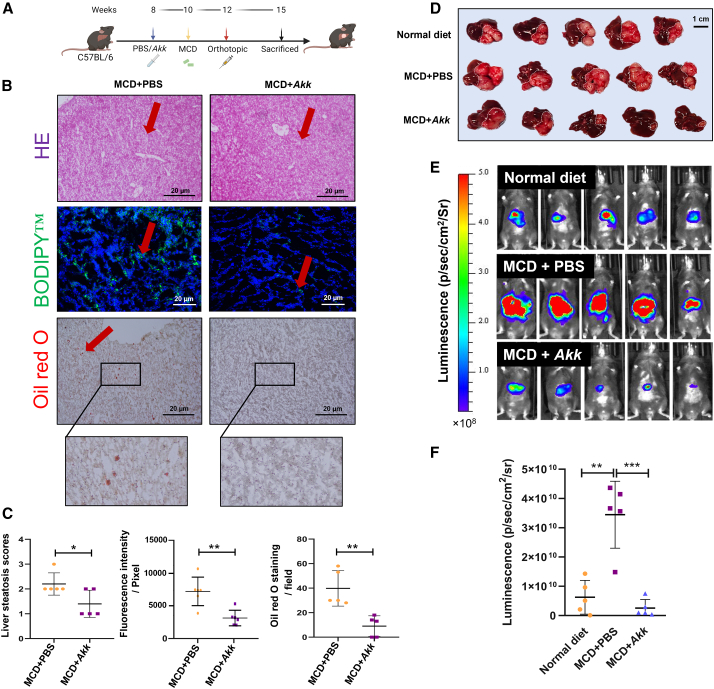
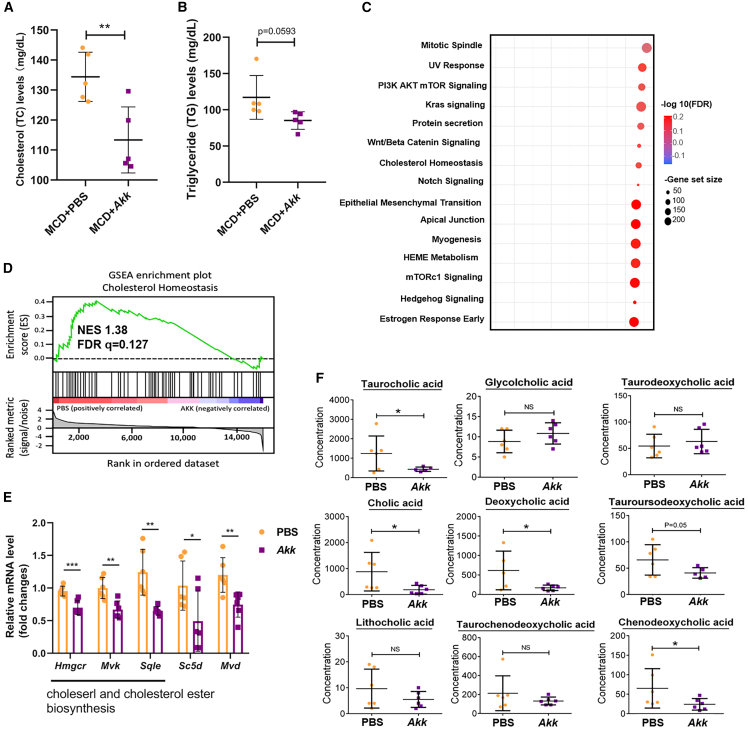
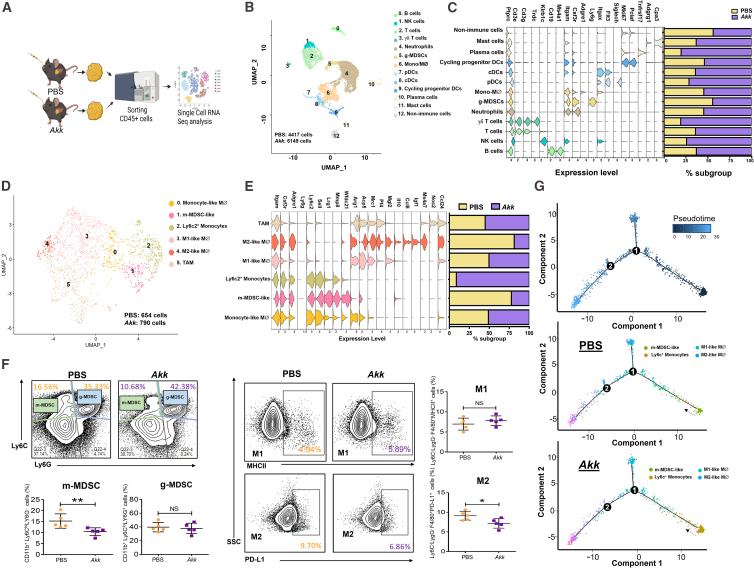
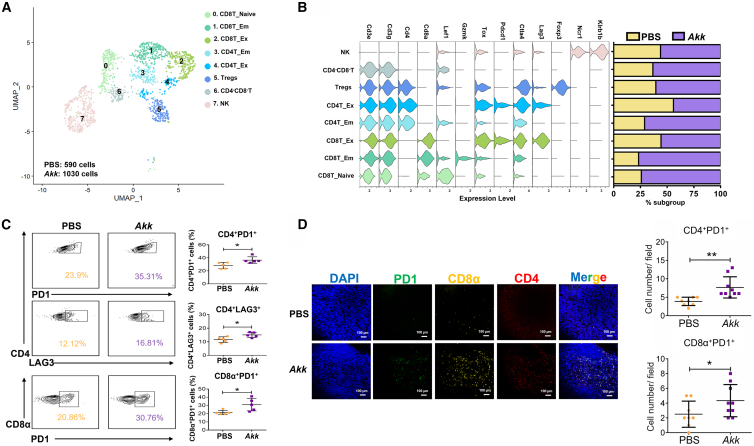
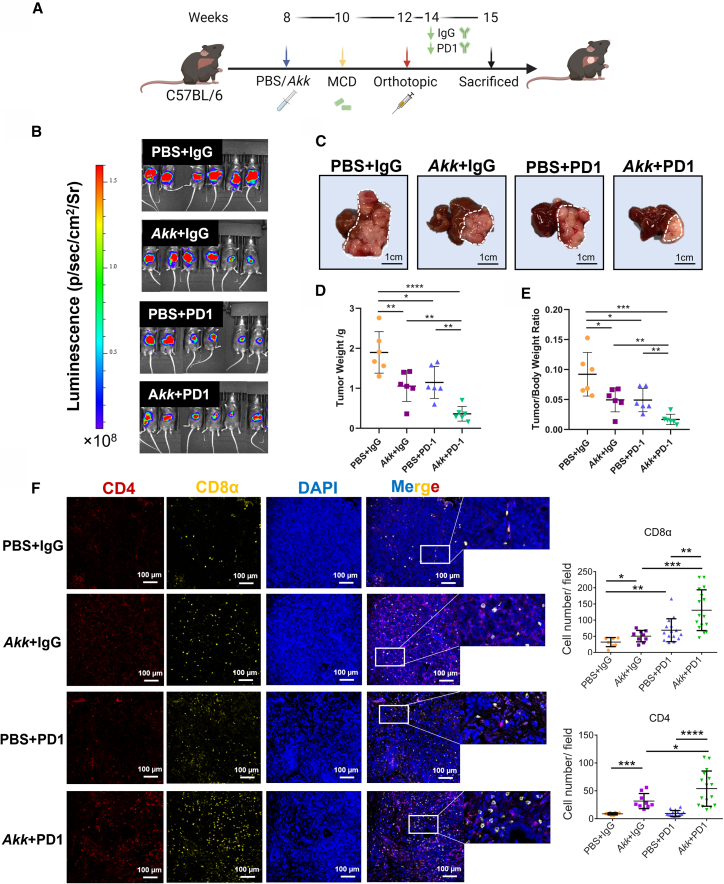
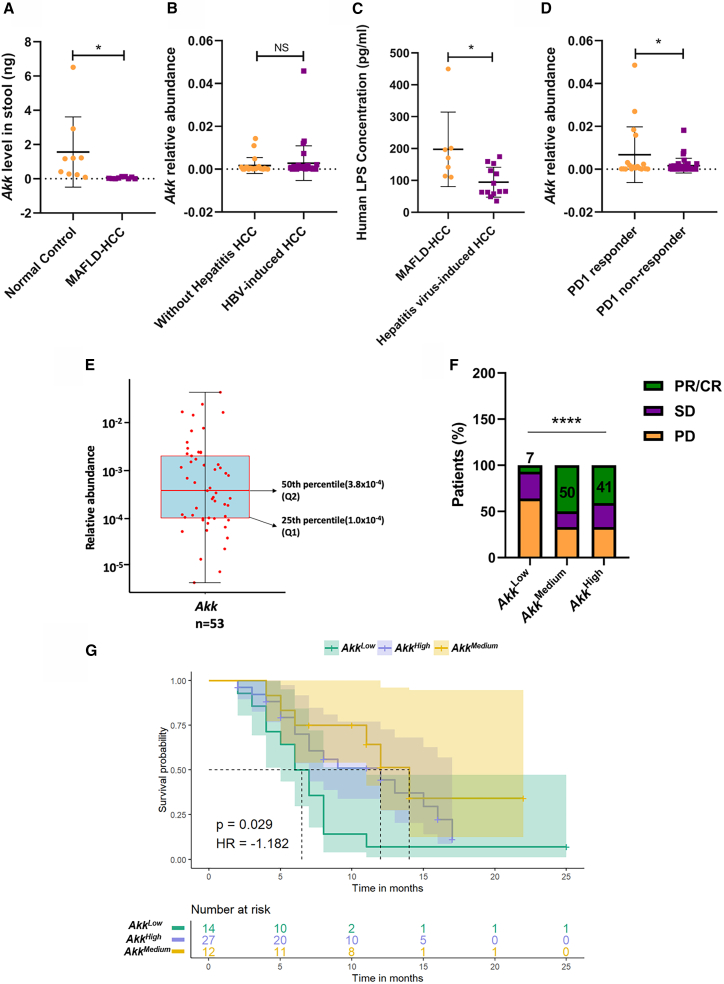
Immune checkpoint inhibitors are not effective for metabolic dysfunction-associated fatty liver disease (MAFLD)-hepatocellular carcinoma (HCC) patients, and identifying the key gut microbiota that contributes to immune resistance in these patients is crucial. Analysis using 16S rRNA sequencing reveals a decrease in Akkermansia muciniphila (Akk) during MAFLD-promoted HCC development. Administration of Akk ameliorates liver steatosis and effectively attenuates the tumor growth in orthotopic MAFLD-HCC mouse models. Akk repairs the intestinal lining, with a decrease in the serum lipopolysaccharide (LPS) and bile acid metabolites, along with decrease in the populations of monocytic myeloid-derived suppressor cells (m-MDSCs) and M2 macrophages. Akk in combination with PD1 treatment exerts maximal growth-suppressive effect in multiple MAFLD-HCC mouse models with increased infiltration and activation of T cells. Clinically, low Akk levels are correlated with PD1 resistance and poor progression-free survival. In conclusion, Akk is involved in the immune resistance of MAFLD-HCC and serves as a predictive biomarker for PD1 response in HCC.

Keywords: Akkermansia muciniphila; HCC; MAFLD; gut microbiota; immune checkpoint therapies.


Conflict of interest statement

Declaration of interests The authors declare no competing interests.

Figures

None
Graphical abstract
Figure 1
Figure 1
Decrease in the level of Akk in the MAFLD-promoted HCC mouse model (A) HFD-fed mice were followed through the experiment. Time point for stool collection: HFD feeding after (1st) 2 weeks, (2nd) 8 weeks, (3rd) 16 weeks, (4th) 20 weeks, and (5th) 29 weeks. (B) Tumor formation was observed at 35 weeks (yellow arrowheads indicate tumor nodules). Representative images of H&E, BODIPY, and oil red O staining at the endpoint are shown. BODIPY staining (green) and DAPI staining (blue). Red arrowheads denote ballooning features and fat deposition. Scale bar, 1 cm for the liver. Scale bar, 20 μm for H&E and IF. (C) Species-level 16S rRNA sequencing results showing the relative abundance (%) of the intestinal bacterial composition of the mice fed HFD. (D) Linear discriminant analysis (LDA) and taxonomic cladograms show differentially abundant taxa among five different time points. (E) Compositional variation at five different time points. (F) qPCR analysis showed a decrease in Akk levels in a time-dependent manner (n = 4). Data are presented as mean ± SD, with each spot representing one subject. Statistical significance was assessed by two-sided Student’s t test. ∗p < 0.05, ∗∗∗p < 0.001. See also Figure S1 and Table S3.
Figure 2
Figure 2
The effect of Akk administration on tumor formation in an orthotopic MAFLD-HCC mouse model (A) Experimental schedule for characterizing the role of Akk in the orthotopic MAFLD-HCC mouse model. (B) Representative images of H&E, BODIPY, and oil red O staining at the endpoint are shown. Red arrowheads denote ballooning features and fat deposition. Scale bar, 20 μm. (C) Liver steatosis scores of liver sections, fluorescence intensity of BODIPY, and oil red O staining counts were shown in PBS- and Akk-treated mice fed with MCD diet (n = 5). (D) Representative images of MAFLD-HCC tumors generated with an MCD diet and orthotopic implantation of RIL-175 HCC cells following treatment with a normal diet with PBS (normal + PBS, n = 5), an MCD diet with PBS (MCD + PBS, n = 5), and an MCD diet with Akk (MCD + Akk, n = 5); scale bar, 1 cm. Dotted lines indicate tumor regions. (E) Bioluminescent imaging for luciferase activity in the PBS (normal + PBS, n = 5), an MCD diet with PBS (MCD + PBS, n = 5), and an MCD diet with Akk (MCD + Akk, n = 5) treatment groups on day 20 upon post-orthotopic transplantation. (F) The dot plot shows the total flux of luciferase signal captured by in vivo image system (IVIS) in each group on day 20 upon post-orthotopic transplantation (n = 5). Data are presented as mean ± SD, with each spot representing one subject. Statistical significance was assessed by two-sided Student’s t test. ∗p < 0.05, ∗∗p < 0.01, ∗∗∗p < 0.001. See also Figures S2–S4.
Figure 3
Figure 3
The effect of Akk administration on hepatic steatosis, cholesterol biosynthesis, and bile acid metabolism (A and B) (A) Serum TC and (B) TG levels in PBS (n = 5) and Akk (n = 5) groups were shown. (C) GO analysis revealed enrichment of several cellular pathways in the control PBS group compared with the Akk-treated groups. (D) GSEA showed the enrichment of cholesterol homeostasis in the control PBS group. (E) By qPCR analysis, the expression of genes related to cholesterol homeostasis, including Hmgcr, Mvk, Sqle, Sc5d, and Mvd, was examined in the Akk-treated and PBS-control groups. (F) Serum bile acid metabolomics panels between Akk-treated (n = 5) and PBS-control groups (n = 5) were compared by liquid chromatography-mass spectrometry. Data are presented as mean ± SD, with each spot representing one subject. Statistical significance was assessed by two-sided Student’s t test. ∗p < 0.05, ∗∗p < 0.01, ∗∗∗p < 0.001. NS, not significant. See also Figure S5.
Figure 4
Figure 4
The effect of Akk administration on m-MDSCs and M2 macrophages in tumors in an orthotopic MAFLD-HCC mouse model (A) Schematic diagram showing the workflow of the isolation of CD45+ cells from HCC tumors treated with either PBS-control group (n = 5) or Akk-treated group (n = 7) for scRNA-seq analysis. (B) Uniform manifold approximation and projection (UMAP) plot showing 12 distinct clusters resulting from scRNA-seq of sorted CD45+ cells derived from tumors harvested from PBS- and Akk-treated group. (C) Violin plot displayed the marker genes for each immune cell cluster. The percentage of major immune cell types in PBS- or Akk-treated group was calculated and shown as bar plot. Higher percentage of cells present in the subpopulation of mast cells, plasma cells, DCs, T cells, NK cells, and B cells were observed in the Akk-treated group. (D) UMAP plot demonstrating secondary clusters obtained from two biological groups and identified as monocytic like macrophages, Ly6c2+ monocytes, m-MDSCs, M1 macrophages, M2 macrophages, and TAMs. (E) Violin plot displayed the marker genes for each immune cell cluster. Bar plot showing the alterations in subsets of cell populations in response to the indicated treatments. (F) Representative flow cytometry plots of m-MDSCs (left) and g-MDSCs (right) in the PBS- and Akk-treated groups (n = 5). Representative flow cytometry plots of M1 macrophages (F4/80+MHCII+) and M2 macrophages (F4/80+PD-L1+) in the PBS- and Akk-treated groups (n = 5). (G) Steady-state RNA velocity of m-MDSCs, Ly6c+ monocytes, and M1/M2 macrophages. Data are presented as mean ± SD, with each spot representing one subject. Statistical significance was assessed by two-sided Student’s t test. ∗p < 0.05, ∗∗p < 0.01. NS, not significant. See also Figures S6 and S7.
Figure 5
Figure 5
The effect of Akk administration on CD4/CD8 in tumors of Akk-treated mice (A) UMAP plot shows 8 clusters of NK and T cells, including CD8T_Naive, CD8T_EM, CD8_Ex, CD4T_EM, CD4T_Ex, Tregs, CD4CD8 cells, and NK cells and doublets, by scRNA-seq based on their marker expression. (B) Violin plots displayed the marker genes for each immune cell cluster. Bar plot showing increases in CD4CD8 T cells, effector memory CD4+ cells, and naive and effector memory CD8+ T cells in the tumors of the Akk-treated groups. (C) Representative flow cytometry plots of CD4+PD1+/CD4+LAG3+ and CD8α+PD1+ T cells in the PBS- and Akk-treated groups (n = 5). (D) Multiplex IF staining showed increased infiltration of CD4+PD1+ and CD8α+PD1+ populations in the Akk-treated group. PD1 (green), CD8α (orange), CD4 (red), and DAPI staining (blue). Scale bar, 100 μm. Data are presented as mean ± SD, with each spot representing one subject. Statistical significance was assessed by two-sided Student’s t test. ∗p < 0.05, ∗∗p < 0.01. See also Figure S8.
Figure 6
Figure 6
The effect of Akk/PD1 on the suppression of tumor growth in an orthotopic MAFLD-HCC mouse model (A) Schematic diagram of the treatment regimen of Akk (5 × 109 colony-forming units), PD1 (5 mg/kg), and the combined treatment (Akk+PD1) group. (B) Bioluminescence imaging of luciferase in C57BL/6 mice in 4 treatment groups, including PBS + IgG (n = 6), Akk + IgG (n = 6), PBS + PD1 (n = 6), and Akk + PD1 (n = 6). (C) Representative images of MAFLD-HCC tumors in the four treatment groups are shown. Scale bar, 1 cm. (D and E) (D) Graphs showing the tumor weight and (E) liver/body weight ratio generated from mice at the endpoint (n = 6). (F) Increased infiltration of CD4+ and CD8α+ T cells in Akk-treated groups. CD4 (red), CD8α (orange), and DAPI staining (blue). Scale bar, 100 μm. Data are presented as mean ± SD, with each spot representing one subject. Statistical significance was assessed by two-sided Student’s t test. ∗p < 0.05, ∗∗p < 0.01, ∗∗∗p < 0.001, ∗∗∗∗p < 0.0001. See also Figures S9–S12.
Figure 7
Figure 7
Association between Akk and PD1 responses in HCC patients (A) Expression of Akk was examined in the MAFLD-HCC (n = 9) and normal control groups (n = 9) using qPCR analysis. (B) Relative abundance of Akk was examined in the group with HBV-induced HCC (n = 35) and the group without hepatitis HCC (n = 22) using 16S rRNA analyses. (C) By ELISA, the human plasma LPS level was significantly increased in the MAFLD-related HCC groups (n = 9) compared to that in the hepatitis virus-induced HCC groups (n = 20). (D) Analysis of metagenomic sequencing of Akk relative abundance in the PD1 responder (n = 18) and PD1 non-responder groups (n = 35). (E) Distribution of patients with the relative abundance of Akk. The midline of the boxplots corresponds to the 50th percentile. The lower hinges of the boxplots correspond to the 25th percentile. (F) The percentage of patients with different responses to PD1 treatment among the AkkHigh, AkkMedium, and AkkLow groups. (G) Progression-free survival depended on the relative abundance of Akk. (p = 0.029, hazard ratio [HR] = −1.182). Data are presented as mean ± SD, with each spot representing one subject. Statistical significance was assessed by two-sided Student’s t test in (A)–(D). Statistical significance was assessed by chi-squared test in (E). Statistical significance was assessed by log rank test in (F). ∗p < 0.05, ∗∗∗∗p < 0.0001. NS, not significant. See also Tables S1–S3.

References

    1. Yang J.D., Hainaut P., Gores G.J., Amadou A., Plymoth A., Roberts L.R. A global view of hepatocellular carcinoma: trends, risk, prevention and management. Nat. Rev. Gastroenterol. Hepatol. 2019;16:589–604. doi: 10.1038/s41575-019-0186-y. - DOI - PMC - PubMed
    1. Huang D.Q., El-Serag H.B., Loomba R. Global epidemiology of NAFLD-related HCC: trends, predictions, risk factors and prevention. Nat. Rev. Gastroenterol. Hepatol. 2021;18:223–238. doi: 10.1038/s41575-020-00381-6. - DOI - PMC - PubMed
    1. Eslam M., Newsome P.N., Sarin S.K., Anstee Q.M., Targher G., Romero-Gomez M., Zelber-Sagi S., Wai-Sun Wong V., Jean-François D., Jörn M., et al. A new definition for metabolic dysfunction-associated fatty liver disease: An international expert consensus statement. J. Hepatol. 2020;73:202–209. doi: 10.1016/j.jhep.2020.03.039. - DOI - PubMed
    1. Younossi Z., Anstee Q.M., Marietti M., Hardy T., Henry L., Eslam M., George J., Bugianesi E. Global burden of NAFLD and NASH: trends, predictions, risk factors and prevention. Nat. Rev. Gastroenterol. Hepatol. 2018;15:11–20. doi: 10.1038/nrgastro.2017.109. - DOI - PubMed
    1. Anstee Q.M., Reeves H.L., Kotsiliti E., Govaere O., Heikenwalder M. From NASH to HCC: current concepts and future challenges. Nat. Rev. Gastroenterol. Hepatol. 2019;16:411–428. doi: 10.1038/s41575-019-0145-7. - DOI - PubMed

MeSH terms

Substances

Supplementary concepts